Cosmos Bullish Consolidation Leads To Surprise 101%+ Jump!We will keep it simple on this one.
Cosmos (ATOMUSDT) is now super bullish with 6 days consolidating above EMA10, closing green each time.
This is a type of accumulation that normally lead to strong price jump.
Additional details on the chart.
Namaste.
ATOMUSDT

long ATOM$ATOM is bouncing off the bearish trendline which was broken to the upside and forming the successful retest of the breakout. Bullish movement to resistance level at 8,4$ is possible.


ATOMusdt 1hYou can expect a return from here, well a risky deal, but I only take 0.5% risk.
Please comment so that we can have a better view of the market.


Atomic bombAfter lowering the price and reaching support, it seems that it is time to go long, you can get a very good profit for a short time

ATOMUSDT 1hA downside deal for Atom Currency, do you agree?
Control is in the hands of the supply area.

short ATOM$ATOM has formed a Flag pattern, which was broken to the downside. Bearish trend is expected to continue to support level at 4,3$
Cosmos Hub (ATOM) - June 15hello?
Traders, welcome.
By "following", you can always get new information quickly.
Please also click "Like".
Have a good day.
-------------------------------------
(ATOMUSDT 1W Chart)
Below 7.62 is likely to be a mid- to long-term investment area.
Therefore, the key issue is whether it can rise above 7.62 and find support.
(1D chart)
In the short and medium term, it needs to move above 10.32 and find support to turn into an uptrend.
However, careful trading is required as it is expected that the uptrend will continue only when it rises above the uptrend line.
Accordingly, it should rise above 17.65.
The volume profile section is formed below 4.68.
This volume profile section is the source of strength that supports the ATOM coin, so I think that it is a price range that can be purchased by those who want to invest in the medium to long term.
However, since the coin market is unstable, it is recommended to check the sideways movement.
------------------------------------------------------------ -----------------------------------------------------
** All indicators are lagging indicators.
Therefore, it is important to be aware that the indicator will move accordingly as price and volume move.
However, for the sake of convenience, we are talking in reverse for the interpretation of the indicator.
** The MRHAB-T indicator used in the chart is an indicator of our channel that has not been released yet.
** The OBV indicator was re-created by applying a formula to the DepthHouse Trading indicator, an indicator disclosed by oh92. (Thanks for this.)
** Support or resistance is based on the closing price of the 1D chart.
** All descriptions are for reference only and do not guarantee a profit or loss in investment.
(Short-term Stop Loss can be said to be a point where profit and loss can be preserved or additional entry can be made through split trading. It is a short-term investment perspective.)
---------------------------------

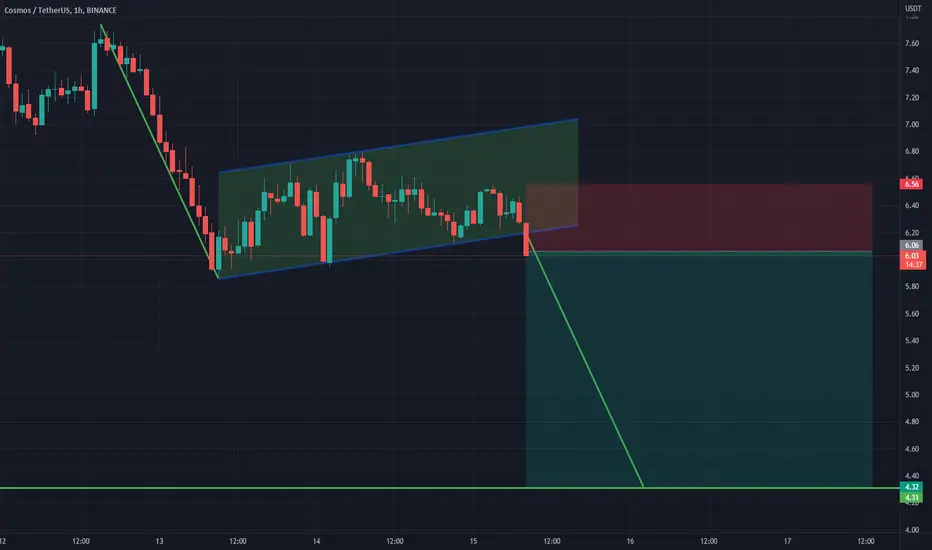
Cosmos ATOM short Entry Range, Take Profit and Stop LossATOM/USDT short
Entry Range: $6.25 - 7.10
Price Target 1: $5.90
Price Target 2: $5.40
Price Target 3: $4.70
Stop Loss: $7.75

ATOM FUTURES - 12H QUADRUPLE DIVERGENCEQuadruple AO Divergence forming higher lows and lower lows on price.
12H bottom is close for a reversal of trend.
Long entry near these areas or wait for confirmation candles in the following days.
NFA DYOR !!

atom.atom,
same as the other coins;
-5 waves up was completed,
-currently working on 3 waves down.
-look for a bottom somewhere in the middle of 2023.
-0.618% is a good candidate for a bottom, but because it has already gone so deep, it very well could get to the 0.786 after this little fake out to the upside.
---
best of luck 💰


ATOM range moves $ATOM since its in a range oone of the moves i expect is this. lets see what happens

ATOM : A Bullish idea🟢ATOM / H2 / Log chart
Atom is bouncing from its double bottom support and is trading inside a falling wedge which is a bullish pattern.
Also, ATOM is in its Weekly support zone so longing a small size of ATOM if it breaks above the resistance of the falling wedge.

ATOM/USDT BUYING SETUP (SWING)Buying #ATOM/USDT (SWING)
$ATOM in daily demand zone , we can see before after hit this zone and will pullback . at crash a years ago ATOM sustain in here and make new all time high . potential pullback minimum just retest the supply, and support RSI showing some bullish divergence
we can close if daily closing below daily demand zone
Buy zone : 8.88 - 8 - 7.3
Target : 9.71 - 10.96 - 13.8 - 15.25 - 16.97
Stop : 6.9

AtomusdtHello friends i think that next target is that box but maby befor that make a little correction like i draw onthe chart

ATOMUSDT Analysis (LOCAL VISION)Hello friends.
Please support my work by clicking the LIKE button👍(If you liked). Also i will appreciate for ur activity. Thank you!
Everything on the chart.
Entry: market and lower
Target zone: 13-14$
after first target reached move ur stop to breakeven
Stop: ~7 (depending of ur risk). ALWAYS follow ur RM .
Risk/Reward: 1 to 3
risk is justified
Good luck everyone!
Follow me on TRADINGView, if you don't want to miss my next analysis or signals.
It's not financial advice.
Dont Forget, always make your own research before to trade my ideas!
Open to any questions and suggestions.

ATOMUSDT Analysis (LOCAL VISION)Hello friends.
Please support my work by clicking the LIKE button👍(If you liked). Also i will appreciate for ur activity. Thank you!
Everything on the chart.
Entry: market and lower
Target zone: 13 - 15$
after first target reached move ur stop to breakeven
Stop: ~9 (depending of ur risk). ALWAYS follow ur RM .
Risk/Reward: 1 to 4
risk is justified
Good luck everyone!
Follow me on TRADINGView, if you don't want to miss my next analysis or signals.
It's not financial advice.
Dont Forget, always make your own research before to trade my ideas!
Open to any questions and suggestions.

Atom Atom is currently near it's weekly support zone. Those who want to trade can wait for a breakout above $9.7 for the target of $12-12.3. Breaking below the weekly support will lead to $6.8 and even $4.5. Those who want to invest for long term can start accumulating but keep money for DCA.


ATOMUSDT - SETUPATOMUSDT's price is hovering around strong weekly support and trying to get some breathing as the price dropped significantly from ATH. Bulls can trigger their plans in the upcoming sessions by showing some resilience at the bottom. So accumulation can be a good preferred strategy.
