ATOM/USDT – Long-Term Accumulation Phase Nearing Breakout?📊 Full Technical Breakdown:
🟡 Long-Term Accumulation Zone
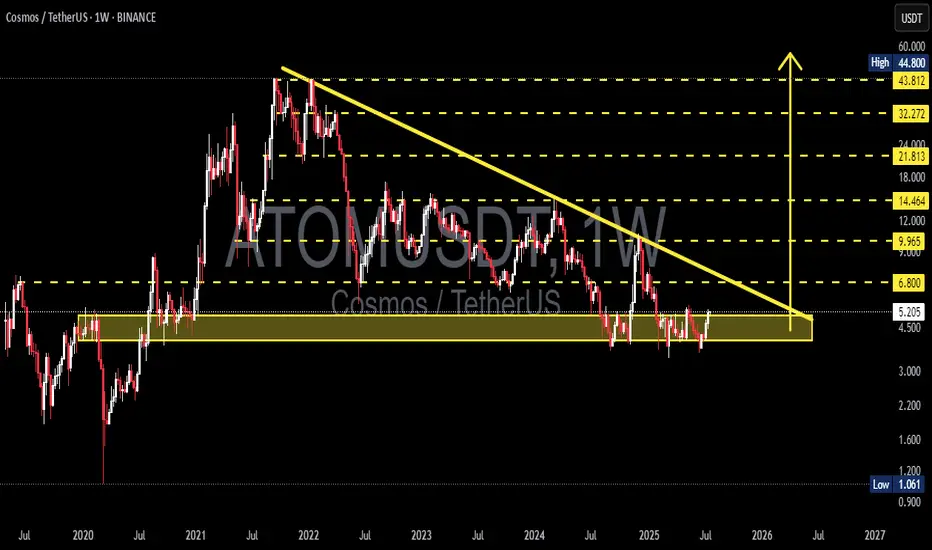
ATOM is currently trading within a horizontal accumulation zone between $4.50 and $5.20, which has held strong since early 2021. This key area has acted as a solid floor across multiple market cycles, suggesting strong buying interest from long-term holders or institutional participants.
🔻 Descending Trendline Resistance
Since reaching its all-time high (~$44.8) in late 2021, ATOM has been in a sustained downtrend, forming a descending trendline acting as dynamic resistance. The price is now retesting this line for the first time in months, hinting at a potential trend reversal setup if broken.
🧱 Potential Descending Triangle Breakout
The current structure closely resembles a Descending Triangle, with a flat base of support and a descending resistance line. While typically a bearish continuation pattern, in this context — combined with prolonged oversold conditions — it may serve as a bear trap and precede a major breakout.
✅ Bullish Scenario (Confirmed Breakout & Trend Reversal):
If ATOM breaks and closes weekly above $6.80, the breakout could trigger a powerful move, marking the start of a new macro bullish phase.
📈 Upside targets based on historical resistance levels:
📍 $9.96 → former short-term resistance
📍 $14.46 → previous support-turned-resistance
📍 $21.81 → major structural breakdown point
📍 $32.27 → upper resistance zone
🎯 $43.81 – $44.80 → All-Time High (ATH) zone
🟢 Potential upside: Over 700% from current levels if breakout is validated with strong momentum and volume.
❌ Bearish Scenario (Rejection & Breakdown):
If price gets rejected at the trendline and breaks below the $4.50 accumulation floor:
📉 Downside targets to watch:
🔻 $3.00 → previous minor support
🔻 $2.20 → pandemic-era support zone
🔻 $1.06 → historical bottom (2020)
This would confirm a continuation of the macro downtrend and indicate that further accumulation is needed before any major reversal.
📌 Key Technical Confirmation Signals:
Weekly Volume: A true breakout must be supported by a volume spike well above the weekly average.
RSI (Relative Strength Index): A move above 50 on the weekly RSI would support a bullish thesis.
Bullish Divergence (on lower timeframes): Would strengthen the breakout probability.
🔮 Strategic Takeaway:
ATOM is at a make-or-break level. With a long period of sideways consolidation and tightening price action, a high-volatility move is imminent.
> For long-term investors, this zone offers a high reward-to-risk opportunity. For traders, it's time to prepare for a confirmed breakout or rejection trade setup.
#ATOMUSDT #CosmosAnalysis #CryptoBreakout #TechnicalAnalysis #DescendingTriangle #BullishSetup #AltcoinSeason #CryptoMomentum #AccumulationZone #TrendReversal #CryptoSignals
Atomusdtanalysis
ATOMUSDT 1W Analysis ATOM ~ 1W Analysis
#ATOM Buy back gradually from here if you still have confidence in this coin with a short term target of at least 20%+ from here.

ATOMUSDT 1D AnalysisATOM ~ 1D Analysis
#ATOM Buy after successfully penetrating this resistant line with a short -term target of at least 10%+ from here.

ATOMUSDT – Accumulation Phase with Bullish Breakout Potential!ATOM is currently trading within a key accumulation zone, showing signs of potential reversal after a liquidity sweep below the 2024 bottom support level around 3.63 USDT. This move may indicate the presence of strong demand at lower levels.
As long as ATOM holds above the 3.63 USDT level on a daily closing basis, the bullish scenario remains valid. A sustained move above the 5.15 USDT resistance may confirm the start of a bullish breakout, with potential upside targets at 7.76 and 9.30 USDT.
However, a daily close below 3.63 USDT would invalidate the bullish bias and suggest further downside pressure.
Key Levels to Watch:
Support: 3.63 (bottom support of 2024)
Resistance: 5.15 (accumulation zone breakout level)
Bullish Targets: 7.76 and 9.30
The structure remains bullish unless invalidated by a breakdown below support. Always manage risk accordingly.
#ATOM #COSMOS #ATOMUSDT

ATOM Will Reach $3 In This Bear MarketHello, Skyrexians!
As we shared with you earlier we suppose that the last bearish wave will happen for all altcoins in April and BINANCE:ATOMUSDT is not the exception. Despite the growth against the market the waves order shall be remained and we will finally see this dump.
Let's take a look at the daily chart. You can tell us that wave 5 has been already finished recently and now this is bull run but pay attention that Awesome oscillator has not crossed the zero line. It means that it was wave 5 inside wave 3. Now price is in wave 4 and entering the target area. The most optimistic scenario if price will reach $5.7 at 0.38 Fibonacci retracement, but it can reverse even now as well. Finally it will reach $2.5-3.5 in the wave 5 in April.
Best regards,
Skyrexio Team
___________________________________________________________
Please, boost this article and subscribe our page if you like analysis!

#ATOMUSDT shows a strong bullish impulse 📈 LONG BYBIT:ATOMUSDT.P from $5.100
🛡 Stop loss $4.948
🕒 4H Timeframe
⚡️ Overview:
➡️ The POC (Point of Control) BYBIT:ATOMUSDT.P is at $4.628, which marks the high-volume area from which the current bullish move started.
➡️ A breakout above the $5.00 resistance occurred with strong volume, confirming bullish strength.
➡️ The upward move is supported by large green candles and rising trading activity.
➡️ The $5.100 entry level aligns with previous consolidations and acts as a flipped support.
🎯 TP Targets:
💎 TP 1: $5.188
💎 TP 2: $5.280
💎 TP 3: $5.350
📢 Watch for price holding above $5.00 — it’s key for continued upside.
📢 If price drops below $4.948, the long setup becomes invalid.
BYBIT:ATOMUSDT.P shows a strong bullish impulse — confirmation via volume and breakout supports the continuation scenario.

ATOMUSDT 1WATOM ~ 1W Analysis
#ATOM Buy gradually from here if you still have a Conviction on this Coin. This is a very good support block for now.

#ATOMUSDT further bullish movement📈 LONG BYBIT:ATOMUSDT.P from $4.842
🛡 Stop Loss: $4.800
⏱ 1H Timeframe
✅ Overview:
➡️ BYBIT:ATOMUSDT.P is bouncing off key support at $4.800, confirming buying interest.
➡️ The price has broken through $4.842, which could trigger further bullish momentum.
➡️ POC is positioned lower, suggesting strong volume accumulation below, reinforcing the bullish trend.
➡️ Primary upside target: $4.905, followed by $4.960 if momentum continues.
⚡ Plan:
➡️ Enter LONG from $4.842 if price holds above this level.
➡️ Manage risk with Stop-Loss at $4.800 to protect against sudden reversals.
➡️ Main upside targets:
🎯 TP Targets:
💎 TP1: $4.905 — first resistance, potential profit-taking level.
🔥 TP2: $4.960 — next strong level for possible exit.
📢 If the price holds above $4.842, further upside toward $4.905 and $4.960 is likely.
📢 However, if it drops below $4.800, the bullish setup may be invalidated.
🚀 BYBIT:ATOMUSDT.P Expecting further bullish movement!

ATOM Back at Crucial Level: What Should You Do...?ATOM is currently at a significant level of 5.650, which has served as both support and resistance multiple times throughout the year. It acted as support in July 2024, as resistance at NOV 2024, and is now functioning as support again. Presently, ATOM is in a downtrend since reaching a high of 10.600. Given that it is at this support level, you might consider buying if you are interested, or you could wait for further confirmation before making a decision.

ATOMUSDT 1WATOM ~ 1W
#ATOM If you still have Conviction on this coin,. Don't miss this trade,. Buy with a minimum target of 20%++

ATOMUSDT 1WATOM ~ 1W
#ATOM This is an important support block for now. if you have Conviction on the coin,. Buying in stages here isn't too bad.

ATOM: Bullish Momentum | go longBINANCE:ATOMUSD | Buy Entry executed on daily chart. Daily Anchored VWAP support found at $7.28 and also it is 50% Fib retracement area as well.
Note: Green Yellow Candle. It is a Buy Signal triggered on daily candle close. Following candle is confirmation candle. As it broke the high of Green Yellow Candle entered long with stop loss. Focus on risk management. Don't let your winning position into loss.

ATOMUSDTATOM ~ 1W
#ATOM If you have Conviction on this Coin, Maybe this support Block will be a very good purchase to start accumulating again. at least for 20%+ profits

ATOMUSDTATOM ~ 1W ✅
#ATOM If you have Conviction on this Coin, Maybe this support Block will be a very good purchase to start accumulating again. at least for 20%+ profits


ATOM Holders! FOLLOW ME~!GOOD DAY, guys.
Do you have a nice trading?
We brought a ATOMUSDT chart for friends who are curious.
If it is supported by the GREEN uptrend line, We expect that candle breaks through the RED long-term downtrend line.
After breaking through, It will touch the PURPLE uptrend line.
If It isn't supported by the GREEN uptrend line, It will challenge to rise up again after consolidation from the ORANGE downtrend line.

ATOMUSDT Elliott Waves AnalysisHello friends.
Please support my work by clicking the LIKE button👍(If you liked). Also i will appreciate for ur activity.
Everything on the chart.
Entry: Market and lower
Targets: 15 - 18 - 21
Stop: under 6.4 (depending of ur risk).
RR: 1 to 4
ALWAYS follow ur RM.
risk is justified
Good luck everyone!
It's not financial advice.
DYOR!

ATOM/USDT IDEA Atom/USDT Analysis:
On the weekly timeframe, a trendline breakout has already been confirmed, and a retest appears to be nearing completion. Anticipating a significant bullish rally in the midterm, with a target around $30. Please note that this information is not financial advice. Kindly conduct your research (DYOR) before making any investment decisions.

ATOMUSD 1WATOM ~ 1W 📈
#ATOM The retest of this Support line has been successful. we will remain bulls as long as Atom price is above this Support line.

ATOMUSDT Elliott Waves AnalysisHello friends.
Please support my work by clicking the LIKE button👍(If you liked). Also i will appreciate for ur activity. Thank you!
Everything on the chart.
Increased risk.
Entry: market and lower
Targets: 15 - 17 - 19
after first target reached move ur stop to breakeven
Stop: ~10.2 (depending of ur risk).
RR: 1 to 5
ALWAYS follow ur RM .
risk is justified
Good luck everyone!
Follow me on TRADINGView, if you don't want to miss my next analysis or signals.
It's not financial advice.
DYOR!

ATOMUSDT Elliott Waves AnalysisHello friends.
Please support my work by clicking the LIKE button👍(If you liked). Also i will appreciate for ur activity. Thank you!
Everything on the chart.
waiting for atleast 18-21 zone, then will see, will depends on structure
Entry: market and lower
Targets: 17.5 and 19.5
after first target reached move ur stop to breakeven
Stop: (depending of ur risk). ALWAYS follow ur RM .
risk is justified
Good luck everyone!
Follow me on TRADINGView, if you don't want to miss my next analysis or signals.
It's not financial advice.
DYOR!

ATOMUSDT Long Setup!ATOMUSDT Technical analysis update
ATOM price multiple times bounced from its major support zone at $8.5 l, and multiple times the price touched the trend resistance line. This time, the price is poised to break its resistance trend line and we can expect a good up move.
Buy zone : Below $11.60
Stop loss : $10.30
Regards
Hexa

ATOMUSDT Elliott Waves (Local Setup)Hello friends.
Please support my work by clicking the LIKE button👍(If you liked). Also i will appreciate for ur activity. Thank you!
Everything on the chart.
Entry: Market and lower
Targets: 10 - 10.3 - 10.6
Stop: ~8.75 (depending of ur risk).
RR: 1 to 3
ALWAYS follow ur RM.
risk is justified
Good luck everyone!
Follow me on TRADINGView, if you don't want to miss my next analysis or signals.
It's not financial advice.
Dont Forget, always make your own research before to trade my ideas!
Open to any questions and suggestions
