KRAFT 1D RANGE TRADESRanges, Triangles, Ascending Triangle, and Descending Triangles are repeatable trading chart patterns.
Ranges & Triangles are consolidation chart patterns that can breakout either direction.
Ascending and descending chart patterns will have a directional bias depending on the previous incoming trend.
Each chart pattern will have defining trendlines of the support/resistance levels creating the pattern.
What ever time frame you are trading this chart pattern, wait for a candle close outside of the trendline in the direction of the breakout candle. (Our time frame preference is the Daily chart).
Add volume indicator - Volume is the amount of $ that went into a particular candle or in Forex the # of trades that took place.
Add ATR indicator - Volatility is the amount of price movement that occurred. Use the ATR to measure the price movement.
When you see descending volume bars and descending atr line (which indicates volatility) this shows
a dis-interest in traders to invest in this pair creating consolidation which creates the chart pattern.
Trade Management after there is a breakout candle close.
1 - Position size (compare volume bar to volume ma line).
a - Breakout candle must be 100% of average volume for a full position size.
b - If 75% of average volume then ½ position size.
2 - Enter two trades.
3 - SL for both trades will be 1.5 x ATR.
4 - 1st trade TP will be 1 x ATR.
5 - No TP on 2nd trade – letting profit run and adjusting SL to follow price.
6 - When 1st TP hit – move 2nd trade SL to breakeven.
7 - Adjust the 2nd trade SL to follow price.
*8 - When breakout candle is more than 1 ATR from breakout candle open.
a - Enter 1st trade at candle close with ½ position size.
b - Enter 2nd trade with a pending limit order that is 1 ATR of breakout candle open.
c – Price should pullback to that pending limit order for 2nd trade.
ATR

LTCUSD 1D TRIANGLE BREAKOUT TRADESTriangles, Ascending Triangle, Descending Triangles and Ranges are repeatable trading chart patterns.
Triangles and ranges are consolidation chart patterns that can breakout either direction.
Ascending and descending chart patterns will have a directional bias depending on the previous incoming trend.
Each chart pattern will have defining trendlines of the support/resistance levels creating the pattern.
What ever time frame you are trading this chart pattern, wait for a candle close outside of the trendline in the direction of the breakout candle. (Our time frame preference is the Daily chart).
Add volume indicator - Volume is the amount of $ that went into a particular candle or in Forex the # of trades that took place.
Add ATR indicator - Volatility is the amount of price movement that occurred. Use the ATR to measure the price movement.
When you see descending volume bars and descending atr line (which indicates volatility) this shows
a dis-interest in traders to invest in this pair creating consolidation which creates the chart pattern.
Trade Management after there is a breakout candle close.
1 - Position size (compare volume bar to volume ma line).
a - Breakout candle must be 100% of average volume for a full position size.
b - If 75% of average volume then ½ position size.
2 - Enter two trades.
3 - SL for both trades will be 1.5 x ATR.
4 - 1st trade TP will be 1 x ATR.
5 - No TP on 2nd trade – letting profit run and adjusting SL to follow price.
6 - When 1st TP hit – move 2nd trade SL to breakeven.
7 - Adjust the 2nd trade SL to follow price.
*8 - When breakout candle is more than 1 ATR from breakout candle open.
a - Enter 1st trade at candle close with ½ position size.
b - Enter 2nd trade with a pending limit order that is 1 ATR of breakout candle open.
c – Price should pullback to that pending limit order for 2nd trade.

LTCUSD 1D TRIANGLE PATTERN Triangles, Ascending Triangle, Descending Triangles and Ranges are repeatable trading chart patterns.
Triangles and ranges are consolidation chart patterns that can breakout either direction.
Ascending and descending chart patterns will have a directional bias depending on the previous incoming trend.
Each chart pattern will have defining trendlines of the support/resistance levels creating the pattern.
What ever time frame you are trading this chart pattern, wait for a candle close outside of the trendline in the direction of the breakout candle. (Our time frame preference is the Daily chart).
Add volume indicator - Volume is the amount of $ that went into a particular candle or in Forex the # of trades that took place.
Add ATR indicator - Volatility is the amount of price movement that occurred. Use the ATR to measure the price movement.
When you see descending volume bars and descending atr line (which indicates volatility) this shows
a dis-interest in traders to invest in this pair creating consolidation which creates the chart pattern.
Trade Mangement after there is a breakout candle close.
1 - Position size (compare volume bar to volume ma line).
a - Breakout candle must be 100% of average volume for a full position size.
b - If 75% of average volume then ½ position size.
2 - Enter two trades.
3 - SL for both trades will be 1.5 x ATR.
4 - 1st trade TP will be 1 x ATR.
5 - No TP on 2nd trade – letting profit run and adjusting SL to follow price.
6 - When 1st TP hit – move 2nd trade SL to breakeven.
7 - Adjust the 2nd trade SL to follow price.
*8 - When breakout candle is more than 1 ATR from breakout candle open.
a - Enter 1st trade at candle close with ½ position size.
b - Enter 2nd trade with a pending limit order that is 1 ATR of breakout candle open.
c – Price should pullback to that pending limit order for 2nd trade.

DOUBLE CHART PATTERNS CONFIRM EURJPY 1D BREAKOUT TRADESTriangles, Ascending Triangle, Descending Triangles and Ranges are repeatable trading chart patterns.
Triangles and ranges are consolidation chart patterns that can breakout either direction.
Ascending and descending chart patterns will have a directional bias depending on the previous incoming trend.
Each chart pattern will have defining trendlines of the support/resistance levels creating the pattern.
What ever time frame you are trading this chart pattern, wait for a candle close outside of the trendline in the direction of the breakout candle. (Our time frame preference is the Daily chart)
Trade Management after there is a breakout candle close
1 - Position size (compare volume bar to volume ma line)
a - Breakout candle must be 100% of average volume for a full position size
b - If 75% of average volume then ½ position size
2 - Enter two trades
3 - SL for both trades will be 1.5 x ATR
4 - 1st trade TP will be 1 x ATR
5 - No TP on 2nd trade – letting profit run and adjusting SL to follow price
6 - When 1st TP hit – move 2nd trade SL to breakeven
7 - Adjust the 2nd trade SL to follow price
*8 - When breakout candle is more than 1 ATR from breakout candle open
a - Enter 1st trade at candle close with ½ position size
b - Enter 2nd trade with a pending limit order that is 1 ATR of breakout candle open
c – Price should pullback to that pending limit order for 2nd trade

LTCUSD 1D RANGE SHORT BREAKOUT TRADEWhile making this post price broke out of range bottom
Range bottom is at 133.20
Daily breakout candle open was at 135.50
Daily ATR is 8.66
1H chart found range levels
Range Trade Rules
Daily candle did not close yet but broke out of range bottom
Breakout candle low was greater than 1 ATR so special entry rules now
Breakout candle open - 1 ATR = Sell Limit Order
135.50 - 8.66 = 126.84 Sell Limit Order which was hit
Further money mgmt of trade in update followup

NZDUSD LongDR. The market has crossed and closed beyond the VIDYA baseline, with my other indicators saying to go long.
First TP 0.66676
Second TP 0.67344
SL 0.65885

UBER TECH ASCENDING TRIANGLE LONG BREAKOUT TRADEUber is in an ascending triangle chart pattern - bullish bias trade
Buy on daily close above 45.00
Use full-size position only if volume
breakout candle is at least average.
Otherwise, use 1/2 size as long as volume
is at least 75% of average.
Find your own SL & TPText
We are doing a live triangle trading class on our TTT Strategy June 25th @ 2PM ET! If you are interested in learning more about it, please visit the link you see below in our signature. Thanks!

React and Profit from Bitcoin’s Upwards Macro TrendMost traders lose most of their capital attempting to time the exact bottoms and tops of what has ultimately shifted into a bull market.
Rather than attempting to predict what the top of a price movement is, why not simplify the process?
No-one wins attempting to time the market. A trader may get lucky once or twice, but, aside from the occasional overleveraged trader that strikes gold or the run-of-the-mill hindsight 20/20 influencer, the market will always win.
React, don’t predict.
The Trading Algorithm from @cryptostanleytrading has been long since February 9th at about $3500 per share of BTC.
Running a Trailing Stop Loss per the @cryptostanleytrading ATR Exit Indicator, and building a long based upon said ATR, would've allowed you to remain in the trade whilst retaining a low entry - allowing for greater amount of leverage with the same amount of initial risk exposure.
Predicting would’ve easily ruffled the typical trader out attempting to secure profits at various TP levels.
Stop prematurely entering or exiting trades. Capturing 80% of a trending movement is ALL you need.

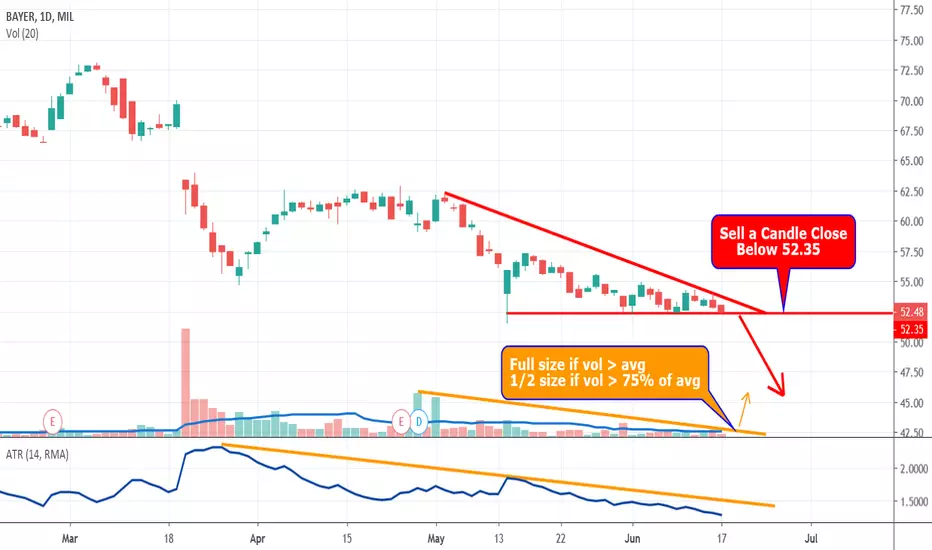
Is Bayer Going To Need Aspirin For Their Roundup Issues?Bayer is a descending Triangle Chart Pattern
Strong support level has been re-tested several times
Continually lower highs puts pressure on this support level
Best patterns have dropping volume and volatility/ATR
Fewer traders are interested in this consolidatation
At some point expect an explosive breakout
Trade Plan
Wait for a close below the support level
Full trade size if volume is at average atr line
1/2 trade size as long as bar has 75% of average volume
Enter two trade
Both trades SL is 1.5xATR
1st trade TP is 1xATR
2nd trade no TP let profit run
When price hits 1st TP move 2nd trade AL to breakeven
Let profit run
If breakout candle is more than 1 ATR wait for price to retrace back towards 1 ATR level to enter
BTCUSD 1D CONTINUATION TRIANGLE BREAKOUT TRADEPrice is in a consolidating continuation triangle pattern
There is a nice bullish trend before this pattern
You see dropping interest in trades by the dropping volume bars
And dropping volatility found in the dropping ATR values
Volume is the amount of $ that went into a particular candle or in Forex the # of trades that took place
Volatility is the amount of price movement that occurred. Use the ATR to measure the price movement
A continuation triangle pattern expects the bullish trend coming into it will continue on the breakout.
But be prepared if price movement decides to retrace with a bearish breakout.
Buy on a daily close above the triangle
Sell on a daily close below the triangle
Trade a full size position if the volume
of the breakout candle is at least equal
to the average volume.
Use 1/2 size position if the volume is at
least 75% of the average volume
If closed candle is more that 1 ATR outside of the pattern, stand aside and wait for price to retrace back to that 1 ATR level to get in.
If you are afraid you might miss it put a limit order at the 1 ATR level and price will trigger it as soon as $ pulls back to that level.
SL is 1.5xATR of breaking bar
TP is 1xATR of breaking bar
At 1st TP close 1/2 of position.
Move SL to break-even
Let remainder of trade run
Watch trade - cryptocurrency trades all weekend

USDJPY 4H TRIANGLE-WEDGE BREAKOUTIt looks like the USDJPY 4H is currently in a Triangle-Wedge.
Lookout for a breakout above and below at the trend lines we labeled.
We are doing a live triangle trading class on our TTT Strategy June 21st @ 2PM ET! If you are interested in learning more about it, please visit the link you see below in our signature. Thanks!

LTCUSD 1D ASCENDING TRIANGLE BULLISH BREAKOUTPrice is in an ascending triangle chart pattern which is a bullish continuation move
What makes up an ascending triangle?
Great resistance level @ 117.00 tested by 8 candles
There are higher lows
Winding up of price created massive pressure on the resistance level to the upside
Reduction of traders interest in chart pattern
Traders interest is indicated by volume and volatility
Volume represents how much dollars traders have placed on a particular instrument at a certain price range
Volatility is represents ed by ATR by how much price has moved around during a certain time period
Volume spikes are falling off
Volume average line is dropping off
Volatility is dropping off y falling ATR line which represents smaller candle bar sizes
Ascending Triangle is a continual bullish chart pattern - trade only long
Trading Plan
Watch for a daily candle close above resistance level of 117.00
Make sure breakout candle has an average or + volume bar
If volume bar is to or above the average line then trade 100% your risk reward ratio (2% of Trade Account)
If volume bar is 75% to average line then trade 50%% of your risk reward ratio (1% of Trade Account)
Take two trades
Both trades SL is 1.5 x ATR of breakout candle
1st trade TP is 1 x ATR of breakout candle
When 1st trade TP is hit, move 2nd trade SL to break even and let profit run
Follow 2nd trade profit with SL

BUY EURUSD H1 Rules:
Wait until the trend candles become green(Heikin Ashi), use the first one as a signal then enter the game @ second one
Use ATR(14)*2 as a SL and ATR(14) for TP
then cross your fingers :)))))))

ETHUSD 1D RANGE TRADESPrice has been in a range
Volume dropping causing consolidation
ATR and Volatility dropping because candle size is smaller
This is a pattern to look for because traders are getting bored with this consolidation pattern so breakout pending
Wait for breakout candle either long or short to close outside range
Wait for volume bar to be at average line to trade 100% full size
or at 75% of average then trade 50% of size
SL 1.5 x ATR

DISNEY 1D IN A CONTINUATION TRIANGLE PATTERNDisney Investment has been fading
Aladdin Live Action Opening Weekend was $100 Million
Disney has a library full of animated films we all have watched
Potential to convert them to live action is great
Increased investment interest may be coming
Price has been consolidating
Continuation Triangle Pattern has be created which has a bullish bias
Volume, ATR & Volatility have been dropping from consolidation
Wait for a candle close on the triangle trendline bullish breakout
Wait for an increased volume bar
Volume bar reaches average atr line then trade 100%
If volume bar only reaches 75% then trade 50%
Open 2 trades
Both SL is 1.5 of ATR of entry candle
1st trade TP is 1xATR of entry candle
2nd trade no TP - when 1st TP hit move this SL to Break Even let profit run
2nd trade - move stop loss to follow trade

WATCH FOR THE SILVER LINING IN THE CHNA-US TRADE WARCNN Business - The World is on a brink of a Trade War
US impose tariffs on $50 Billion worth of Chinese Exports
Chinese quickly outlined new import taxes on US Products worth $3 Billion
Result is a drop in the Dollar Index
Benefit of this is when Dollar drops precious metal pop
Gold broke bullish out of descending wedge but too late to enter
Silver has given us a candle close above this descending channel with increased volume
Traders were bored with this descending channel chart pattern with decreasing volume bars
Decreased ATR from smaller sized candle bars dropped volatility
Trade War news brought bullish momentum to have a breakout candle close above channel trendline
XAGUSD BUY STOP @ 14.77
Enter two orders
Both SL at 1.5xATR
1st Trade TP 1xATR
2nd Trade no TP
When 1st trade hits its TP move 2nd trades SL to breakeven
Follow Price on 2nd trade with SL to let profits run

Continuation trade (5/29/2019)The chart says it all, really. As long as there are no weird Brexit stories, I am confident in this trade.
FX:GBPNZD

BTCUSD 1D IS IN A CONTINUATION TRIANGLE PATTERNFollow the highlights listed on the chart
This is a Bank Holiday weekend
Volume & Volatility are dropping
Candle bar size is shrinking reducing ATR
All of this is causing price to consolidate
Price created a continuation triangle chart pattern which has a bullish bias
Price failed to make a bullish breakout close
Wait for a candle close on a triangle trendline breakout either direction
Watch volume to confirm momentum

GBPAUD (4H) - key positionGBPAUD has retreated from a major breakout north down to a key ATR support level. This creates probability for the north. But caution - for every probability estimate in one direction there is a residual probability in the opposite direction.

GBPAUD BITCOIN SIGNAL INDICATOR STRATEGYBitcoin Signal Indicator shows Entry Signal
Bitcoin Signal Indicator shows SL
Bitcoin Signal Indicator adjusts Trailing SL
Bitcoin Signal Indicator determines TP as a 1 to 2 risk reward ratio

LOOK FOR CRUDE OIL TO TAKE A SLIDEAscending Triangle Trendline breakout
Blue Sup/Res lines found on weekly chart
On Day chart find fib lines and triangle
Price consolidated sideways at Weekly S/R zone and 61.8% fib
Price has curved downward
Wait for price to fall to bottom Trendline
There price will either bounce up once again or breakout bottom trendline
Wait for a candle to close below trendline
Wait for volume bars to increase
Wait for ATR value to increase
Choose your own entry strategy - (poss 15m/30m break-hook-go pattern)
Find your own SL

EUR/USD - Don't fall asleep just yet " No one knows the future" - Nathaniel "THe BiPolar TraDer"
I would like to introduce myself (yet again). I am not going to sit here and pretend I am a self-proclaimed trader. Everyone has there ideas on the market, and I wanted to use TradingView as a platform to hone my skills and one day be managing a hedge fund. If you would like to follow my story as it unfolds you can find out more about the "BIPOLAR TRADER" at my blog below. I am not a forecaster, so don't ask me where price is going. What I define in my analysis is price points where I believe could be turning points or value within a specific market.
thelittlebigmovement.com
Let get started with the Analysis.
EUR/USD could be just as exciting as watching paint dry at the moment. We are in a tight trading range which means the banks will be loading up before pushing this price in their given direction. This market is excellent for intraday traders as the price has not deviated from the VWAP over the last five days. Looking at the overall trend (yellow arrow) for the two months you can see we are in a steady downtrend, clearly visualised by the downward stair pattern of the VWAP. For the reversal traders looking to catch the bottom potentially, there should be some value under the 1.11500 price (Green Value Area). On the other hand, you might be a trend trader looking for a pullback. Catch the price on the past VWAP at 1.12800 (Top White Line) or above (Red Value Area), would provide an excellent risk to reward with more than enough selling pressure as resistance. My personal opinion is this market is going to need another week to show its true colours, so if you are a swing trader, please hold tight. For the intraday traders have fun grabbing those quick wins on either side of the book.
Next update will be this weekend - Thank you for your love and support.
Regards
Nathaniel - "THe BiPolar TraDer"
Little Big Movement

USD/JYP Price Analysis " No one knows the future" - Nathaniel "THe BiPolar TraDer"
As this is my first published price analysis, I would like to introduce myself. I am not going to sit here and pretend I am a self-proclaimed trader. Everyone has there ideas on the market, and I wanted to use TradingView as a platform to home my skills and one day be managing a hedge fund. If you would like to follow my story as it unfolds you can find out more about the "BIPOLAR TRADER" at my blog below. I am not a forecaster, so don't ask me where price is going. What I define in my analysis is price points where I believe could be turning points or value within a specific market.
thelittlebigmovement.com
Let get started with the Analysis
USD/JYP chart uptrend has slowed down, with the market bouncing on either side of the VWAP for the last month. If you are a reversal trader, you have two value points which I would consider decent entries. 112.00 will provide some possible resistance to the upside, but I would be more inclined to take a position at the 113.00 price. For the trend traders, you should sit tight for a little while as the price is currently above the VWAP. If there is a pullback between 111.00 - 110.00 this would be a good area to buy, for a push to the upside. Below 110.00 is downtrend territory and trend traders should look for shorts
Next update will be this weekend - Thank you for the love and support
Regards
Nathaniel - "THe BiPolar TraDer"
Little Big Movement
