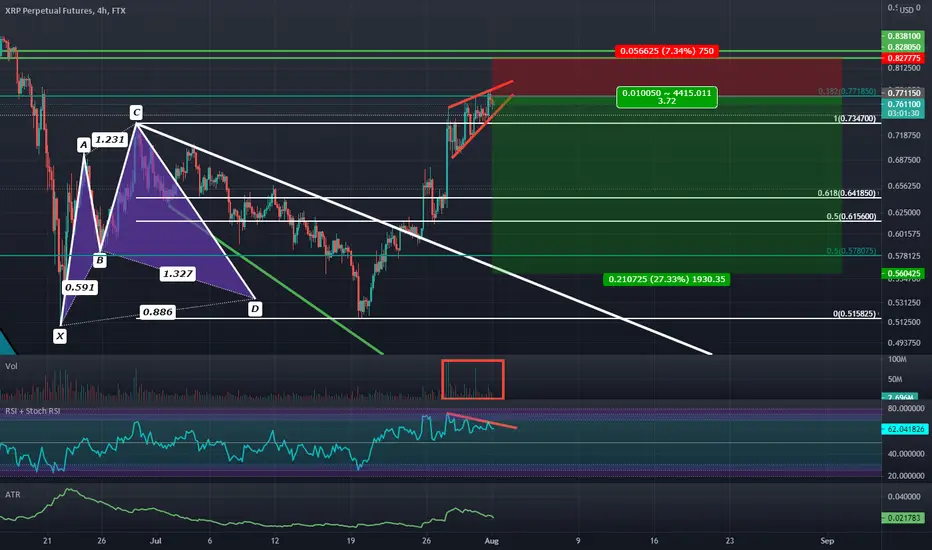
Rising Wedge on 4 hour with Bearish DivergenceToo my surprise XRP actually broke out of it's descending broadening wedge and reached full measure moves; i certainly flipped bearish on this one too soon the first time. But now that we have reached full targets i would expect that any bearish signal we get up here will carry more weight so i will be getting bearish up here again to see if i can catch another big move.
ATR
DJI (4H) - trend switch in sightTrend switches of the ATR on the 1D and 4H usually mean something on most charts. What they mean is a greater probability for price movement under the switch for short positions and above the switch for long positions.
On this chart it does not mean that price cannot rise from under the switch. This is not how ATRs work. ATR's create probabilities. The situation is not predictive. No indicator can predict anything. If that was the case then everybody would just follow indicators and make millions. That's not going to happen.
The snapshot picture is for a trend following setup which can be engaged on a lower time frame e.g. 5 min to 15 min. Note the hefty disclaimer below because trend-following set ups are high risk and very high gain. They are not easy and require significantly large stop-losses.
Price can certainly move significantly north and head for the moon.
Disclaimer: This is not advice or encouragement to trade securities or any asset class. This is not investment advice. Chart positions shown are not suggestions intended to assure you of an advantage. No predictions and no guarantees are supplied or implied. The author trades mostly trend following set ups which has a low win rate of approximately 40%. Heavy losses can be expected if trading live accounts or investing in any asset class. Any previous advantageous performance shown in other scenarios, is not indicative of future performance. If you make decisions based on opinion expressed here or on my profile and you lose your money, kindly sue yourself.

Bullish Bat 30-50% Upside Potential if it plays out.If we can hold the 886 and especially not make a lower low then i expect us to see significant retrace upwards as Crypto continues to remain sideways within it's massive range.


ATR From ScratchHi, traders!
The volatility is one of the most important market indicator that could describe the instrument’s behavior. That’s why it’s deadly impossible to use it to predict the further price movements. But what is volatility? It’s the measure of price changing. The more volatility is, the more you can earn or lose, the price is prone to change. So, dear subscribers today we’ll speak about Average True Range (ATR), one of the most powerful indictors of volatility.
Well, from the very beginning, let’s speak about True Range (TR) and understand how to calculate it. True range is maximum of pairwise absolute difference between high and low, open and close, maximum and minimum.
TR=MAX(|high-low|,|high-close|,|low-close|)
So, it shows us how much the instrument’s price has changed during the one bar. It’s Whereas the Average True Range is Average of TR during some period.
ATR=sum(TRs of period)/length of period
It’s considered to be rather informative, but it’s kinda difficult to make any decisions. For example, is you see on the chart above we have two coins: MAKER and Bitcoin. The definition of ATR of the first is bigger sometimes, but the real volatility (price change) of the second is much higher. Thus, we would advise you to use ATR Normalized, cause you can make it in percentage scale and considering any period you like to make it more representative and smart.
The ATR may be used by market technicians to enter and exit trades, and is a useful tool to add to a trading system. It was created to allow traders to more accurately measure the daily volatility of an asset by using simple calculations. The indicator does not indicate the price direction; rather it is used primarily to measure volatility caused by limit up or down moves. The ATR is fairly simple to calculate and only needs historical price data.
The ATR is commonly used as an exit method that can be applied no matter how the entry decision is made. One popular technique is known as the "chandelier exit". The chandelier exit places a trailing stop under the highest high the stock reached since you entered the trade. The distance between the highest high and the stop level is defined as some multiple times the ATR. 2 For example, we can subtract three times the value of the ATR from the highest high since we entered the trade. Also it can be used as the tool that can help you to choose tokens that suits your strategy.
DISCLAMER: Information is provided only for educational purposes. Do your own study before taking any actions or decisions at the real market.

GBPUSD shorts after price action i am watching gbpusd around 1.39273 to short this pair back into recent lows we have multiple confluences in this zone
1. structure break and retest
2. 0.618 fib confluence
3. atr for today is around this area
if we see clear bearish rejection i will be looking to short this pair

COCA-COLA 1D BEAR FLAGBear Flags are a Range and they are repeatable trading chart patterns.
Bear Flags are ascending chart patterns that will have a directional bias depending on the previous incoming trend.
Each chart pattern will have defining trendlines of the support/resistance levels creating the pattern.
What ever time frame you are trading this chart pattern, wait for a candle close outside of the trendline in the direction of the breakout candle. (Our time frame preference is the Daily chart).
Add volume indicator - Volume is the amount of $ that went into a particular candle or in Forex the # of trades that took place.
Add ATR indicator - Volatility is the amount of price movement that occurred. Use the ATR to measure the price movement.
When you see descending Volume bars and descending ATR line (which indicates volatility) this shows
a dis-interest in traders to invest in this pair creating consolidation which creates the chart pattern.
Trade Management after there is a breakout candle close.
1 - Position size (compare volume bar to volume ma line).
a - Breakout candle must be 100% of volume average for a full position size.
b - If 75% of volume average then ½ position size. (To find 75% of Volume
look at the charts volume settings – divide smaller # into larger # = 75%+)
If not 75% then stand aside from the trade.
2 – If candle breaks out of a trendline, 15m before the close of the day prepare your buy/sell order.
Enter two trades. 1st trade will have a SL & TP. It will close automatically when the 1st TP is hit. 2nd
trade only has a SL and will be allowed to run. When 1st TP is hit move the SL to breakeven. Look
at ATR and prepare SL at 1.5 of ATR. Prepare 1st trade TP at 1 of ATR.
3 - SL for both trades will be 1.5 x ATR.
4 - 1st trade TP will be 1 x ATR.
5 - No TP on 2nd trade – letting profit run and adjusting SL to follow price.
6 - When 1st TP hit – move 2nd trade SL to breakeven.
7 - Adjust the 2nd trade SL to follow price.
*8 – After Breakout candle – if price closes back into chart pattern close trade don't wait for SL to be hit.
*9 - When breakout candle is more than 1 ATR from breakout candle open.
a - Enter 1st trade at candle close with ½ position size.
b - Enter 2nd trade with a pending limit order that is 1 ATR of breakout candle open.
c – Price should pullback to that pending limit order for 2nd trade.
d – If Price returns back into chart pattern close trade before SL is hit.

NZDCHF 1D BULL FLAGBull Flags are a Range and they are repeatable trading chart patterns.
Bull Flags are a descending chart pattern that will have a directional bias (long) depending on the previous incoming trend.
Each chart pattern will have defining trendlines of the support/resistance levels creating the pattern.
What ever time frame you are trading this chart pattern, wait for a candle close outside of the trendline in the direction of the breakout candle. (Our time frame preference is the Daily chart).
Add volume indicator - Volume is the amount of $ that went into a particular candle or in Forex the # of trades that took place.
Add ATR indicator - Volatility is the amount of price movement that occurred. Use the ATR to measure the price movement.
When you see descending Volume bars and descending ATR line (which indicates volatility) this shows
a dis-interest in traders to invest in this pair creating consolidation which creates the chart pattern.
Trade Management after there is a breakout candle close.
1 - Position size (compare volume bar to volume ma line).
a - Breakout candle must be 100% of volume average for a full position size.
b - If 75% of volume average then ½ position size. (To find 75% of Volume
look at the charts volume settings – divide smaller # into larger # = 75%+)
If not 75% then stand aside from the trade.
2 – If candle breaks out of a trendline, 15m before the close of the day prepare your buy/sell order.
Enter two trades. 1st trade will have a SL & TP. It will close automatically when the 1st TP is hit. 2nd
trade only has a SL and will be allowed to run. When 1st TP is hit move the SL to breakeven. Look
at ATR and prepare SL at 1.5 of ATR. Prepare 1st trade TP at 1 of ATR.
3 - SL for both trades will be 1.5 x ATR.
4 - 1st trade TP will be 1 x ATR.
5 - No TP on 2nd trade – letting profit run and adjusting SL to follow price.
6 - When 1st TP hit – move 2nd trade SL to breakeven.
7 - Adjust the 2nd trade SL to follow price.
*8 – After Breakout candle – if price closes back into chart pattern close trade don't wait for SL to be hit.
*9 - When breakout candle is more than 1 ATR from breakout candle open.
a - Enter 1st trade at candle close with ½ position size.
b - Enter 2nd trade with a pending limit order that is 1 ATR of breakout candle open.
c – Price should pullback to that pending limit order for 2nd trade.
d – If Price returns back into chart pattern close trade before SL is hit.

ETSY (DAILY TIME FRAME) GENERAL ANALYSISDespite ETSY reporting earnings that surpassed analysts expectations ETSY shares still slid as management expects the total sale of goods on its platform to slow in the second quarter as it faces tough comparisons to last year’s pandemic-boosted results.
Based on the current price action I'm operating under the assumption that ETSY is in a downtrend. The gap down is a red flag of the weakness on the buy side of ETSY. I would stay away from any immediate rallies up until the price exceeds $192 or closes above the mean. After the price gap down this does look like an opportunity to buy but I would caution against blindly buying the dip as ETSY can shed a lot of dollars should it break its support of $153.50
(Conduct your own due diligence, or consult a licensed financial advisor or broker before making any and all investment decisions. Any investments, trades, speculations, or decisions made on the basis of any information found on this site, expressed or implied herein, are committed at your own risk, financial or otherwise.)

UBER (DAILY TIME FRAME) GENERAL ANALYSISUBER beat its earnings estimates however, it missed on its first quarter revenues. As a result, UBER gapped down after its earnings report and in my view is currently on a downtrend and I would operate under that assumption until it fills that gap. Conservatively speaking I'm looking for a gap filled price that closes with a daily price of about $53.
Based on everything I'm seeing I would look to short UBER when it provides some form of mean reversion at -2ATR or a more favorable -1ATR.
Looking at potential Buy opportunities I would look to the weekly time frame and I would look to start scaling in my position at -2ATR with a price of around $42.50-$41.75.
(Conduct your own due diligence, or consult a licensed financial advisor or broker before making any and all investment decisions. Any investments, trades, speculations, or decisions made on the basis of any information found on this site, expressed or implied herein, are committed at your own risk, financial or otherwise.)


RCL 1D BULL FLAGBull Flags are a Range that is a repeatable trading chart pattern.
Bull Flags are a descending range chart patterns that will have a directional bias (Long) depending on the previous incoming trend.
Each chart pattern will have defining trendlines of the support/resistance levels creating the pattern.
What ever time frame you are trading this chart pattern, wait for a candle close outside of the trendline in the direction of the breakout candle. (Our time frame preference is the Daily chart).
Add volume indicator - Volume is the amount of $ that went into a particular candle or in Forex the # of trades that took place.
Add ATR indicator - Volatility is the amount of price movement that occurred. Use the ATR to measure the price movement.
When you see descending Volume bars and descending ATR line (which indicates volatility) this shows
a dis-interest in traders to invest in this pair creating consolidation which creates the chart pattern.
Trade Management after there is a breakout candle close.
1 - Position size (compare volume bar to volume ma line).
a - Breakout candle must be 100% of volume average for a full position size.
b - If 75% of volume average then ½ position size. (To find 75% of Volume
look at the charts volume settings – divide smaller # into larger # = 75%+)
If not 75% then stand aside from the trade.
2 – If candle breaks out of a trendline, 15m before the close of the day prepare your buy/sell order.
Enter two trades. 1st trade will have a SL & TP. It will close automatically when the 1st TP is hit. 2nd
trade only has a SL and will be allowed to run. When 1st TP is hit move the SL to breakeven. Look
at ATR and prepare SL at 1.5 of ATR. Prepare 1st trade TP at 1 of ATR.
3 - SL for both trades will be 1.5 x ATR.
4 - 1st trade TP will be 1 x ATR.
5 - No TP on 2nd trade – letting profit run and adjusting SL to follow price.
6 - When 1st TP hit – move 2nd trade SL to breakeven.
7 - Adjust the 2nd trade SL to follow price.
*8 – After Breakout candle – if price closes back into chart pattern close trade don't wait for SL to be hit.
*9 - When breakout candle is more than 1 ATR from breakout candle open.
a - Enter 1st trade at candle close with ½ position size.
b - Enter 2nd trade with a pending limit order that is 1 ATR of breakout candle open.
c – Price should pullback to that pending limit order for 2nd trade.
d – If Price returns back into chart pattern close trade before SL is hit.

NZDJPY 1D ASCENDING TRIANGLEAscending Triangle are repeatable trading chart patterns.
Ascending chart patterns will have a directional bias depending on the previous incoming trend.
Each chart pattern will have defining trendlines of the support/resistance levels creating the pattern.
What ever time frame you are trading this chart pattern, wait for a candle close outside of the trendline in the direction of the breakout candle. (Our time frame preference is the Daily chart).
Add volume indicator - Volume is the amount of $ that went into a particular candle or in Forex the # of trades that took place.
Add ATR indicator - Volatility is the amount of price movement that occurred. Use the ATR to measure the price movement.
When you see descending Volume bars and descending ATR line (which indicates volatility) this shows
a dis-interest in traders to invest in this pair creating consolidation which creates the chart pattern.
Trade Management after there is a breakout candle close.
1 - Position size (compare volume bar to volume ma line).
a - Breakout candle must be 100% of volume average for a full position size.
b - If 75% of volume average then ½ position size. (To find 75% of Volume
look at the charts volume settings – divide smaller # into larger # = 75%+)
If not 75% then stand aside from the trade.
2 – If candle breaks out of a trendline, 15m before the close of the day prepare your buy/sell order.
Enter two trades. 1st trade will have a SL & TP. It will close automatically when the 1st TP is hit. 2nd
trade only has a SL and will be allowed to run. When 1st TP is hit move the SL to breakeven. Look
at ATR and prepare SL at 1.5 of ATR. Prepare 1st trade TP at 1 of ATR.
3 - SL for both trades will be 1.5 x ATR.
4 - 1st trade TP will be 1 x ATR.
5 - No TP on 2nd trade – letting profit run and adjusting SL to follow price.
6 - When 1st TP hit – move 2nd trade SL to breakeven.
7 - Adjust the 2nd trade SL to follow price.
*8 – After Breakout candle – if price closes back into chart pattern close trade don't wait for SL to be hit.
*9 - When breakout candle is more than 1 ATR from breakout candle open.
a - Enter 1st trade at candle close with ½ position size.
b - Enter 2nd trade with a pending limit order that is 1 ATR of breakout candle open.
c – Price should pullback to that pending limit order for 2nd trade.
d – If Price returns back into chart pattern close trade before SL is hit.

Eur/Gbp Long IdeaMy reason behind entering this pair is due to the fact that at the moment we are climbing up in a bullish trend on the daily timeframe, which gives me the indication that longs will only be valid in any trade situation. Once I scoped into current price action on the daily i spotted a shooting star, which in my opinion would be perfect for an entry at the wick high. 4hr looked even better for me, showing previous support now acting as new resistance clearly highlighted on my chart with the box . For my confluence i noticed we left a slight imbalance close to my entry, along with a daily TF Ema just above the entry. On the 4h for my Stoplioss, it placed just below a Hl, as a break past this level would cause the trade to be no longer valid, but the ATR gives me further confluence it won't over entered to that. Take profit just at the zone of resistance.

WBA 1D BEAR FLAGBear Flags are a Range pattern that is a repeatable trading chart patterns.
Ascending Bear Flag chart patterns will have a directional bias (short) depending on the previous incoming trend.
Each chart pattern will have defining trendlines of the support/resistance levels creating the pattern.
What ever time frame you are trading this chart pattern, wait for a candle close outside of the trendline in the direction of the breakout candle. (Our time frame preference is the Daily chart).
Add volume indicator - Volume is the amount of $ that went into a particular candle or in Forex the # of trades that took place.
Add ATR indicator - Volatility is the amount of price movement that occurred. Use the ATR to measure the price movement.
When you see descending Volume bars and descending ATR line (which indicates volatility) this shows
a dis-interest in traders to invest in this pair creating consolidation which creates the chart pattern.
Trade Management after there is a breakout candle close.
1 - Position size (compare volume bar to volume ma line).
a - Breakout candle must be 100% of volume average for a full position size.
b - If 75% of volume average then ½ position size. (To find 75% of Volume
look at the charts volume settings – divide smaller # into larger # = 75%+)
If not 75% then stand aside from the trade.
2 – If candle breaks out of a trendline, 15m before the close of the day prepare your buy/sell order.
Enter two trades. 1st trade will have a SL & TP. It will close automatically when the 1st TP is hit. 2nd
trade only has a SL and will be allowed to run. When 1st TP is hit move the SL to breakeven. Look
at ATR and prepare SL at 1.5 of ATR. Prepare 1st trade TP at 1 of ATR.
3 - SL for both trades will be 1.5 x ATR.
4 - 1st trade TP will be 1 x ATR.
5 - No TP on 2nd trade – letting profit run and adjusting SL to follow price.
6 - When 1st TP hit – move 2nd trade SL to breakeven.
7 - Adjust the 2nd trade SL to follow price.
*8 – After Breakout candle – if price closes back into chart pattern close trade don't wait for SL to be hit.
*9 - When breakout candle is more than 1 ATR from breakout candle open.
a - Enter 1st trade at candle close with ½ position size.
b - Enter 2nd trade with a pending limit order that is 1 ATR of breakout candle open.
c – Price should pullback to that pending limit order for 2nd trade.
d – If Price returns back into chart pattern close trade before SL is hit.

EURCHF 1D BULL FLAGBull Flags are a Range pattern and they are repeatable trading chart patterns.
Descending Bull Flag chart patterns will have a directional bias (Long Bias) depending on the previous incoming trend.
Each chart pattern will have defining trendlines of the support/resistance levels creating the pattern.
What ever time frame you are trading this chart pattern, wait for a candle close outside of the trendline in the direction of the breakout candle. (Our time frame preference is the Daily chart).
Add volume indicator - Volume is the amount of $ that went into a particular candle or in Forex the # of trades that took place.
Add ATR indicator - Volatility is the amount of price movement that occurred. Use the ATR to measure the price movement.
When you see descending Volume bars and descending ATR line (which indicates volatility) this shows
a dis-interest in traders to invest in this pair creating consolidation which creates the chart pattern.
Trade Management after there is a breakout candle close.
1 - Position size (compare volume bar to volume ma line).
a - Breakout candle must be 100% of volume average for a full position size.
b - If 75% of volume average then ½ position size. (To find 75% of Volume
look at the charts volume settings – divide smaller # into larger # = 75%+)
If not 75% then stand aside from the trade.
2 – If candle breaks out of a trendline, 15m before the close of the day prepare your buy/sell order.
Enter two trades. 1st trade will have a SL & TP. It will close automatically when the 1st TP is hit. 2nd
trade only has a SL and will be allowed to run. When 1st TP is hit move the SL to breakeven. Look
at ATR and prepare SL at 1.5 of ATR. Prepare 1st trade TP at 1 of ATR.
3 - SL for both trades will be 1.5 x ATR.
4 - 1st trade TP will be 1 x ATR.
5 - No TP on 2nd trade – letting profit run and adjusting SL to follow price.
6 - When 1st TP hit – move 2nd trade SL to breakeven.
7 - Adjust the 2nd trade SL to follow price.
*8 – After Breakout candle – if price closes back into chart pattern close trade don't wait for SL to be hit.
*9 - When breakout candle is more than 1 ATR from breakout candle open.
a - Enter 1st trade at candle close with ½ position size.
b - Enter 2nd trade with a pending limit order that is 1 ATR of breakout candle open.
c – Price should pullback to that pending limit order for 2nd trade.
d – If Price returns back into chart pattern close trade before SL is hit.

Short idea on GU after break of hourly structureYesterdays candle closed as a very promoting SS (shooting star), this was seen after a convincing move higher towards a slight daily level. This SS gives me confidence that price will reverse and go down to the untested level on the daily (5th April). We can see that if price comes back to the level now without a move lower we will have 61.8Fib confluence (very strong confluence). We will also have out 50EMA hovering around that area. We have out stop just above the high of the impulsive move down. Nobig news to come out today on either currency so we don't have to worry about watching out for that.
If we get in I will close out at 4PM as it is Friday and I don't hold over the weekend.

USDCHF long usd chf is currently testing an inflection point that has fib confluence this could be a potential buying opportunity after price action plays out

EURAUD BEAR FLAGBear Flags are a Ranges pattern and they are repeatable trading chart patterns.
Ascending Bear Flags are chart patterns that will have a directional bias (BearishShort) depending on the previous incoming trend.
Each chart pattern will have defining trendlines of the support/resistance levels creating the pattern.
What ever time frame you are trading this chart pattern, wait for a candle close outside of the trendline in the direction of the breakout candle. (Our time frame preference is the Daily chart).
Add volume indicator - Volume is the amount of $ that went into a particular candle or in Forex the # of trades that took place.
Add ATR indicator - Volatility is the amount of price movement that occurred. Use the ATR to measure the price movement.
When you see descending Volume bars and descending ATR line (which indicates volatility) this shows
a dis-interest in traders to invest in this pair creating consolidation which creates the chart pattern.
Trade Management after there is a breakout candle close.
1 - Position size (compare volume bar to volume ma line).
a - Breakout candle must be 100% of volume average for a full position size.
b - If 75% of volume average then ½ position size. (To find 75% of Volume
look at the charts volume settings – divide smaller # into larger # = 75%+)
If not 75% then stand aside from the trade.
2 – If candle breaks out of a trendline, 15m before the close of the day prepare your buy/sell order.
Enter two trades. 1st trade will have a SL & TP. It will close automatically when the 1st TP is hit. 2nd
trade only has a SL and will be allowed to run. When 1st TP is hit move the SL to breakeven. Look
at ATR and prepare SL at 1.5 of ATR. Prepare 1st trade TP at 1 of ATR.
3 - SL for both trades will be 1.5 x ATR.
4 - 1st trade TP will be 1 x ATR.
5 - No TP on 2nd trade – letting profit run and adjusting SL to follow price.
6 - When 1st TP hit – move 2nd trade SL to breakeven.
7 - Adjust the 2nd trade SL to follow price.
*8 – After Breakout candle – if price closes back into chart pattern close trade don't wait for SL to be hit.
*9 - When breakout candle is more than 1 ATR from breakout candle open.
a - Enter 1st trade at candle close with ½ position size.
b - Enter 2nd trade with a pending limit order that is 1 ATR of breakout candle open.
c – Price should pullback to that pending limit order for 2nd trade.
d – If Price returns back into chart pattern close trade before SL is hit.

Bill.com Range TradingRanges are repeatable trading chart patterns.
Ranges are consolidation chart patterns that can breakout either direction.
Each chart pattern will have defining trendlines of the support/resistance levels creating the pattern.
What ever time frame you are trading this chart pattern, wait for a candle close outside of the trendline in the direction of the breakout candle. (Our time frame preference is the Daily chart).
Add volume indicator - Volume is the amount of $ that went into a particular candle or in Forex the # of trades that took place.
Add ATR indicator - Volatility is the amount of price movement that occurred. Use the ATR to measure the price movement.
When you see descending Volume bars and descending ATR line (which indicates volatility) this shows
a dis-interest in traders to invest in this pair creating consolidation which creates the chart pattern.
Trade Management after there is a breakout candle close.
1 - Position size (compare volume bar to volume ma line).
a - Breakout candle must be 100% of volume average for a full position size.
b - If 75% of volume average then ½ position size. (To find 75% of Volume
look at the charts volume settings – divide smaller # into larger # = 75%+)
If not 75% then stand aside from the trade.
2 – If candle breaks out of a trendline, 15m before the close of the day prepare your buy/sell order.
Enter two trades. 1st trade will have a SL & TP. It will close automatically when the 1st TP is hit. 2nd
trade only has a SL and will be allowed to run. When 1st TP is hit move the SL to breakeven. Look
at ATR and prepare SL at 1.5 of ATR. Prepare 1st trade TP at 1 of ATR.
3 - SL for both trades will be 1.5 x ATR.
4 - 1st trade TP will be 1 x ATR.
5 - No TP on 2nd trade – letting profit run and adjusting SL to follow price.
6 - When 1st TP hit – move 2nd trade SL to breakeven.
7 - Adjust the 2nd trade SL to follow price.
*8 – After Breakout candle – if price closes back into chart pattern close trade don't wait for SL to be hit.
*9 - When breakout candle is more than 1 ATR from breakout candle open.
a - Enter 1st trade at candle close with ½ position size.
b - Enter 2nd trade with a pending limit order that is 1 ATR of breakout candle open.
c – Price should pullback to that pending limit order for 2nd trade.
d – If Price returns back into chart pattern close trade before SL is hit.

GBPJPY SHORTSGBPJPY has broke its counter trend and has also broke out a S/R lvl @ 150.318 i am simply looking for a retest of the underside of this lvl and if price action looks clear ( hammer candles, shooting starts , engulfings etc) i will be looking to short this into recent lows aiming for 149.386
confluences for this trade
1. trend break with acceptance below
2. 0.618 fib sitting on our lvl of structure
3. atr for today is also in the zone we are looking to short
this is not a limit order i will be waiting for price action.

eurgbp outlook for today/ next week on this pair you can see we are sitting on a lvl of structure @ 0.86725 however we are not making any progression away form it, this to me creates a liquidity pool below market because the more time price rejects the more people are inclined to buy this lvl as its deemed "strong" , this end up with lots of stops below a "strong" lvl.
now as we know the market is gravitated towards liquidity so in my opinion there is a high probability the market is going to drop below taking any stops out and making sell side liquidity (when you have a buy order in the market and your stop loss is hit you are selling back into the market at a disadvantageous price and you pay the cost of the difference)
now back to the trade idea haha, I am looking to get a break below structure and a retest to go short alongside liquidity, we also have an untested lvl with fib and ema and atr confluence below market @ 0.86427 I will be looking to buy this lvl after I close my short out
