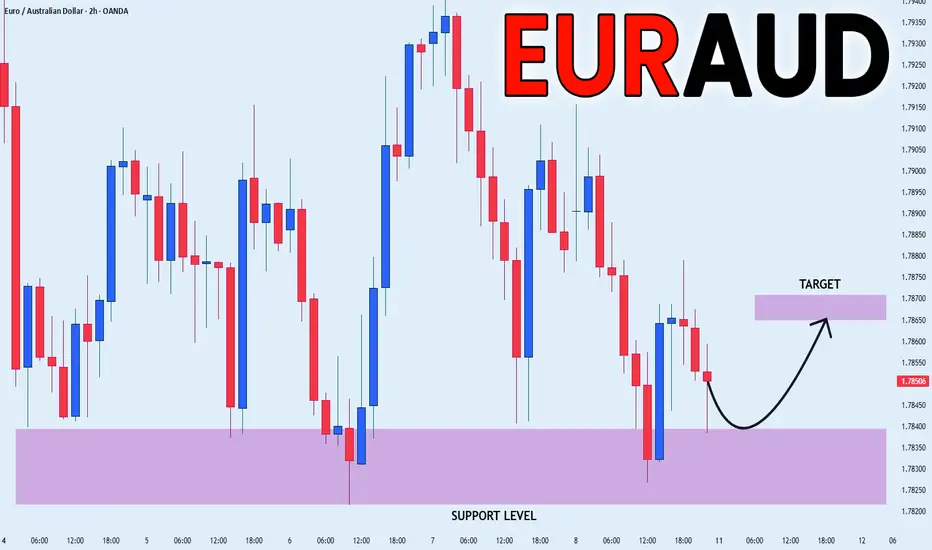
EUR_AUD LOCAL LONG|
✅EUR_AUD is going down now
But a strong support level is ahead at 1.7820
Thus I am expecting a rebound
And a move up towards the target of 1.7865
LONG🚀
✅Like and subscribe to never miss a new idea!✅
AUD (Australian Dollar)
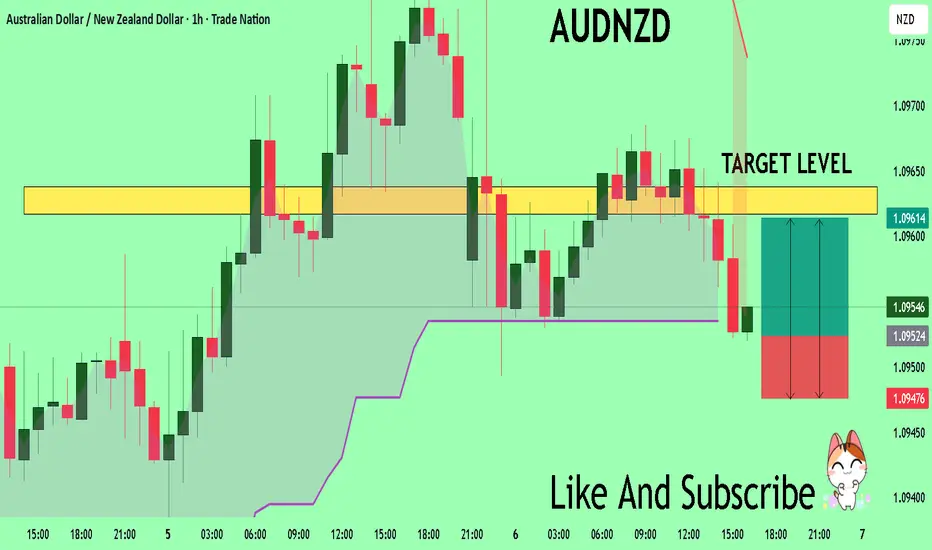
AUDNZD Trading Opportunity! SELL!
My dear friends,
Please, find my technical outlook for AUDNZD below:
The instrument tests an important psychological level 1.0961
Bias - Bearish
Technical Indicators: Supper Trend gives a precise Bearish signal, while Pivot Point HL predicts price changes and potential reversals in the market.
Target - 1.0951
Recommended Stop Loss - 1.0967
About Used Indicators:
Super-trend indicator is more useful in trending markets where there are clear uptrends and downtrends in price.
Disclosure: I am part of Trade Nation's Influencer program and receive a monthly fee for using their TradingView charts in my analysis.
———————————
WISH YOU ALL LUCK

GBPAUD Reverses from Key Zone – Long Setup in Play!Today I want to share with you a Long position on GBPAUD ( OANDA:GBPAUD ).
GBPAUD started to rise well from the Important Support line , Support zone(2.032 AUD-1.987 AUD) , and Potential Reversal Zone(PRZ) and managed to close the 4-hour candle above 2.053 AUD (important) .
In terms of Elliott wave theory , GBPAUD seems to have completed the main wave 4 . The main wave 4 structure was a Double Three Correction(WXY) .
Also, along the way, we can see a Bullish Marubozu candle , which could indicate a continuation of the uptrend .
I expect GBPAUD to break the Resistance lines soon and attack the Resistance zone(2.078 AUD-2.066 AUD) .
First Target: 2.065 AUD
Second Target: 2.076 AUD
Note: Stop Loss(SL): 2.040 =Worst SL
Please respect each other's ideas and express them politely if you agree or disagree.
British Pound/ Australian Dollar Analyze (GBPAUD), 4-hour time frame.
Be sure to follow the updated ideas.
Do not forget to put a Stop loss for your positions (For every position you want to open).
Please follow your strategy and updates; this is just my Idea, and I will gladly see your ideas in this post.
Please do not forget the ✅' like '✅ button 🙏😊 & Share it with your friends; thanks, and Trade safe.

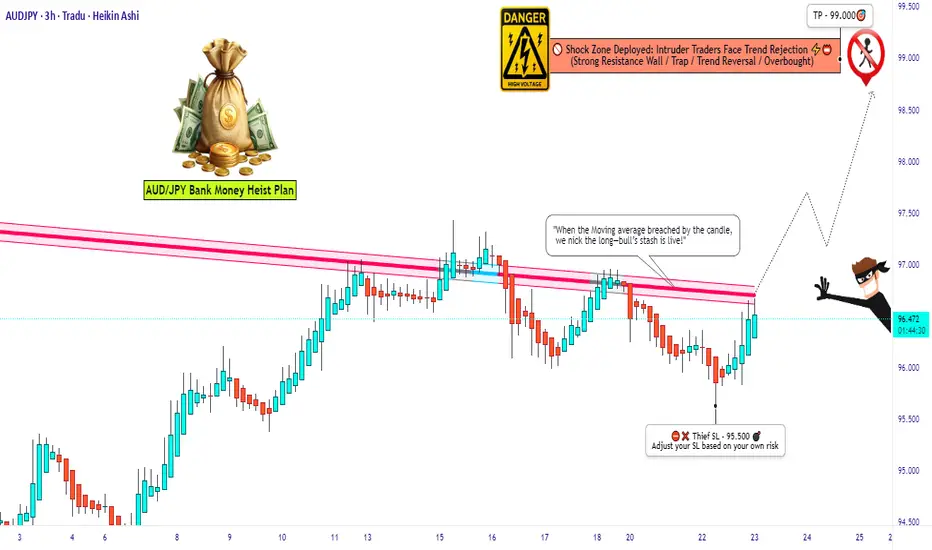
Aussie vs Yen: Setup for a Clean Long Robbery💣AUD/JPY Forex Heist: Aussie vs Yen 🔥Master Robbery Plan Unfolded!
🌟Hi! Hola! Ola! Bonjour! Hallo! Marhaba!🌟
Dear Money Makers, Bandits & Chart Pirates 🤑💰💸✈️
It's time to reload your gear and lock in the blueprint. Based on our 🔥Thief Trader Technical + Fundamental Intelligence🔥, we’re all set to ambush the AUD/JPY "Aussie vs Yen" battlefield. This ain’t no casual walk—it’s a full-scale market operation targeting the High Voltage Reversal Trap Zone⚡. The pressure is real: Overbought, Tricky Consolidation, and Bears camping at resistance. Your job? Steal profits before they smell the breakout! 🏆💪💵
🎯 Entry Point — "Let the Heist Begin"
🗝 Entry Level: Wait for the Breakout @ 94.500. When price shatters the Moving Average ceiling—that's your greenlight!
🚀 Execution Choices:
Place Buy Stop above the breakout point
Or, use Buy Limit Orders near recent swing highs/lows on the 15/30-min chart using Layering/DCA tactics (that’s how the real thieves sneak in 🕶️).
🔔 Set an alert to stay sharp—don’t miss the vault crackin’ open!
🛑 Stop Loss — “Cover Your Escape”
🎯 SL Level: Just under the recent swing low on the 3H timeframe (around 95.500)
🚫 Never place the SL before the breakout confirms! Let the move prove itself first.
🧠 SL sizing depends on your capital, lot size, and number of entries stacked. You control the risk, not the other way around!
🎯 Target — "Cash Out or Vanish"
💎 First Take-Profit: 99.000
🚪Optional Escape: Secure the bag early if momentum fades. Better leave rich than be late!
👀 For Scalpers & Swing Robbers Alike
🔍 Scalpers: Only ride the Long wave.
💼 Big pockets? Hit straight entry.
👟 Small capital? Tag in with swing trades and trail that SL like a pro.
🎣 Use a Trailing SL to lock profits as price sprints toward resistance.
📰 The Bigger Picture: Why AUD/JPY?
The pair is pumped by:
📈 Macro Economics
📊 Quant Analysis
📰 COT Reports
📉 Intermarket Correlations
🧠 Sentiment Heatmaps
🔥 Future Price Dynamics
Don’t pull the trigger blind. Read the battlefield before charging in.
⚠️ Thief’s Caution Zone: News Traps Ahead
🛎 News = chaos.
📌 Avoid entering fresh trades during major data drops.
🔐 Use Trailing SLs to protect ongoing plays.
📉 Let the market dance, but you control the music.
💥Hit the Boost Button!💥
If this heist plan pumps your portfolio, smash that boost. That’s how we fund more blueprints, fuel the Thief Gang’s vault, and keep the robbery cycle alive.
🤑💵 Together, let’s rob this market clean—Thief Style.
New plan drops soon. Stay locked. Stay sharp. Stay profitable.
🧠💰🏴☠️
— Thief Trader Out 🐱👤🔓🚀
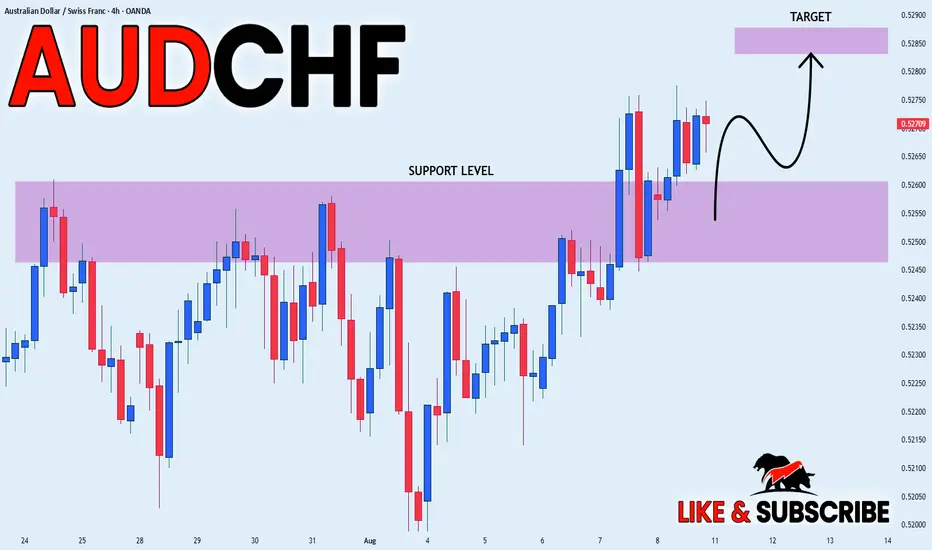
AUD_CHF WILL KEEP GROWING|LONG|
✅AUD_CHF is trading in an uptrend
And the pair was making a bearish correction
But has now retested the support of 0.5255
And we are already seeing a rebound
So we will be expecting a further move up
LONG🚀
✅Like and subscribe to never miss a new idea!✅
EUR-AUD Rebound Ahead! Buy!
Hello,Traders!
EUR-AUD is already making
A rebound from the horizontal
Support level of 1.7822
So we are locally bullish
Biased and we will be
Expecting a further
Local move up
Buy!
Comment and subscribe to help us grow!
Check out other forecasts below too!
Disclosure: I am part of Trade Nation's Influencer program and receive a monthly fee for using their TradingView charts in my analysis.

EURAUD Is Bullish! Buy!
Please, check our technical outlook for EURAUD.
Time Frame: 15m
Current Trend: Bullish
Sentiment: Oversold (based on 7-period RSI)
Forecast: Bullish
The market is trading around a solid horizontal structure 1.785.
The above observations make me that the market will inevitably achieve 1.787 level.
P.S
We determine oversold/overbought condition with RSI indicator.
When it drops below 30 - the market is considered to be oversold.
When it bounces above 70 - the market is considered to be overbought.
Disclosure: I am part of Trade Nation's Influencer program and receive a monthly fee for using their TradingView charts in my analysis.
Like and subscribe and comment my ideas if you enjoy them!

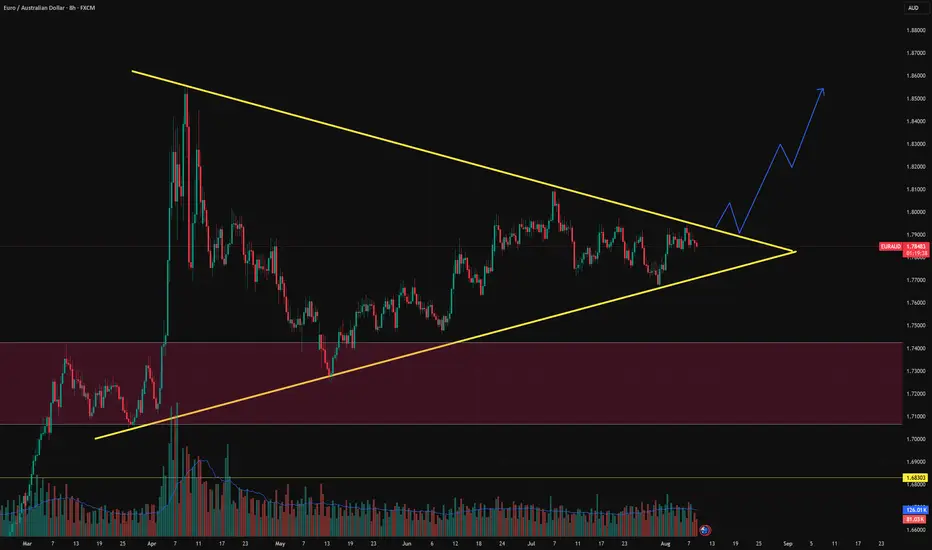
EUR/AUD Analysis – Symmetrical Triangle FormationKey Observations:
Pattern Type: Symmetrical triangle with converging trendlines.
Higher lows show demand stepping in.
Lower highs signal sellers defending resistance.
Volume Profile: Volume is tapering off, aligning with triangle logic → explosive move likely upon breakout.
Liquidity Pool Below: Large liquidity zone marked around 1.68300–1.74000, previously acted as accumulation base and demand zone.
Price Behavior: Currently nearing apex; compression suggests volatility expansion imminent.
AUDJPY SELLAUDJPY SELL
trend Line is brake.
lower lower is accepted.
I think this is good for today may be it will be profitable for next week.
have a good weeked.

AUDJPY SELL SETUP SHOOOOOOOOOOOOOORTTHE Price now on resistance level
and it shaped head and shoulder on time frame 2H and take inducement so i expect shoort

AUDNZD Trading Opportunity! BUY!
My dear subscribers,
This is my opinion on the AUDNZD next move:
The instrument tests an important psychological level 1.0952
Bias - Bullish
Technical Indicators: Supper Trend gives a precise Bullish signal, while Pivot Point HL predicts price changes and potential reversals in the market.
Target - 1.0961
My Stop Loss - 1.0947
About Used Indicators:
On the subsequent day, trading above the pivot point is thought to indicate ongoing bullish sentiment, while trading below the pivot point indicates bearish sentiment.
Disclosure: I am part of Trade Nation's Influencer program and receive a monthly fee for using their TradingView charts in my analysis.
———————————
WISH YOU ALL LUCK
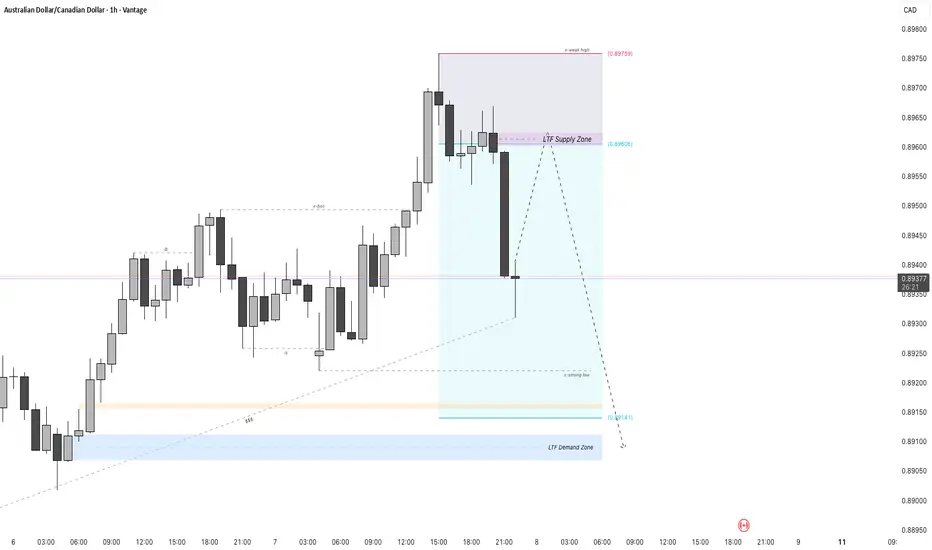
AUDCAD - 1H Chart Using Smart Money ConceptsThis trading plan follows the Smart Money Concept (SMC) methodology, emphasizing institutional price behavior to anticipate potential market moves.
Market Context:
The price recently experienced a strong bearish move from a Higher Time Frame (HTF) Supply Zone around 0.8960, leading to a sharp decline. The current price is at a potential support area near a previous Order Block located around 0.8940.
Major Zones:
LTF Supply Zone (0.8960 region): This is a significant resistance area where institutional sellers previously entered, causing the strong downward move. A retest of this zone could provide a high-probability short setup if price rallies back here.
LTF Demand Zone (around 0.8914): This is a strong support area indicated by the chart that may act as a buyer accumulation zone.
Price Action & Structure:
The chart shows key Smart Money Concept structures including:
Order Blocks (OB): Areas where institutions likely placed orders before strong price moves.
Break of Structure (BOS): Recent bearish structure break confirms a shift in momentum downward.
Trading Bias and Plan:
The plan considers a bearish continuation bias after a potential retracement.
Traders should watch for price to retrace up towards the LTF Supply Zone (the identified resistance zone) before entering short positions. This retracement offers an opportunity to enter with better risk to reward near institutional selling areas.
Confirmation signals like rejection candles or liquidity tests at the supply zone enhance the setup validity.
If the supply zone fails to hold and price breaks higher, the scenario invalidates and traders should reassess.
Targets and Risk Management:
Initial targets can be set near the LTF Demand Zone and further below near strong lows identified on the chart.
Protective stop losses should be placed above the supply zone or above recent swing highs to minimize risk from false breakouts.
AUDCAD; Heikin Ashi Trade IdeaIn this video, I’ll be sharing my analysis of AUDCAD, using FXAN's proprietary algo indicators with my unique Heikin Ashi strategy. I’ll walk you through the reasoning behind my trade setup and highlight key areas where I’m anticipating potential opportunities.
I’m always happy to receive any feedback.
Like, share and comment! ❤️
Thank you for watching my videos! 🙏

AUDJPY Key tarding level retest at 96.00Key Support and Resistance Levels
Resistance Level 1: 97.527
Resistance Level 2: 98.091
Resistance Level 3: 99.00
Support Level 1: 96.00
Support Level 2: 95.574
Support Level 3: 95.060
This communication is for informational purposes only and should not be viewed as any form of recommendation as to a particular course of action or as investment advice. It is not intended as an offer or solicitation for the purchase or sale of any financial instrument or as an official confirmation of any transaction. Opinions, estimates and assumptions expressed herein are made as of the date of this communication and are subject to change without notice. This communication has been prepared based upon information, including market prices, data and other information, believed to be reliable; however, Trade Nation does not warrant its completeness or accuracy. All market prices and market data contained in or attached to this communication are indicative and subject to change without notice.

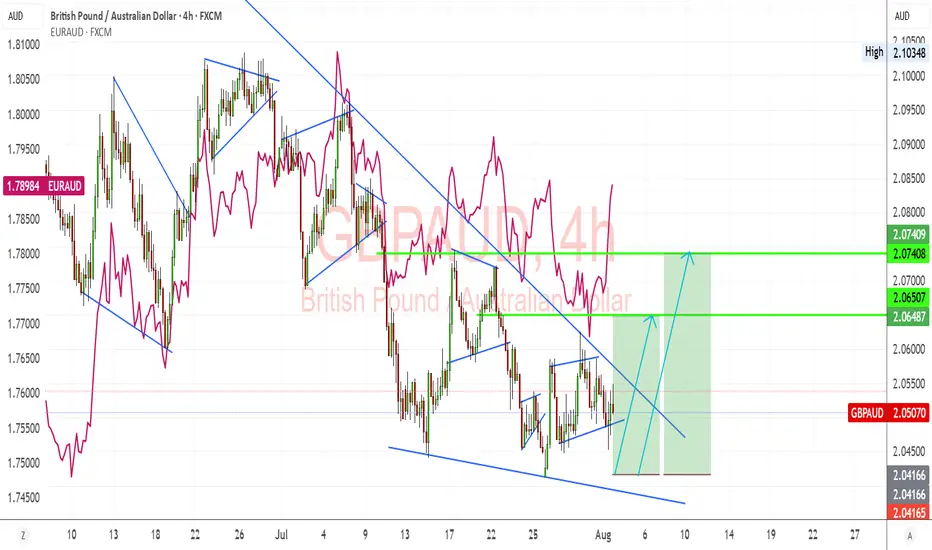
GBPAUD Potential Bullish Reversal Setup – Key Breakout Levels GBPAUD is showing signs of a potential bullish reversal after a prolonged downtrend, with price consolidating within a descending wedge pattern. The pair is testing a breakout point, and fundamentals favor a bullish recovery supported by GBP strength relative to AUD weakness.
Technical Analysis (4H Chart)
Pattern: Descending wedge formation, often a bullish reversal structure.
Current Level: 2.0507, holding within the wedge and preparing for a potential breakout.
Key Support Levels:
2.0416 – immediate support and invalidation zone if broken.
2.0350 – extended support if bearish pressure resumes.
Resistance Levels:
2.0650 – near-term breakout level.
2.0740 – secondary bullish target if breakout confirms.
Projection: If the wedge breaks upward, price could rally toward 2.0650 initially, then 2.0740 for further confirmation of bullish momentum.
Fundamental Analysis
Bias: Bullish if breakout confirms.
Key Fundamentals:
GBP: BOE remains cautious but leans toward maintaining tight policy amid sticky inflation.
AUD: RBA is constrained by weaker growth and trade risks linked to global tariffs, limiting AUD upside.
Global Sentiment: Risk-off sentiment weighs on AUD, favoring GBP relative strength.
Risks:
Hawkish RBA surprise or strong China data could strengthen AUD.
BOE dovish signals may cap GBP upside.
Key Events:
BOE policy updates and UK inflation data.
RBA meeting and Chinese economic releases.
Leader/Lagger Dynamics
GBP/AUD is a lagger, often following EUR/AUD and GBP/USD movements, but it could gain momentum if GBP strength broadens against risk-sensitive currencies.
Summary: Bias and Watchpoints
GBP/AUD is setting up for a bullish reversal, with key breakout confirmation above 2.0650. A move toward 2.0740 would reinforce this scenario. The main watchpoints are BOE policy tone, RBA updates, and China’s economic signals.
AUDCAD Long Position levels
A long position is initiated on AUDCAD following a significant bullish breakout from a multi-day consolidation. This idea outlines a two-tiered take-profit strategy, targeting key psychological and structural resistance levels, while managing risk with a defined stop loss.
Entry: 0.89560
Take Profit 1: 0.9001
Take Profit 2: 0.91560
Stop Loss: 0.88808
Current Status & Outlook: The price is currently trading just above the potential entry point. The trade is based on the expectation of a sustained upward move after the recent breakout, with a clear strategy for taking profits and managing risk.
Disclaimer
This analysis is for educational and informational purposes only and does not constitute financial advice. The provided trade idea is based on technical analysis and historical price action, and past performance is not indicative of future results. Trading foreign exchange on margin carries a high level of risk and may not be suitable for all investors. Before deciding to trade, you should carefully consider your investment objectives, level of experience, and risk appetite. You could lose some or all of your initial investment. Seek advice from an independent financial advisor if you have any doubts. Any action you take upon the information on this chart and analysis is strictly at your own risk.

AUDCHF - Already Overbought!Hello TradingView Family / Fellow Traders. This is Richard, also known as theSignalyst.
📈AUDCHF has been overall bullish trading within the rising channel marked in red and it is currently retesting the upper bound of the channel acting as an over-bought zone.
Moreover, the blue zone is a strong weekly resistance.
📚 As per my trading style:
As #AUDCHF approaches the red circle zone, I will be looking for bearish reversal setups (like a double top pattern, trendline break , and so on...)
📚 Always follow your trading plan regarding entry, risk management, and trade management.
Good luck!
All Strategies Are Good; If Managed Properly!
~Rich
Disclosure: I am part of Trade Nation's Influencer program and receive a monthly fee for using their TradingView charts in my analysis.

AUD/NZD BEARS ARE STRONG HERE|SHORT
Hello, Friends!
AUD-NZD uptrend evident from the last 1W green candle makes short trades more risky, but the current set-up targeting 1.093 area still presents a good opportunity for us to sell the pair because the resistance line is nearby and the BB upper band is close which indicates the overbought state of the AUD/NZD pair.
Disclosure: I am part of Trade Nation's Influencer program and receive a monthly fee for using their TradingView charts in my analysis.
✅LIKE AND COMMENT MY IDEAS✅

EUR/AUD Confirmed Downside Direction,Short Setup To Get 150 PipsHere is My 2H T.F Chart and if we have a look we will see that we have a very good breakout after this sideways movement , the price finally closed below my res and we have a good confirmation with 4H Bearish candle closure below my res so i`m waiting the price to go back to retest this broken res and then we can enter a sell trade . and if the price closed above my res with daily candle then this idea will not be valid anymore .

AUDJPY Forming Bullish MomentumAUDJPY has recently bounced from a strong demand zone near the 94.50–95.00 region, as seen on the 4H chart. This zone has acted as a key support area in previous price action, and the market is now printing higher lows after rejecting it multiple times. Price is showing bullish momentum, and with buyers stepping in aggressively from this area, we are now anticipating a continuation to the upside toward 96.80 and beyond.
From a fundamental perspective, the Australian dollar is gaining traction due to recent upbeat economic sentiment, especially as the Reserve Bank of Australia (RBA) maintains its data-dependent stance. Although rate hikes are on pause, the RBA is leaving the door open for further tightening should inflation remain sticky. On the flip side, the Japanese yen remains weak across the board, with the Bank of Japan maintaining ultra-loose monetary policy and no near-term signals of change. This divergence in central bank policy continues to support bullish pressure on AUDJPY.
Technically, the risk-reward profile is favorable. The bullish engulfing candles off the demand zone suggest strong buyer intent. A break and hold above the intraday resistance around 96.00 would confirm bullish continuation, with upside targets stretching toward 96.80–97.20. Meanwhile, stops can be managed tightly below 94.50, keeping the setup clean and structured. With the yen facing broad weakness and Aussie resilience in play, this pair offers momentum trading potential.
Overall, AUDJPY is primed for upside as long as the support zone holds. Traders should monitor price action around current levels for bullish confirmation and scale in on minor pullbacks. This setup aligns with market sentiment and fundamental divergence, creating a high-probability opportunity in the current forex landscape.

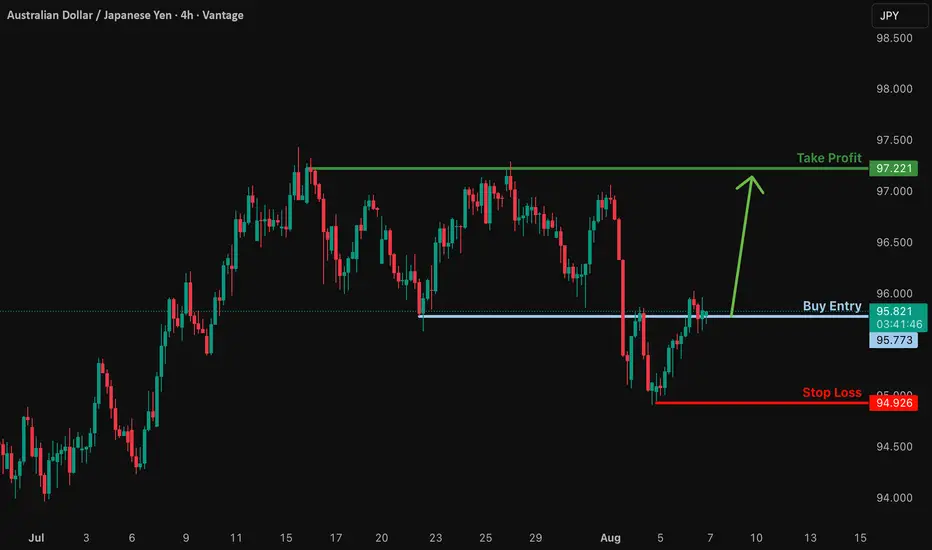
Bullish rise?AUD/JPY is reacting off the support level which is an overlap support and could bounce from this level to our take profit.
Entry: 95.77
Why we like it:
There is an overlap support.
Stop loss: 94.92
Why we like it:
There is a swing low support.
Take profit: 97.22
Why we like it:
There is a multi swing high resistance.
Enjoying your TradingView experience? Review us!
Please be advised that the information presented on TradingView is provided to Vantage (‘Vantage Global Limited’, ‘we’) by a third-party provider (‘Everest Fortune Group’). Please be reminded that you are solely responsible for the trading decisions on your account. There is a very high degree of risk involved in trading. Any information and/or content is intended entirely for research, educational and informational purposes only and does not constitute investment or consultation advice or investment strategy. The information is not tailored to the investment needs of any specific person and therefore does not involve a consideration of any of the investment objectives, financial situation or needs of any viewer that may receive it. Kindly also note that past performance is not a reliable indicator of future results. Actual results may differ materially from those anticipated in forward-looking or past performance statements. We assume no liability as to the accuracy or completeness of any of the information and/or content provided herein and the Company cannot be held responsible for any omission, mistake nor for any loss or damage including without limitation to any loss of profit which may arise from reliance on any information supplied by Everest Fortune Group.
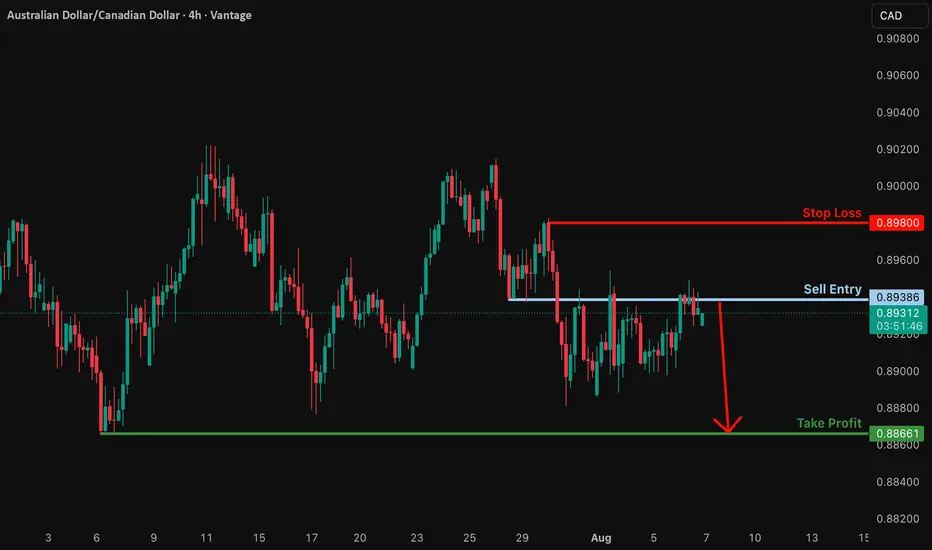
Potential bearish drop?AUD/CAD is reacting off the resistance level, which is a pullback resistance, and could drop from this level to our take-profit.
Entry: 0.89386
Why we like it:
There is a pullback resistance.
Stop loss: 0.8980
Why we like it:
There is a pullback resistance.
Take profit: 0.8866
Why we like it:
There is a swing low support.
Enjoying your TradingView experience? Review us!
Please be advised that the information presented on TradingView is provided to Vantage (‘Vantage Global Limited’, ‘we’) by a third-party provider (‘Everest Fortune Group’). Please be reminded that you are solely responsible for the trading decisions on your account. There is a very high degree of risk involved in trading. Any information and/or content is intended entirely for research, educational and informational purposes only and does not constitute investment or consultation advice or investment strategy. The information is not tailored to the investment needs of any specific person and therefore does not involve a consideration of any of the investment objectives, financial situation or needs of any viewer that may receive it. Kindly also note that past performance is not a reliable indicator of future results. Actual results may differ materially from those anticipated in forward-looking or past performance statements. We assume no liability as to the accuracy or completeness of any of the information and/or content provided herein and the Company cannot be held responsible for any omission, mistake nor for any loss or damage including without limitation to any loss of profit which may arise from reliance on any information supplied by Everest Fortune Group.
AUD_JPY BEARISH BIAS|SHORT|
✅AUD_JPY has retested a key resistance level of 96.000
And as the pair is already making a bearish pullback
A move down to retest the demand level below at 95.500 is likely
SHORT🔥
✅Like and subscribe to never miss a new idea!✅
