AUDJPY Ready To "Drop A Shoulder"? Multi-Timeframe May Help!OANDA:AUDJPY is beginning to form a very convincingly strong Reversal Pattern, the Head & Shoulders!
Starting with the Daily Chart we can see that Price is Forming a Doji Candle just after trying to Breakout of a Major Resistance Zone created from the Highs of March 18th and if Price is unable to close above this level, this strengthens the Bearish and Reversal Bias.
Now the 4 Hr Chart shows both the "First Shoulder" or Previous Higher High that was surpassed by the "Head" which is the New Higher High, has formed quite quickly with a slightly Ascending "Neckline" or Support Line where Bulls were able to make their Last Stand.
With a Reversal Pattern, you want to see a Change in Trend, in this case, would be a Lower High then that of the Higher High or "Head" @ 96.204.
*If Bulls are able to Push Price above the "Left Shoulder" or Previous Higher High @ 95.952, this will Invalidate the Head & Shoulders Set-up!
**If Bulls are unable to Break Above 95.952 and Price is pushed back down to the Confirmation or "Neckline" for a 3rd time, this Confirms the Head & Shoulders Set-up!!
Based on the Distance between the Head and Neckline, we can project a potential drop down to the next Support Level as a Price Target @ 95.00 once:
1) Pattern is Confirmed
2) Breakout is Validated
AUD (Australian Dollar)

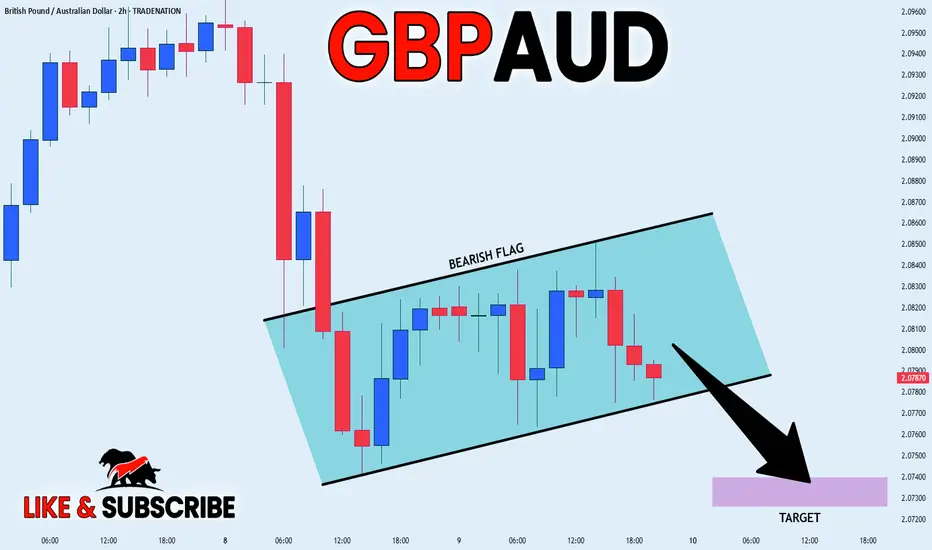
GBP_AUD BEARISH FLAG|SHORT|
✅GBP_AUD is going down now
And the pair has formed
A bearish flag pattern
Which makes me bearish biased
And after the breakout
I believe we will see bearish continuation
SHORT🔥
✅Like and subscribe to never miss a new idea!✅
Disclosure: I am part of Trade Nation's Influencer program and receive a monthly fee for using their TradingView charts in my analysis.
AUDJPY: Short Trade with Entry/SL/TP
AUDJPY
- Classic bearish pattern
- Our team expects retracement
SUGGESTED TRADE:
Swing Trade
Sell AUDJPY
Entry - 95.749
Stop - 96.149
Take - 94.847
Our Risk - 1%
Start protection of your profits from lower levels
Disclosure: I am part of Trade Nation's Influencer program and receive a monthly fee for using their TradingView charts in my analysis.
❤️ Please, support our work with like & comment! ❤️

EURAUD sell signal. Don't forget about stop-loss.
Write in the comments all your questions and instruments analysis of which you want to see.
Friends, push the like button, write a comment, and share with your mates - that would be the best THANK YOU.
P.S. I personally will open entry if the price will show it according to my strategy.
Always make your analysis before a trade

GBPAUD neutral - 9th July 2025This is my detailed multi-timeframe analysis for GBPAUD, based on the prevailing market structure, key liquidity zones, and candlestick behaviour.
Quarterly Timeframe:
On the three-month timeframe, price recently reached a significant liquidity region around 2.1600. From this level, the market has attracted substantial bearish orders, as evidenced by the recent quarterly candlestick, which closed relatively bearish. This suggests that bullish momentum has weakened considerably at these highs. Consequently, I expect that additional bearish orders may continue to enter the market, leading to a moderate retracement in the coming quarters.
Monthly Timeframe:
On the monthly chart, while price rejected the major liquidity region at 2.1600, the subsequent monthly candles have shown some signs of bullish intent, as indicated by wicks forming higher highs and higher lows. However, the candlestick bodies reveal an overall lack of follow-through, implying indecision in the market.
June’s monthly candle closed relatively bearish and indecisive, which may suggest that price is currently accumulating orders to fuel its next significant move. My current intuition leans towards a potential continuation higher, provided that price action confirms this bias. Notably, June’s candle could be interpreted as a potential order block, suggesting the possibility of price filling orders for a bullish move.
Nevertheless, the presence of a textbook ‘W’ formation must be acknowledged. The bearish close in June may imply a retest of the neckline around the 2.0300 level. Should bearish confirmations appear, this scenario could unfold in the medium term.
Weekly Timeframe:
The weekly timeframe indicates that price has been consolidating for the past five weeks. This choppy, indecisive price action makes the structure more challenging to interpret with conviction. The base of this consolidation zone sits around 2.0825; a clear weekly close below this level could present a case for bearish continuation, contingent on supporting confluences. At present, my bias on the weekly timeframe remains neutral given the lack of a clear directional signal.
Daily Timeframe:
On the daily chart, the market showed notable bearish activity in the previous session, closing below the key 2.0880 region. The next significant liquidity area to watch lies around 2.0700. My short-term bias for the day is bearish, and I anticipate that price may move towards this region. However, I do not regard this as a high-probability setup, so caution is warranted.
4-Hour Timeframe:
The 4-hour timeframe offers little additional clarity beyond the observation that price absorbed considerable bearish orders around the 2.0950 level. If price closes above the 2.0838 level, I will consider a short-term long position targeting the daily liquidity region at 2.0880. Overall, my stance on the 4-hour chart is largely neutral until more decisive price action emerges.
Disclaimer:
This analysis is intended for informational and educational purposes only. It does not constitute financial advice. Please conduct your own research and apply sound risk management before entering any trades.

AUDJPY 1D: breakout toward 100–105AUDJPY has confirmed an inverse head and shoulders breakout on the daily chart, with a strong move above the neckline. All key moving averages, including MA50 and MA200, remain below the current price — confirming bullish momentum. Volume increased on the breakout, and price has held above the 95.6 neckline zone. As long as that level holds, the setup remains valid. Targets are set at 100.36 (1.618 Fibo) and 105.19 (2.0 Fibo).

AUD/JPY BEARS WILL DOMINATE THE MARKET|SHORT
Hello, Friends!
The BB upper band is nearby so AUD/JPY is in the overbought territory. Thus, despite the uptrend on the 1W timeframe I think that we will see a bearish reaction from the resistance line above and a move down towards the target at around 95.252.
Disclosure: I am part of Trade Nation's Influencer program and receive a monthly fee for using their TradingView charts in my analysis.
✅LIKE AND COMMENT MY IDEAS✅

AUDJPY Bullish Channel Still Intact, Eyeing Breakout Above 95.00AUDJPY continues to respect its ascending channel, with the current bounce occurring right at the 61.8% Fibonacci retracement and lower trendline support. The structure supports further upside as long as price holds above the 94.00–93.80 zone, with targets set toward 94.77 and 95.36, potentially extending to 95.63 highs.
🧠 Fundamentals:
AUD Strength Drivers:
RBA remains relatively hawkish vs other G10 banks.
Australia's data this week (retail sales, NAB confidence) were mixed, but no rate cut pricing in the near term supports AUD.
Iron ore demand showing resilience despite Chinese slowdown concerns.
JPY Weakness Drivers:
BoJ remains ultra-dovish. No action expected in July.
Japan’s inflation remains tame; the yield gap with other majors keeps widening.
Risk-on sentiment reduces demand for safe-havens like JPY.
🔍 Technical Structure:
Strong upward channel since early June remains valid.
Current pullback held the 61.8% Fib retracement of the June-July leg.
Bullish engulfing near support confirms entry.
Immediate resistance at 94.77 → 95.36 → potential breakout to 95.63.
Invalid if price closes below 93.80 (channel break).
⚠️ Risk Factors:
Risk-off shift (e.g., geopolitical escalation or U.S. CPI surprise) may boost JPY.
China growth fears can weigh on AUD.
A sudden dovish shift from the RBA would invalidate bullish fundamentals.
🔁 Leader/Lagger Dynamics:
AUDJPY typically leads other yen crosses (e.g., NZDJPY, CADJPY) during risk-on moves. It’s also a barometer for broader risk sentiment, often following moves in equity indices like US500 or commodity-linked assets.
✅ Trade Bias: Bullish
TP1: 94.77
TP2: 95.36
TP3 (aggressive): 95.63
SL: Below 93.80
Event to Watch: China data this week + U.S. CPI (Jul 11)
📌 Watch for a strong bullish daily candle above 94.77 for continuation confirmation. Stay nimble around key global risk events.

AUD_JPY WILL KEEP GROWING|LONG|
✅AUD_JPY is going up
Now and the pair made a bullish
Breakout of the key horizontal
Level of 95.600 and the breakout
Is confirmed so we are bullish
Biased and further growth
Is to be expected
LONG🚀
✅Like and subscribe to never miss a new idea!✅
Disclosure: I am part of Trade Nation's Influencer program and receive a monthly fee for using their TradingView charts in my analysis.

AUD_NZD SWING SHORT|
✅AUD_NZD has been growing recently
And the pair seems locally overbought
So as the pair is approaching a horizontal resistance of 1.0920
Price decline is to be expected
SHORT🔥
✅Like and subscribe to never miss a new idea!✅
Disclosure: I am part of Trade Nation's Influencer program and receive a monthly fee for using their TradingView charts in my analysis.

AUD-JPY Bullish Breakout! Buy!
Hello,Traders!
AUD-JPY is trading in a
Strong uptrend and the pair
Made a bullish breakout of
The key horizontal level
Of 95.650 which is now a
Support and the breakout
Is confirmed so we are bullish
Biased and we will be expecting
A further bullish move up
Buy!
Comment and subscribe to help us grow!
Check out other forecasts below too!
Disclosure: I am part of Trade Nation's Influencer program and receive a monthly fee for using their TradingView charts in my analysis.

AUDNZD; Heikin Ashi Trade IdeaOANDA:AUDNZD
In this video, I’ll be sharing my analysis of AUDNZD, using FXAN's proprietary algo indicators with my unique Heikin Ashi strategy. I’ll walk you through the reasoning behind my trade setup and highlight key areas where I’m anticipating potential opportunities.
I’m always happy to receive any feedback.
Like, share and comment! ❤️
Thank you for watching my videos! 🙏

EURAUD support retest at 1.7880The EURAUD currency pair maintains a bullish bias, underpinned by the prevailing upward trend. Recent sideways consolidation in intraday price action suggests a potential continuation pattern within the broader uptrend.
The key level to watch is 1.7880, marking the lower boundary of the recent consolidation range. A corrective pullback toward this level, followed by a bullish bounce, could trigger a fresh rally targeting resistance levels at 1.8020, then 1.8060, and potentially 1.8090 over the medium term.
Conversely, a decisive breakdown below 1.7880, confirmed by a daily close beneath this support, would invalidate the current bullish outlook. This would expose the pair to deeper retracement targets near 1.7840, followed by 1.7810.
Trend Bias: Bullish above 1.7880
Key Support: 1.7880, 1.7840, 1.7810
Key Resistance: 1.8020, 1.8060, 1.8090
Conclusion:
EURAUD remains technically constructive while holding above 1.7880. Traders should monitor this level for bullish continuation signals. A bounce from this zone could reinforce the uptrend, while a break and close below it would shift momentum and open the door for a deeper corrective move.
This communication is for informational purposes only and should not be viewed as any form of recommendation as to a particular course of action or as investment advice. It is not intended as an offer or solicitation for the purchase or sale of any financial instrument or as an official confirmation of any transaction. Opinions, estimates and assumptions expressed herein are made as of the date of this communication and are subject to change without notice. This communication has been prepared based upon information, including market prices, data and other information, believed to be reliable; however, Trade Nation does not warrant its completeness or accuracy. All market prices and market data contained in or attached to this communication are indicative and subject to change without notice.

AUDNZD Breakout Retest – Ready for the Next Bullish Leg?
AUDNZD has broken out of a prolonged consolidation box, supported by a demand zone below. Price is currently retesting the breakout level, which often acts as a launchpad for the next move.
🧠 Key Observations:
🔷 Consolidation Breakout – Price cleanly broke above the consolidation range.
🔁 Retest in Progress – A potential bullish retest is unfolding at 1.0800 area.
🟦 Demand Zone below offers strong support around 1.0730–1.0750.
🎯 Target: 1.08750 (pre-identified resistance zone)
----------
📌 Trade Plan:
🎯 Take Profit (TP): 1.0875
🛑 Stop Loss (SL): Below 1.0750 demand zone
🧭 Bias: Bullish
📊 Strategy: Breakout–Retest–Rally

AUDJPY SHORT FORECAST Q3 D8 W28 Y25AUDJPY SHORT FORECAST Q3 D8 W28 Y25
Professional Risk Managers👋
Welcome back to another FRGNT chart update📈
Diving into some Forex setups using predominantly higher time frame order blocks alongside confirmation breaks of structure.
Let’s see what price action is telling us today! 👀
🔑 Remember, to participate in trading comes always with a degree of risk, therefore as professional risk managers it remains vital that we stick to our risk management plan as well as our trading strategies.
📈The rest, we leave to the balance of probabilities.
💡Fail to plan. Plan to fail.
🏆It has always been that simple.
❤️Good luck with your trading journey, I shall see you at the very top.
🎯Trade consistent, FRGNT X

AUD-CHF Rebound Ahead! Buy!
Hello,Traders!
AUD-CHF keeps falling but
A horizontal support level
Is ahead around 0.5160
And as the pair is locally
Oversold we will be expecting
A local bullish rebound
Buy!
Comment and subscribe to help us grow!
Check out other forecasts below too!
Disclosure: I am part of Trade Nation's Influencer program and receive a monthly fee for using their TradingView charts in my analysis.

AUDJPY SHORT FORECAST Q3 W28 Y25AUDJPY SHORT FORECAST Q3 W28 Y25
Professional Risk Managers👋
Welcome back to another FRGNT chart update📈
Diving into some Forex setups using predominantly higher time frame order blocks alongside confirmation breaks of structure.
Let’s see what price action is telling us today! 👀
💡Here are some trade confluences📝
✅Weekly Order Block Identified
✅Daily Order block identified
✅4H Order Block identified
✅15' Order block identified
🔑 Remember, to participate in trading comes always with a degree of risk, therefore as professional risk managers it remains vital that we stick to our risk management plan as well as our trading strategies.
📈The rest, we leave to the balance of probabilities.
💡Fail to plan. Plan to fail.
🏆It has always been that simple.
❤️Good luck with your trading journey, I shall see you at the very top.
🎯Trade consistent, FRGNT X

AUDNZD: Short Trade Explained
AUDNZD
- Classic bearish formation
- Our team expects pullback
SUGGESTED TRADE:
Swing Trade
Short AUDNZD
Entry - 1.0834
Sl - 1.0850
Tp - 1.0801
Our Risk - 1%
Start protection of your profits from lower levels
Disclosure: I am part of Trade Nation's Influencer program and receive a monthly fee for using their TradingView charts in my analysis.
❤️ Please, support our work with like & comment! ❤️

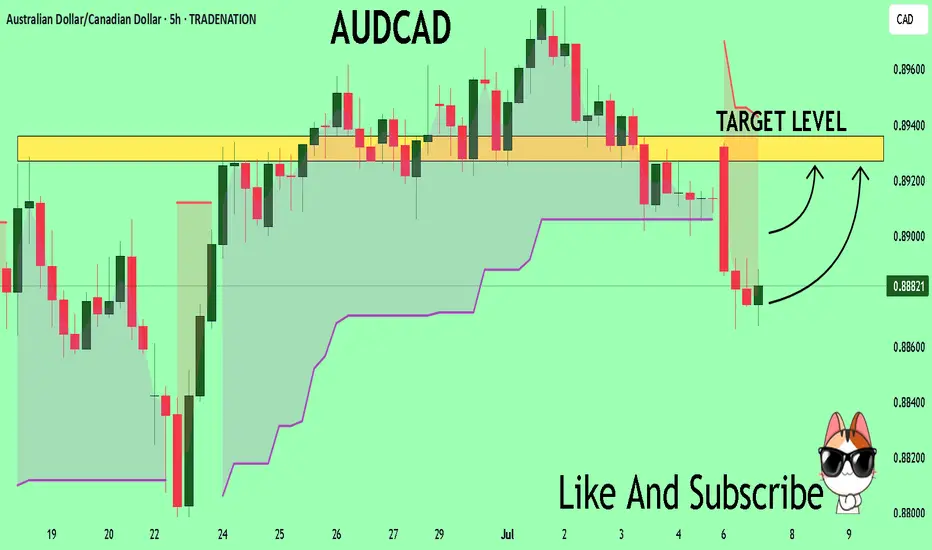
AUDCAD Trading Opportunity! BUY!
My dear subscribers,
AUDCAD looks like it will make a good move, and here are the details:
The market is trading on 0.8881 pivot level.
Bias - Bullish
Technical Indicators: Both Super Trend & Pivot HL indicate a highly probable Bullish continuation.
Target - 0.8927
About Used Indicators:
The average true range (ATR) plays an important role in 'Supertrend' as the indicator uses ATR to calculate its value. The ATR indicator signals the degree of price volatility.
Disclosure: I am part of Trade Nation's Influencer program and receive a monthly fee for using their TradingView charts in my analysis.
———————————
WISH YOU ALL LUCK
EURAUD Local Long!
HI Traders !
#EURAUD is trading in an
Uptrend and the pair is
About to retest a horizontal
Support of 1.79749 and as
We are locally bullish biased
We will be expecting a
Local bullish rebound !
Comment and subscribe to help us grow !

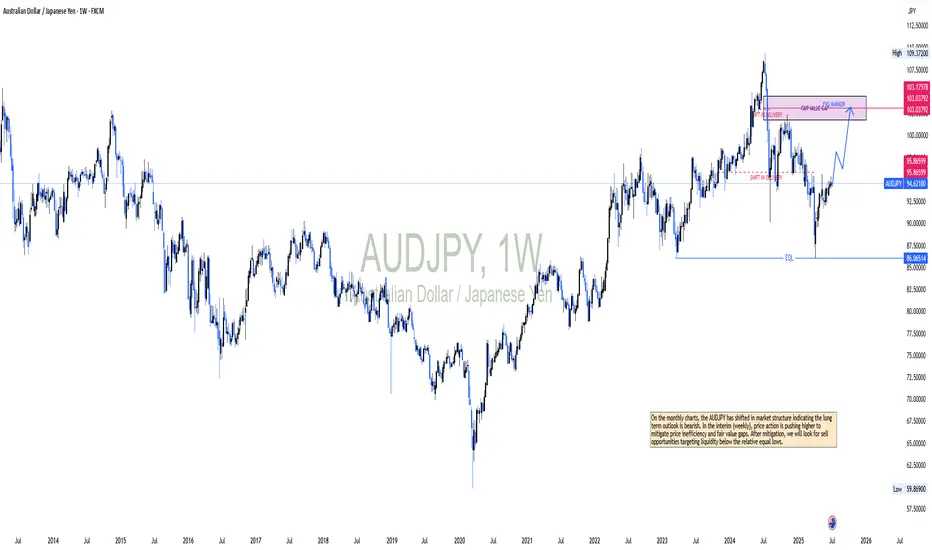
AUDJPY OUTLOOKOn the monthly charts, the AUDJPY has shifted in market structure indicating the long term outlook is bearish. In the interim (weekly), price action is pushing higher to mitigate price inefficiency and fair value gaps. After mitigation, we will look for sell opportunities targeting liquidity below the relative equal lows.
EURAUD - Bearish... but not for long!Hello TradingView Family / Fellow Traders. This is Richard, also known as theSignalyst.
As per our last EURAUD analysis, attached on the chart, it rejected the upper bound of the blue channel and traded lower.
What's next?
📈EURAUD is now retesting the lower bound of the channel.
Moreover, the blue zone is a strong demand.
🏹 Thus, the highlighted blue circle is a strong area to look for buy setups as it is the intersection of the lower blue trendline and demand.
📚 As per my trading style:
As #EURAUD is around the blue circle zone, I will be looking for bullish reversal setups (like a double bottom pattern, trendline break , and so on...)
📚 Always follow your trading plan regarding entry, risk management, and trade management.
Good luck!
All Strategies Are Good; If Managed Properly!
~Rich
Disclosure: I am part of Trade Nation's Influencer program and receive a monthly fee for using their TradingView charts in my analysis.

EUR/AUD Made Perfect Breakout , Long Setup Valid To Get 150 PipsHere is My 2H T.F Chart and if we have a look we will see that we have a very good breakout after this ascending triangle , the price finally closed above neckline for this pattern and we have a good confirmation so i`m waiting the price to go back to retest this broken neckline and then we can enter a buy trade . and if the price closed below my neckline with daily candle then this idea will not be valid anymore .
