AUD_JPY MOVE DOWN AHEAD|SHORT|
✅AUD_JPY made a retest of
The strong horizontal resistance of 93.900
Level of 106.083 and as you
Can see the pair is already
Making a local pullback from
The level which sends a clear
Bearish signal to us therefore
We will be expecting a
Further bearish correction
SHORT🔥
✅Like and subscribe to never miss a new idea!✅
Disclosure: I am part of Trade Nation's Influencer program and receive a monthly fee for using their TradingView charts in my analysis.
AUD (Australian Dollar)

AUD-CHF Pullback Ahead! Sell!
Hello,Traders!
AUD-CHF made a retest
Of the strong wide horizontal
Resistance around 0.5289
And we are already seeing a
Local pullback so we are
Locally bearish biased and
We will be expecting a
Further bearish move down
On Monday
Sell!
Comment and subscribe to help us grow!
Check out other forecasts below too!
Disclosure: I am part of Trade Nation's Influencer program and receive a monthly fee for using their TradingView charts in my analysis.

AUDJPY Will Go Lower From Resistance! Sell!
Take a look at our analysis for AUDJPY.
Time Frame: 30m
Current Trend: Bearish
Sentiment: Overbought (based on 7-period RSI)
Forecast: Bearish
The market is on a crucial zone of supply 93.507.
The above-mentioned technicals clearly indicate the dominance of sellers on the market. I recommend shorting the instrument, aiming at 93.232 level.
P.S
Please, note that an oversold/overbought condition can last for a long time, and therefore being oversold/overbought doesn't mean a price rally will come soon, or at all.
Disclosure: I am part of Trade Nation's Influencer program and receive a monthly fee for using their TradingView charts in my analysis.
Like and subscribe and comment my ideas if you enjoy them!

AUDCHF Will Go Down! Short!
Take a look at our analysis for AUDCHF.
Time Frame: 15m
Current Trend: Bearish
Sentiment: Overbought (based on 7-period RSI)
Forecast: Bearish
The market is testing a major horizontal structure 0.526.
Taking into consideration the structure & trend analysis, I believe that the market will reach 0.524 level soon.
P.S
Overbought describes a period of time where there has been a significant and consistent upward move in price over a period of time without much pullback.
Disclosure: I am part of Trade Nation's Influencer program and receive a monthly fee for using their TradingView charts in my analysis.
Like and subscribe and comment my ideas if you enjoy them!

EURUSD is continuing its uptrendEURUSD is still in a strong uptrend. There was a drop in the Asian and European sessions on Friday but that was not enough to reverse the pair. The end of the US session saw the price being pushed up by the bulls from the 1.155 price zone and is stuck in this resistance zone.
The price continues to increase when breaking 1.155 will head towards the resistance of 1.161, the highest peak of last week. If there is a retest of 1.155, the price will head towards 1.166 next week to be able to use short-term SELL strategies
The BUY strategy is still prioritized as the EU is still in an uptrend. The main BUY zone of the pair is still waiting for 1.150 and lower is the breakout zone of 1.145
Resistance: 1.161, 1.166
Support: 1.150, 1.145

AUD_CHF LOCAL SHORT|
✅AUD_CHF has retested a resistance level of 0.5290
And we are seeing a bearish reaction
With the price going down but we need
To wait for a confirmation
Before entering the trade, so that we
Get a higher success probability of the trade
SHORT🔥
✅Like and subscribe to never miss a new idea!✅
Disclosure: I am part of Trade Nation's Influencer program and receive a monthly fee for using their TradingView charts in my analysis.

AUD-JPY Will Go Down! Sell!
Hello,Traders!
AUD-JPY made a retest
A wide horizontal resistance
Around 93.900 from where
We are already seeing a
Local bearish pullback so
We will be expecting
A further bearish move
Down on Monday
Sell!
Comment and subscribe to help us grow!
Check out other forecasts below too!
Disclosure: I am part of Trade Nation's Influencer program and receive a monthly fee for using their TradingView charts in my analysis.

AUDJPY TREND TRADINGLooking to follow the lower time frame bullish trend next week to play into the higher timeframe down trend. Three trade ideas roughly looking to bank 16R. can squeeze more depending on if you market execute from price action signals or just set limit orders with conservative stop loss sizes.

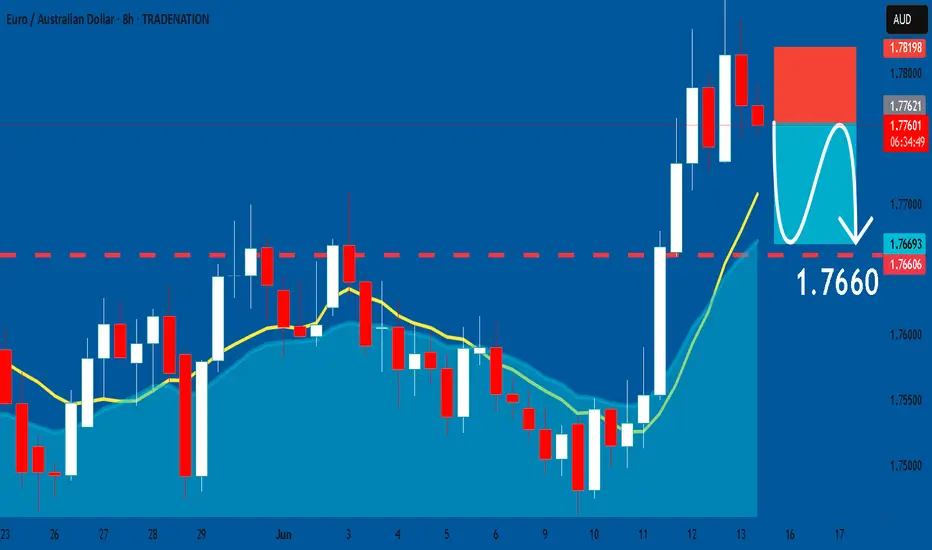
EURAUD: Bearish Continuation & Short Trade
EURAUD
- Classic bearish formation
- Our team expects fall
SUGGESTED TRADE:
Swing Trade
Sell EURAUD
Entry Level - 1.7760
Sl - 1.7819
Tp - 1.7660
Our Risk - 1%
Start protection of your profits from lower levels
Disclosure: I am part of Trade Nation's Influencer program and receive a monthly fee for using their TradingView charts in my analysis.
❤️ Please, support our work with like & comment! ❤️
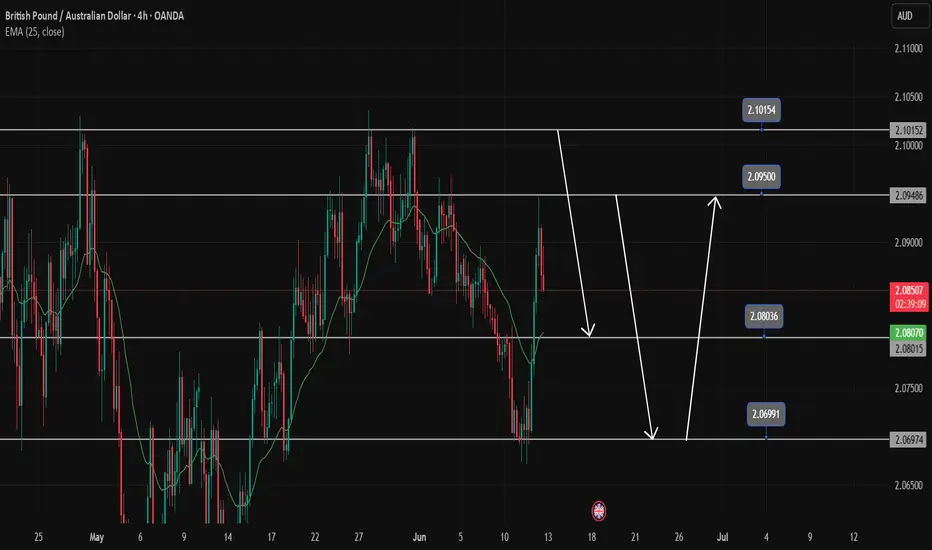
GBPAUD Trading SignalsGBPAUD is reacting at the resistance zone with this force, the downtrend will continue at 2.08000. If you want to BUY at 2.0800, you have to wait for the price reaction of the candle. If you break 2.080, you have to wait at 2.06900 for BUY strategies. In the opposite direction, the peak of 2.101 is still an important peak where you can execute the SELL strategy with the GBPAUD currency pair.
GBP/AUD BEARISH BIAS RIGHT NOW| SHORT
Hello, Friends!
We are now examining the GBP/AUD pair and we can see that the pair is going up locally while also being in a uptrend on the 1W TF. But there is also a powerful signal from the BB upper band being nearby, indicating that the pair is overbought so we can go short from the resistance line above and a target at 2.078 level.
Disclosure: I am part of Trade Nation's Influencer program and receive a monthly fee for using their TradingView charts in my analysis.
✅LIKE AND COMMENT MY IDEAS✅

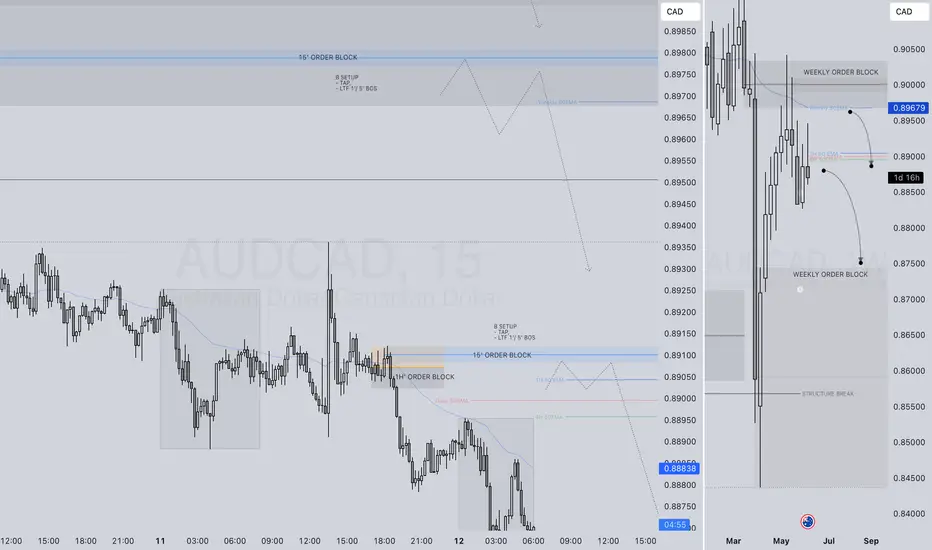
AUDCAD SHORT FORECAST Q2 W24 D13 Y25AUDCAD SHORT FORECAST Q2 W24 D13 Y25
Professional Risk Managers👋
Welcome back to another FRGNT chart update📈
Diving into some Forex setups using predominantly higher time frame order blocks alongside intraday confirmation breaks of structure.
💡Here are some trade confluences📝
✅Weekly 50 EMA
✅Weekly order block rejection
✅Daily order block rejection
✅15’ order block identification
🔑 Remember, to participate in trading comes always with a degree of risk, therefore as professional risk managers it remains vital that we stick to our risk management plan as well as our trading strategies.
📈The rest, we leave to the balance of probabilities.
💡Fail to plan. Plan to fail.
🏆It has always been that simple.
❤️Good luck with your trading journey, I shall see you at the very top.
🎯Trade consistent, FRGNT X

AUDJPY SHORT FORECAST Q2 W24 D13 Y25AUDJPY SHORT FORECAST Q2 W24 D13 Y25
Professional Risk Managers👋
Welcome back to another FRGNT chart update📈
Diving into some Forex setups using predominantly higher time frame order blocks alongside confirmation breaks of structure.
Let’s see what price action is telling us today! 👀
💡Here are some trade confluences📝
✅Weekly Order block rejection
✅15' Order block
✅1H 50EMA
✅Daily order block identified
🔑 Remember, to participate in trading comes always with a degree of risk, therefore as professional risk managers it remains vital that we stick to our risk management plan as well as our trading strategies.
📈The rest, we leave to the balance of probabilities.
💡Fail to plan. Plan to fail.
🏆It has always been that simple.
❤️Good luck with your trading journey, I shall see you at the very top.
🎯Trade consistent, FRGNT X

Why AUDCAD is On My Watchlist for a Short Trade🔎 AUDCAD Trade Idea Overview 🔎
Currently watching AUDCAD closely 👀 — and here’s what I’m seeing across the key timeframes:
📉 On the weekly timeframe, the pair remains in a clear bearish trend, with lower highs and lower lows forming consistently.
🕰️ Dropping down to the daily, we’re seeing continued bearish momentum in alignment with the higher timeframe bias.
⏳ On the 4-hour chart, there’s been a clean break of market structure, confirming short-term weakness.
🎯 I’m eyeing a pullback into equilibrium within the current price range for a potential short entry.
🔹 Entry: On retracement into a key value zone
🔹 Stop loss: Positioned above recent swing highs
🔹 Take profit: Targeting previous lows and liquidity pockets 💧
Patience is key here — waiting for the right setup to align across multiple timeframes. 📊
⚠️ Disclaimer: This is not financial advice. This analysis is for educational and informational purposes only. Always do your own research and manage risk responsibly. 💼

AUD-CHF Free Signal! Buy!
Hello,Traders!
AUD-CHF fell down sharply
But the pair will soon hit a
Horizontal support level
Of 0.5281 from where we
Can go long with the
Take Profit of 0.5312
And the Stop Loss of 0.5273
Buy!
Comment and subscribe to help us grow!
Check out other forecasts below too!
Disclosure: I am part of Trade Nation's Influencer program and receive a monthly fee for using their TradingView charts in my analysis.

EURAUD forming a top?EURAUD - 24h expiry
Price action looks to be forming a top.
Although the bulls are in control, the stalling positive momentum indicates a turnaround is possible.
Preferred trade is to sell into rallies.
Risk/Reward would be poor to call a sell from current levels.
Bespoke resistance is located at 1.7805.
We look to Sell at 1.7805 (stop at 1.7840)
Our profit targets will be 1.7705 and 1.7680
Resistance: 1.7830 / 1.7850 / 1.7880
Support: 1.7710 / 1.7680 / 1.7650
Risk Disclaimer
The trade ideas beyond this page are for informational purposes only and do not constitute investment advice or a solicitation to trade. This information is provided by Signal Centre, a third-party unaffiliated with OANDA, and is intended for general circulation only. OANDA does not guarantee the accuracy of this information and assumes no responsibilities for the information provided by the third party. The information does not take into account the specific investment objectives, financial situation, or particular needs of any particular person. You should take into account your specific investment objectives, financial situation, and particular needs before making a commitment to trade, including seeking advice from an independent financial adviser regarding the suitability of the investment, under a separate engagement, as you deem fit.
You accept that you assume all risks in independently viewing the contents and selecting a chosen strategy.
Where the research is distributed in Singapore to a person who is not an Accredited Investor, Expert Investor or an Institutional Investor, Oanda Asia Pacific Pte Ltd (“OAP“) accepts legal responsibility for the contents of the report to such persons only to the extent required by law. Singapore customers should contact OAP at 6579 8289 for matters arising from, or in connection with, the information/research distributed.

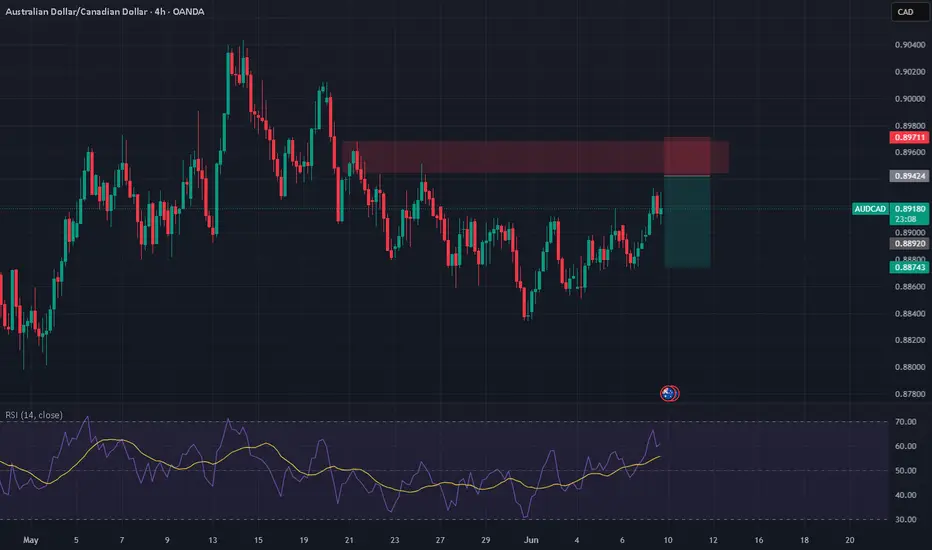
AUDCAD - Fundamentals vs Momentum – Betting on CAD🕓 Timeframe: 4H | ⚠️ Bias: Bearish From Supply Zone
AUDCAD is rejecting the 0.8940–0.8960 supply zone, a key resistance that's been respected multiple times. With RSI turning over near overbought and CAD fundamentals improving, this looks like a clean short opportunity.
📊 Technical Confluence
🔴 Resistance Zone: 0.8940–0.8960 (historical supply zone)
📉 Bearish Structure Intact: Still in a broader HTF downtrend (lower highs)
⚠️ RSI Divergence: Slowing near 62, suggesting momentum exhaustion
🕯️ Price Action: Current candle showing indecision – early signs of rejection
🌍 Fundamental Confluence
🇦🇺 AUD Weakness:
RBA paused rates, inflation easing → Dovish
AUD overextended after sentiment shift (conditional score ↑ too fast)
AUD vulnerable if sentiment shifts risk-off
🇨🇦 CAD Strength:
BoC holding firm on rates, hawkish tone
Oil production recovering → CAD-positive
COT net long position + seasonal strength
🎯 Trade Plan
📍 Entry: 0.8940–0.8955 (on bearish confirmation: engulfing/pin bar)
🛑 Stop Loss: 0.8975 (above resistance zone)
🎯 Take Profit 1: 0.8870 (mid-range)
🎯 Take Profit 2: 0.8830 (into demand zone)
⏱️ Optional: Partial entry now, scale in at 0.8960 if tapped
🧠 “Don’t chase the move. Sell the retest when momentum fades and fundamentals align.”
AUDCHF The Target Is UP! BUY!
My dear friends,
Please, find my technical outlook for AUDCHF below:
The price is coiling around a solid key level - 0.5349
Bias - Bullish
Technical Indicators: Pivot Points Low anticipates a potential price reversal.
Super trend shows a clear buy, giving a perfect indicators' convergence.
Goal - 0.5357
About Used Indicators:
The pivot point itself is simply the average of the high, low and closing prices from the previous trading day.
Disclosure: I am part of Trade Nation's Influencer program and receive a monthly fee for using their TradingView charts in my analysis.
———————————
WISH YOU ALL LUCK

AUDJPY Bullish Breakout supported at 92.00The AUD/JPY pair is currently maintaining a bullish bias, underpinned by an ongoing uptrend. Recent price action shows sideways consolidation, typically a sign of trend continuation when occurring within an established bullish structure.
Key Level: 91.50
This level marks a prior consolidation zone and now acts as a critical support area.
Bullish Scenario (bounce from 91.50):
A corrective dip to 91.50 followed by a strong bounce would support the bullish continuation.
Upside targets include:
94.20 – Immediate resistance
94.90 – Previous swing high
95.90 – Longer-term resistance
Bearish Scenario (break below 91.50):
A daily close below 91.50 would weaken the bullish outlook.
In this case, downside support levels include:
90.50 – Initial retracement target
89.40 – Deeper support zone
Conclusion
The outlook for AUD/JPY remains bullish while price holds above the key 91.50 support level. A successful bounce from this zone could lead to a retest of higher resistance levels at 94.20 and above. However, a confirmed break below 91.50 would shift sentiment to neutral-to-bearish, potentially triggering further declines toward 90.50 and 89.40. Traders should monitor price behavior at 91.50 for near-term directional cues.
This communication is for informational purposes only and should not be viewed as any form of recommendation as to a particular course of action or as investment advice. It is not intended as an offer or solicitation for the purchase or sale of any financial instrument or as an official confirmation of any transaction. Opinions, estimates and assumptions expressed herein are made as of the date of this communication and are subject to change without notice. This communication has been prepared based upon information, including market prices, data and other information, believed to be reliable; however, Trade Nation does not warrant its completeness or accuracy. All market prices and market data contained in or attached to this communication are indicative and subject to change without notice.

AUDCHF: Growth & Bullish Forecast
Balance of buyers and sellers on the AUDCHF pair, that is best felt when all the timeframes are analyzed properly is shifting in favor of the buyers, therefore is it only natural that we go long on the pair.
Disclosure: I am part of Trade Nation's Influencer program and receive a monthly fee for using their TradingView charts in my analysis.
❤️ Please, support our work with like & comment! ❤️

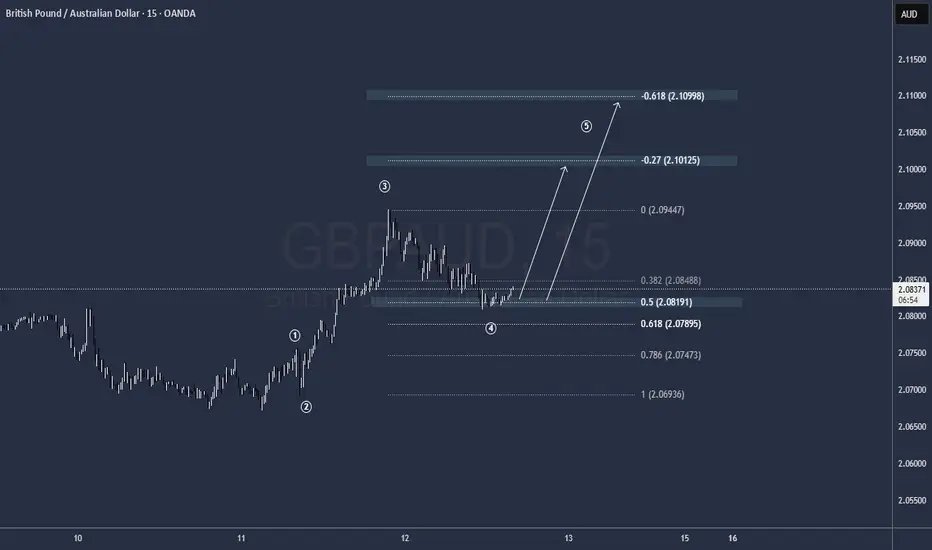
EURAUD - Short Term Buy IdeaM15 - Strong bullish move.
No opposite signs.
Currently it looks like a pullback is happening.
Expecting further continuation higher until the two Fibonacci support zones hold.
If you enjoy this idea, don’t forget to LIKE 👍, FOLLOW ✅, SHARE 🙌, and COMMENT ✍! Drop your thoughts and charts below to keep the discussion going. Your support helps keep this content free and reach more people! 🚀

AUDCAD SHORT FORECAST Q2 W24 D12 Y25AUDCAD SHORT FORECAST Q2 W24 D12 Y25
Professional Risk Managers👋
Welcome back to another FRGNT chart update📈
Diving into some Forex setups using predominantly higher time frame order blocks alongside intraday confirmation breaks of structure.
💡Here are some trade confluences📝
✅Weekly 50 EMA
✅Weekly order block rejection
✅Daily order block rejection
✅15’ order block identification
🔑 Remember, to participate in trading comes always with a degree of risk, therefore as professional risk managers it remains vital that we stick to our risk management plan as well as our trading strategies.
📈The rest, we leave to the balance of probabilities.
💡Fail to plan. Plan to fail.
🏆It has always been that simple.
❤️Good luck with your trading journey, I shall see you at the very top.
🎯Trade consistent, FRGNT X