Tariffs. Turbulence. OpportunityMarkets Rattle as Global Currencies Slide: Central Banks Prepare to Act
Global financial markets plunged on Monday as U.S. tariffs under the Trump administration, alongside retaliatory measures from key trading partners, officially took effect. The result: a wave of uncertainty and volatility that sent the Australian, Canadian, and New Zealand dollars spiraling to steeply discounted levels.
As this new economic reality unfolds, institutional investors and households alike are scrambling to adjust. In response, central banks across the globe face mounting pressure to stabilize their economies. The most immediate solution? Accelerated interest rate cuts.
Beyond the headline noise of trade wars, the deeper concern lies in domestic economic resilience. Economists and central bankers are increasingly turning inward, looking to bolster aggregate demand through aggressive monetary easing. The U.S. Federal Reserve, nudged persistently by President Trump, has already signaled its willingness to comply. Other central banks are expected to follow suit as nations seek to shield local industries from the impact of trade disruption.
The era of lower global interest rates appears to be more than a passing phase—it is becoming the new norm. In volatile times, disciplined strategies and a long-term lens are more essential than ever. We remain focused on seizing value where others see only risk.
AUD (Australian Dollar)

AUDJPY INTRADAY uptrend supported at 91.50The AUD/JPY pair is currently maintaining a bullish bias, underpinned by an ongoing uptrend. Recent price action shows sideways consolidation, typically a sign of trend continuation when occurring within an established bullish structure.
Key Level: 91.50
This level marks a prior consolidation zone and now acts as a critical support area.
Bullish Scenario (bounce from 91.50):
A corrective dip to 91.50 followed by a strong bounce would support the bullish continuation.
Upside targets include:
94.20 – Immediate resistance
94.90 – Previous swing high
95.90 – Longer-term resistance
Bearish Scenario (break below 91.50):
A daily close below 91.50 would weaken the bullish outlook.
In this case, downside support levels include:
90.50 – Initial retracement target
89.40 – Deeper support zone
Conclusion
The outlook for AUD/JPY remains bullish while price holds above the key 91.50 support level. A successful bounce from this zone could lead to a retest of higher resistance levels at 94.20 and above. However, a confirmed break below 91.50 would shift sentiment to neutral-to-bearish, potentially triggering further declines toward 90.50 and 89.40. Traders should monitor price behavior at 91.50 for near-term directional cues.
This communication is for informational purposes only and should not be viewed as any form of recommendation as to a particular course of action or as investment advice. It is not intended as an offer or solicitation for the purchase or sale of any financial instrument or as an official confirmation of any transaction. Opinions, estimates and assumptions expressed herein are made as of the date of this communication and are subject to change without notice. This communication has been prepared based upon information, including market prices, data and other information, believed to be reliable; however, Trade Nation does not warrant its completeness or accuracy. All market prices and market data contained in or attached to this communication are indicative and subject to change without notice.

AUDJPY Bounce or Breakdown? Key Levels Ahead
AUDJPY is currently showing bullish signs after a Change of Character (CHoCH) occurred at the 93.800 level. This breakout suggests potential for upward continuation.
The ZigZag structure also supports a bullish wave continuation, with the next Fibonacci-based target around 94.840.
A possible pullback remains valid as long as the price stays above the support zone at 92.700. Any breakdown below that level could weaken the bullish structure.
---------------------
📍 4H Chart Analysis (Supportive Confirmation)
On the higher timeframe (4H), the market appears to be forming an Inverse Head and Shoulders pattern , a strong bullish reversal structure.
- The price is currently building the right shoulder , with a potential neckline breakout targeting 96.000 , a strong psychological resistance.
- Two major scenarios to consider:
1. ✅ If price breaks above the neckline and sustains above 96.000, it could lead to a strong bullish rally.
2. ❌ If price fails to complete the pattern and breaks below the shoulder zone at 92.000, it may trigger a bearish move instead.
---------------------
🧠 Conclusion
As long as 92.700 holds , the 1H bullish scenario remains valid with a near-term target of 94.840 . The 4H chart adds strong structure support via the developing Inverse Head & Shoulders, favoring buyers — unless invalidated by a breakdown below 92.000.
📈 Active Bullish Setup (Above 92.700)
🎯 Target: 94.840 | Max Bull Potential: 96.000
🛑 Invalidation Below: 92.700 / 92.000 (4H shoulder base)

GBPAUD sideways consolidation supported at 2.070The GBPAUD currency pair continues to exhibit a bullish price action bias, underpinned by a well-established rising trend. Recent intraday movements indicate a sideways consolidation, suggesting the pair may be preparing for the next directional move.
Key Support Level: 2.0700
This level represents a significant area of prior consolidation and now acts as critical support. A corrective pullback toward 2.0700 could offer a bullish re-entry point if price action confirms support.
Bullish Scenario (on rebound from 2.0700):
A successful bounce from 2.0700 could re-ignite upward momentum.
Upside resistance targets include:
2.1280 – Previous swing high
2.1500 – Intermediate resistance
2.1650 – Long-term bullish objective
Bearish Scenario (if 2.0700 is broken):
A daily close below 2.0700 would invalidate the current bullish structure. In such a case:
Next support lies at 2.0500
Deeper retracement could test 2.0400, potentially altering the medium-term outlook
Conclusion
The broader outlook for GBPAUD remains bullish, supported by trend continuation and consolidative price action. The 2.0700 level is key — a sustained hold above this level favors further upside toward the 2.1280–2.1650 range. However, a confirmed breakdown below 2.0700 would undermine the bullish case, opening the path for a corrective pullback toward the 2.0500–2.0400 support zone. Traders should watch for price confirmation around the 2.0700 level to assess directional conviction.
This communication is for informational purposes only and should not be viewed as any form of recommendation as to a particular course of action or as investment advice. It is not intended as an offer or solicitation for the purchase or sale of any financial instrument or as an official confirmation of any transaction. Opinions, estimates and assumptions expressed herein are made as of the date of this communication and are subject to change without notice. This communication has been prepared based upon information, including market prices, data and other information, believed to be reliable; however, Trade Nation does not warrant its completeness or accuracy. All market prices and market data contained in or attached to this communication are indicative and subject to change without notice.

AUDCAD: Bearish Forecast & Outlook
The analysis of the AUDCAD chart clearly shows us that the pair is finally about to tank due to the rising pressure from the sellers.
Disclosure: I am part of Trade Nation's Influencer program and receive a monthly fee for using their TradingView charts in my analysis.
❤️ Please, support our work with like & comment! ❤️

AUDJPY SHORT FORECAST Q2 W22 D29 Y25AUDJPY SHORT FORECAST Q2 W22 D29 Y25
😎CONFLUENCE IS KEY HERE!
Professional Risk Managers👋
Welcome back to another FRGNT chart update📈
Diving into some Forex setups using predominantly higher time frame order blocks alongside confirmation breaks of structure.
Let’s see what price action is telling us today! 👀
💡Here are some trade confluences📝
✅Weekly Order block rejection
✅15' Order block identification
✅4H 50EMA
✅Daily 50 EMA
🔑 Remember, to participate in trading comes always with a degree of risk, therefore as professional risk managers it remains vital that we stick to our risk management plan as well as our trading strategies.
📈The rest, we leave to the balance of probabilities.
💡Fail to plan. Plan to fail.
🏆It has always been that simple.
❤️Good luck with your trading journey, I shall see you at the very top.
🎯Trade consistent, FRGNT X

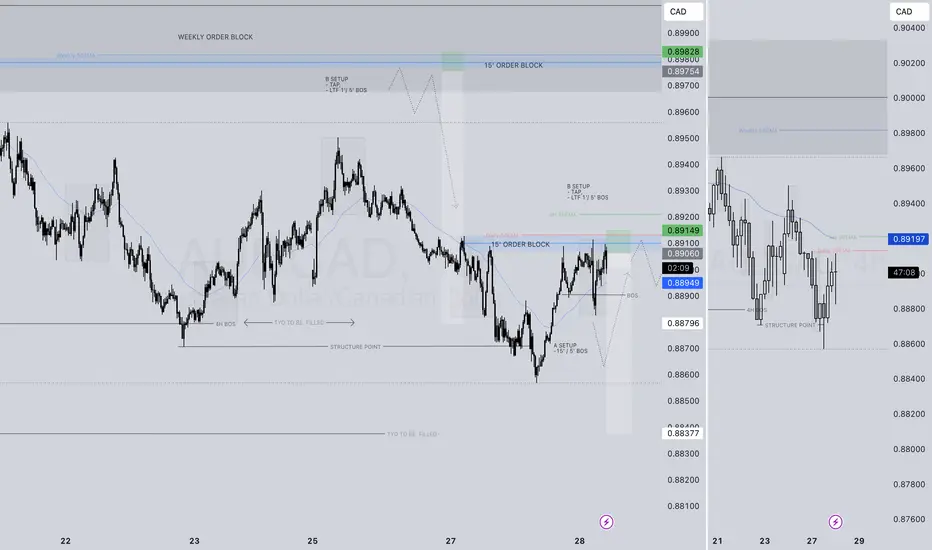
POI = LIQUIDITY AUDCAD SHORT FORECAST Q2 W22 D29 Y25
AUDCAD SHORT FORECAST Q2 W22 D29 Y25
POI = LIQUIDITY = Let's print money!
Professional Risk Managers👋
Welcome back to another FRGNT chart update📈
Diving into some Forex setups using predominantly higher time frame order blocks alongside intraday confirmation breaks of structure.
💡Here are some trade confluences📝
✅Weekly 50 EMA
✅Weekly order block rejection
✅Daily order block rejection
✅15’ order block identification
🔑 Remember, to participate in trading comes always with a degree of risk, therefore as professional risk managers it remains vital that we stick to our risk management plan as well as our trading strategies.
📈The rest, we leave to the balance of probabilities.
💡Fail to plan. Plan to fail.
🏆It has always been that simple.
❤️Good luck with your trading journey, I shall see you at the very top.
🎯Trade consistent, FRGNT X

From Breakdown to Breakout: AUD/JPY Flips Structure Above 92🟡 What happened recently?
At the beginning of April, AUD/JPY dropped to a low of 86, but by early May, the pair had surged over 600 pips, reclaiming the key 92 support level.
Most importantly, price reached a high of 95.50 — breaking well above the descending trendline that started back in July 2024.
📉 The recent pullback confirms the breakout
The drop from 95.50 wasn’t bearish — it was confirmation:
✅ Clear rejection from the 92 zone
✅ Former resistance now acting as strong support
✅ Market structure has shifted to bullish
📈 What’s next?
At the time of writing, AUD/JPY is trading around 92.76, and the structure suggests more upside ahead.
🧭 My strategy:
➡️ Buy dips toward 92.00
➡️ Target: 95.50 — the recent high
🚀 The breakout is confirmed, the trend has shifted, and the opportunity is clear.
Let the market do the work — we just need to stay aligned.
Disclosure: I am part of Trade Nation's Influencer program and receive a monthly fee for using their TradingView charts in my analyses and educational articles.

EURAUD - Technical analysisHello dear traders! Welcome to this trading idea...
First, we have a few trading options here.
1. We can open short right now, with a small target profit at the previous resistance level...
2. Wait until the price tests our resistance level and sell or buy only after that.
3. Shorting position after the price comes down, an uprising diagonal (green) line, and will break down our marked red line price marking level.
In this situation, what we are waiting for is a selling opportunity. SELL
But... If the pair becomes bullish, we may go long later.

Bullish rise?AUD/JPY is reacting off the pivot and could rise to the 1st resistance, which aligns with the 61.8% Fibonacci retracement.
Pivot: 92.87
1st Support: 92.06
1st Resistance: 94.07
Risk Warning:
Trading Forex and CFDs carries a high level of risk to your capital and you should only trade with money you can afford to lose. Trading Forex and CFDs may not be suitable for all investors, so please ensure that you fully understand the risks involved and seek independent advice if necessary.
Disclaimer:
The above opinions given constitute general market commentary, and do not constitute the opinion or advice of IC Markets or any form of personal or investment advice.
Any opinions, news, research, analyses, prices, other information, or links to third-party sites contained on this website are provided on an "as-is" basis, are intended only to be informative, is not an advice nor a recommendation, nor research, or a record of our trading prices, or an offer of, or solicitation for a transaction in any financial instrument and thus should not be treated as such. The information provided does not involve any specific investment objectives, financial situation and needs of any specific person who may receive it. Please be aware, that past performance is not a reliable indicator of future performance and/or results. Past Performance or Forward-looking scenarios based upon the reasonable beliefs of the third-party provider are not a guarantee of future performance. Actual results may differ materially from those anticipated in forward-looking or past performance statements. IC Markets makes no representation or warranty and assumes no liability as to the accuracy or completeness of the information provided, nor any loss arising from any investment based on a recommendation, forecast or any information supplied by any third-party.

Potential bearish drop?AUD/CAD is rising towards the pivot and could drop from this level to the 1st support.
Pivot: 0.89626
1st Support: 0.87895
1st Resistance: 0.90356
Risk Warning:
Trading Forex and CFDs carries a high level of risk to your capital and you should only trade with money you can afford to lose. Trading Forex and CFDs may not be suitable for all investors, so please ensure that you fully understand the risks involved and seek independent advice if necessary.
Disclaimer:
The above opinions given constitute general market commentary, and do not constitute the opinion or advice of IC Markets or any form of personal or investment advice.
Any opinions, news, research, analyses, prices, other information, or links to third-party sites contained on this website are provided on an "as-is" basis, are intended only to be informative, is not an advice nor a recommendation, nor research, or a record of our trading prices, or an offer of, or solicitation for a transaction in any financial instrument and thus should not be treated as such. The information provided does not involve any specific investment objectives, financial situation and needs of any specific person who may receive it. Please be aware, that past performance is not a reliable indicator of future performance and/or results. Past Performance or Forward-looking scenarios based upon the reasonable beliefs of the third-party provider are not a guarantee of future performance. Actual results may differ materially from those anticipated in forward-looking or past performance statements. IC Markets makes no representation or warranty and assumes no liability as to the accuracy or completeness of the information provided, nor any loss arising from any investment based on a recommendation, forecast or any information supplied by any third-party.

AUDJPY Short Setup – Fair Value Gap + 61.8% Precision Tap📊 AUDJPY | 1H Bearish Setup Breakdown (SMC Perspective)
This is a clean setup for sniper traders 🧠 — a perfect blend of FVG, Fib retracement, and a reaction from Smart Money zones. Let’s dig in:
🔻 1. Macro Context: Bearish Bias
Market structure is still bearish, with lower highs and lows
Price just completed a correction phase
We're seeing price react at a high probability distribution zone
🟪 2. Confluence Zones: FVG + Fib
📌 Fair Value Gap (FVG) – Price has just tapped into the FVG between 92.92 and 93.12
📌 61.8% Fib Level – Price perfectly aligns with golden pocket zone
📌 OB Above – Strong bearish order block lies around 93.60, with a Strong High marking retail’s target stop area
This stack of confluences makes this zone ripe for a short entry.
💣 3. Entry Logic
Entry was triggered after a clean tap into the FVG zone
Price shows signs of rejection with long upper wicks and slowing momentum
Ideal Smart Money scenario: Price mitigates FVG, avoids OB sweep (for now), and targets internal liquidity
🎯 4. Target Zone
TP = 91.651
Clean equal lows and imbalance just above
Channel midpoint & liquidity resting below
Matches 0% Fib level on the move
⚖️ 5. Trade Setup
📍 Entry: 92.926
🔐 Stop Loss: ~93.390 (above FVG + structural high)
🎯 Target: 91.651
🧮 Risk-to-Reward Ratio: ~1:4.5+
🧠 Smart Money Flow
Retail longs are eyeing a break above that “Strong High” — but Smart Money will likely:
Tap into FVG
Drive price down for a liquidity grab
Possibly retest or sweep OB after internal liquidity is cleared
💬 Drop “FVG ZONE SNIPED 🧨” if you took the entry
🧠 Save this post to study FVG + Fib reactions
👀 Tag your trading buddy who needs to level up their confluence game

AUD/CHF Breakout Alert: Bullish Setup from Descending Wedge!🔻 Pattern: Descending Wedge
📐 Formed by lower highs and higher lows.
🟡 Indicates price compression — often a bullish breakout setup!
🔼 Breakout direction expected: UP
🟦 Support Zone
📍 Located around 0.52614 – 0.53000
📉 Price bounced multiple times here — strong buying interest
🛡️ Acts as a demand zone
🟢 Entry Point
🎯 Entry range: 0.53000 – 0.53188
💥 Breakout candle appears ready to close outside the wedge
⚡ Momentum may be building for a push higher
🎯 Target Point
🔵 Target: 0.54450
📈 Near recent highs — aligns with pattern breakout projection
🎉 Aiming for a good profit zone
🔴 Stop Loss
❌ Stop loss: 0.52623
🛑 Below the wedge and support — protects from a false breakout
⚖️ Keeps risk-reward ratio attractive
📊 Indicator
🧭 EMA 70 (Red Line) at 0.53360
🔄 Price hovering near it — crossing above = bullish signal
📌 Trade Setup Summary
🔸 Pair: AUD/CHF
🔸 Timeframe: 4-Hour (4H)
🔸 Pattern: Descending Wedge
🔸 Bias: Bullish
🔸 Entry: 0.53000 – 0.53188
🔸 Target: 0.54450 🟢
🔸 Stop Loss: 0.52623 🔴
✅ Conclusion
🚀 If price breaks above the wedge and EMA, this could be a high-probability long trade.
📏 Tight stop, wide target = good risk/reward setup!

GBPAUD Is Bullish! Buy!
Please, check our technical outlook for GBPAUD.
Time Frame: 1D
Current Trend: Bullish
Sentiment: Oversold (based on 7-period RSI)
Forecast: Bullish
The price is testing a key support 2.096.
Current market trend & oversold RSI makes me think that buyers will push the price. I will anticipate a bullish movement at least to 2.155 level.
P.S
Please, note that an oversold/overbought condition can last for a long time, and therefore being oversold/overbought doesn't mean a price rally will come soon, or at all.
Disclosure: I am part of Trade Nation's Influencer program and receive a monthly fee for using their TradingView charts in my analysis.
Like and subscribe and comment my ideas if you enjoy them!

WICK INTO HTF 50 EMA AUDJPY SHORT FORECAST Q2 W22 D28 Y25
SHORT FORECAST Q2 W22 D28 Y25
😎🫡TAP INTO HTF 50 EMA BEFORE ROLLOVER SOUTH
Professional Risk Managers👋
Welcome back to another FRGNT chart update📈
Diving into some Forex setups using predominantly higher time frame order blocks alongside confirmation breaks of structure.
Let’s see what price action is telling us today! 👀
💡Here are some trade confluences📝
✅Weekly Order block rejection
✅15' Order block identification
✅4H 50EMA
✅Daily 50 EMA
🔑 Remember, to participate in trading comes always with a degree of risk, therefore as professional risk managers it remains vital that we stick to our risk management plan as well as our trading strategies.
📈The rest, we leave to the balance of probabilities.
💡Fail to plan. Plan to fail.
🏆It has always been that simple.
❤️Good luck with your trading journey, I shall see you at the very top.
🎯Trade consistent, FRGNT X

Bearish Outlook on AUD/JPY – Watching for Entry After Retrace!I'm currently focused on the AUD/JPY currency pair 📉.
We’re seeing a clear, sustained downtrend on the daily timeframe, marked by a recent break of market structure — a key sign that sellers are firmly in control 🐻.
At the moment, price appears overextended and is trading directly into a major liquidity pool — specifically, a cluster of sell-side liquidity sitting below previous lows 🧲.
I’m watching for a retracement or pullback into a zone of interest. If that happens, I’ll be on the lookout for a bearish break of structure on the lower timeframes to confirm a high-probability short setup 🎯.
As always, this is not financial advice, just a look at how I’m approaching the current price action ⚠️.

D & 4H 50 EMA HOLD? AUDCAD SHORT FORECAST Q2 W22 D28 Y25🔥DAILY & 4H 50 EMA POI HOLD SOUTH...
AUDCAD SHORT FORECAST Q2 W22 D28 Y25
Professional Risk Managers👋
Welcome back to another FRGNT chart update📈
Diving into some Forex setups using predominantly higher time frame order blocks alongside intraday confirmation breaks of structure.
💡Here are some trade confluences📝
✅Weekly 50 EMA
✅Weekly order block rejection
✅Daily order block rejection
✅15’ order block identification
🔑 Remember, to participate in trading comes always with a degree of risk, therefore as professional risk managers it remains vital that we stick to our risk management plan as well as our trading strategies.
📈The rest, we leave to the balance of probabilities.
💡Fail to plan. Plan to fail.
🏆It has always been that simple.
❤️Good luck with your trading journey, I shall see you at the very top.
🎯Trade consistent, FRGNT X
EUR_AUD WILL GO DOWN|SHORT|
✅EUR_AUD price grew again
To retest the resistance of 1.7640
But it is a strong key level
So I think that there is a high chance
That we will see a bearish move down
SHORT🔥
✅Like and subscribe to never miss a new idea!✅
Disclosure: I am part of Trade Nation's Influencer program and receive a monthly fee for using their TradingView charts in my analysis.

GBP_AUD PULLBACK AHEAD|SHORT|
b]✅GBP_AUD has retested
A resistance level of 2.1036
And we are seeing a bearish reaction
With the price going down so we are
Bearish biased now and we will be
Expecting the pair to go further down
SHORT🔥
✅Like and subscribe to never miss a new idea!✅
Disclosure: I am part of Trade Nation's Influencer program and receive a monthly fee for using their TradingView charts in my analysis.

EUR-AUD Short From Resistance! Sell!
Hello,Traders!
EUR-AUD made a retest
Of the key horizontal
Resistance level of 1.7640
From where we are already
Seeing a bearish pullback so
As we are locally bearish
Biased and we will be
Expecting a further
Bearish move down
Sell!
Comment and subscribe to help us grow!
Check out other forecasts below too!
Disclosure: I am part of Trade Nation's Influencer program and receive a monthly fee for using their TradingView charts in my analysis.

GBPAUD Wave Analysis: Is a Rally to 2.13677 on the Horizon?Hey Realistic Traders!
Can $OANDA: GBPAUD Keep the Bull Run Alive? Let’s Break It Down...
Trend Analysis
On the H4 timeframe, GBPAUD has broken out of a double bottom pattern, signaling a shift from a short-term bearish trend to a bullish one. Bullish momentum is further confirmed by price action trading above the EMA-200 line. On the higher timeframe, a falling wedge breakout pattern supports the bullish continuation scenario, aligning with the broader wave structure.
Wave Analysis
Applying Elliott Wave theory, the recent price action suggests the completion of Wave 2 around the 0.786 Fibonacci retracement level, aligning with the neckline breakout of the double bottom pattern. The potential formation of Wave 3, typically the strongest and most impulsive wave, targets 2.10265 as the first extension level with a further extension to 2.13677, calculated using Fibonacci extensions of the current bullish wave.
The outlook remains valid as long as the price stays above the key stop-loss level at 2.04774, invalidating the Wave 3 setup if breached.
Support the channel by engaging with the content, using the rocket button, and sharing your opinions in the comments below.
Disclaimer: "Please note that this analysis is solely for educational purposes and should not be considered a recommendation to take a long or short position on GBPAUD.

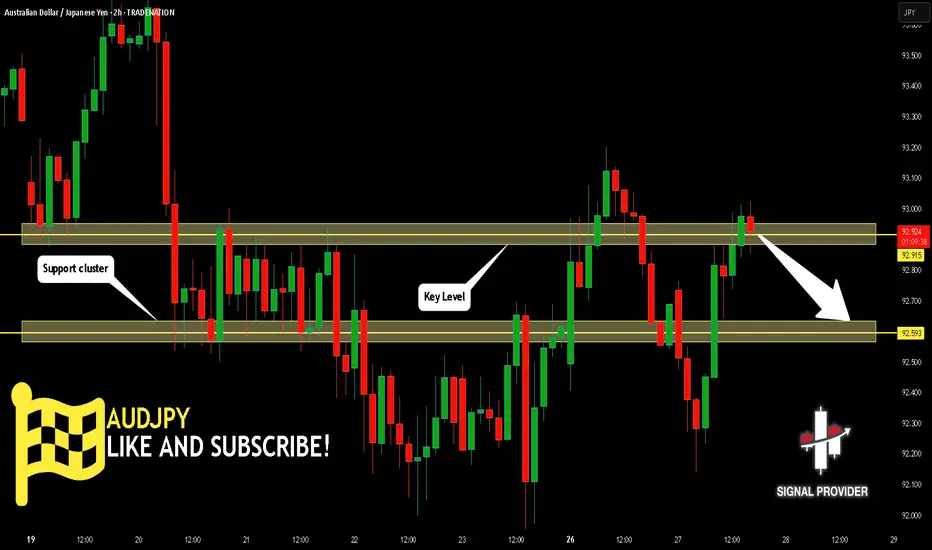
AUDJPY Will Go Lower From Resistance! Short!
Here is our detailed technical review for AUDJPY.
Time Frame: 2h
Current Trend: Bearish
Sentiment: Overbought (based on 7-period RSI)
Forecast: Bearish
The market is approaching a significant resistance area 92.915.
Due to the fact that we see a positive bearish reaction from the underlined area, I strongly believe that sellers will manage to push the price all the way down to 92.593 level.
P.S
Please, note that an oversold/overbought condition can last for a long time, and therefore being oversold/overbought doesn't mean a price rally will come soon, or at all.
Disclosure: I am part of Trade Nation's Influencer program and receive a monthly fee for using their TradingView charts in my analysis.
Like and subscribe and comment my ideas if you enjoy them!
AUDCAD The Target Is UP! BUY!
My dear friends,
Please, find my technical outlook for AUDCAD below:
The instrument tests an important psychological level 0.8873
Bias - Bullish
Technical Indicators: Supper Trend gives a precise Bullish signal, while Pivot Point HL predicts price changes and potential reversals in the market.
Target - 0.8918
Recommended Stop Loss - 0.8850
About Used Indicators:
Super-trend indicator is more useful in trending markets where there are clear uptrends and downtrends in price.
Disclosure: I am part of Trade Nation's Influencer program and receive a monthly fee for using their TradingView charts in my analysis.
———————————
WISH YOU ALL LUCK
