AUD_JPY BEARISH BIAS|SHORT|
✅AUD_JPY has retested a key resistance level of 96.000
And as the pair is already making a bearish pullback
A move down to retest the demand level below at 95.500 is likely
SHORT🔥
✅Like and subscribe to never miss a new idea!✅
AUD (Australian Dollar)

EURAUD Bullish Continuation Methodas you can see form my posts i have shared that lst Bullish Setip few days ago now what we are waiting is a contiuation to bullish side, when we look at 4W chart we can see that th prvious 4W candle was a bullish one and we are looking the next 4W candle to bullish and potetioally to raid the high of previous 4H high, so in 1-4H chart we are lookin bullish continuation and clearly what we are seeing now is Bullsuh continuation correction setup Lets just wait.

EURAUD Bullish untill 1.81I have been sharing EURAUD Analysis for the last few days, this second setup was shared now we are cruising and getting closer to our final TP 1.8100.

AUD/CAD BEARS ARE GAINING STRENGTH|SHORT
Hello, Friends!
AUD/CAD pair is trading in a local uptrend which we know by looking at the previous 1W candle which is green. On the 6H timeframe the pair is going up too. The pair is overbought because the price is close to the upper band of the BB indicator. So we are looking to sell the pair with the upper BB line acting as resistance. The next target is 0.891 area.
Disclosure: I am part of Trade Nation's Influencer program and receive a monthly fee for using their TradingView charts in my analysis.
✅LIKE AND COMMENT MY IDEAS✅

EurAud longIs big possibility that EurAud will drop around 50 pips from now that the price will blow up to liquidate ATH witch give us around 800 pip.
If reward worth the risk I should try to get that long swing 💪🙏
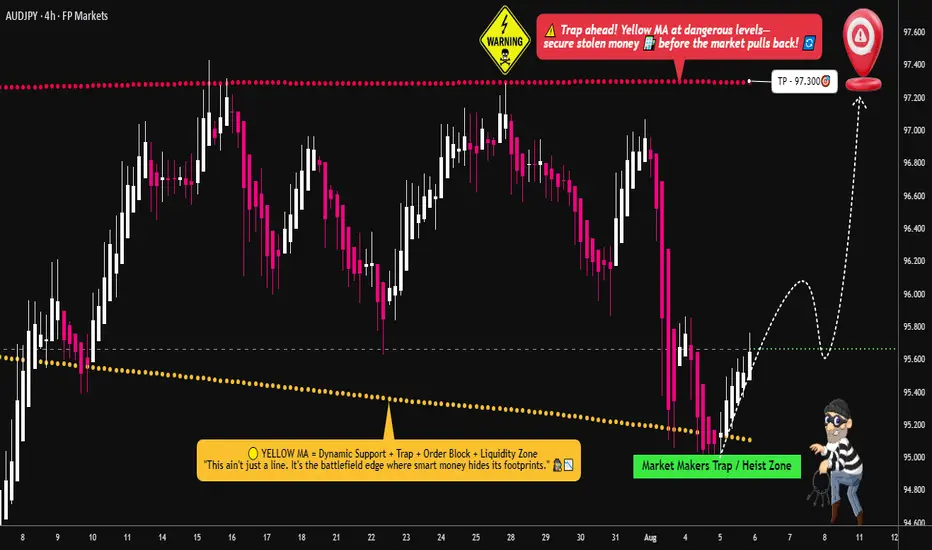
Cracking the Aussie-Yen Vault: Bullish Heist Setup in Progress🔓💸 AUD/JPY "Aussie vs Yen" Forex Bank Heist 💸🔓
🎯 Plan: Bullish Robbery | Targeting 97.300 | Stop Loss: 95.000
💰 Layered Entries | Precision Robbery | No Mercy
🚨🧠 Attention Robbers, Looters & Forex Mercenaries! 🧠🚨
The AUD/JPY vault is open, and Thief Trader is back with a multi-layer LIMIT ENTRY STRATEGY – stacking orders like cash in a briefcase. 💼💷💣
👀 We ain’t sniping one entry – we’re building an army of LIMITS. Every dip? A robbery opportunity.
💥 ENTRY: Any Price is a Good Price 💥
"Aussie Bull" on steroids – grab the loot on any pullback!
Set buy limits across key dips in liquidity pockets, swing zones, or even psychological levels.
Thief-style: Entries aren’t missed, they’re planned.
🛑 STOP LOSS: 95.000 🔐
Locked tight at the institutional panic zone – let them get triggered, we reload with confidence.
Built for multiple orders – size wisely, survive the fakeouts.
🎯 TARGET: 97.300 💸
Targeting the upper vault room, stacked with JPY weakness.
Ride the bullish getaway car all the way to the Tokyo vault rooftop.
🧠 Scalpers? Ride the trend. Swingers? Load your clip. Investors? Sit back and sip that profit. ☕💵
Use trailing SL to protect the bag as price moves in your favor.
🕵️♂️ THIEF TRADER SECRETS:
📊 Backed by technicals, macro juice, and liquidity-sniffing analysis.
🗞️ Don’t forget: News releases = volatility = sniper mode ON.
⚠️ MONEY HEIST PROTOCOL:
✅ Avoid entries during high-impact news 📉
✅ Use risk-adjusted sizing on your orders
✅ Be patient – layering needs discipline, not desperation
❤️🔥 Hit that 💥 BOOST BUTTON 💥 if you're with the Thief Squad!
Support the robbery. Respect the style. Make money like a true Market Outlaw.
🔔 Follow for the next HEIST PLAN. Big bags only. 💼💰🚀
“Markets don’t move randomly – they move for the ones who rob it correctly.” – Thief Trader
🤑📈🐂 #AUDJPY #ForexHeist #ThiefTrader #BankTheMarket #LayeredEntries #ForexTrading #RobTheMarket
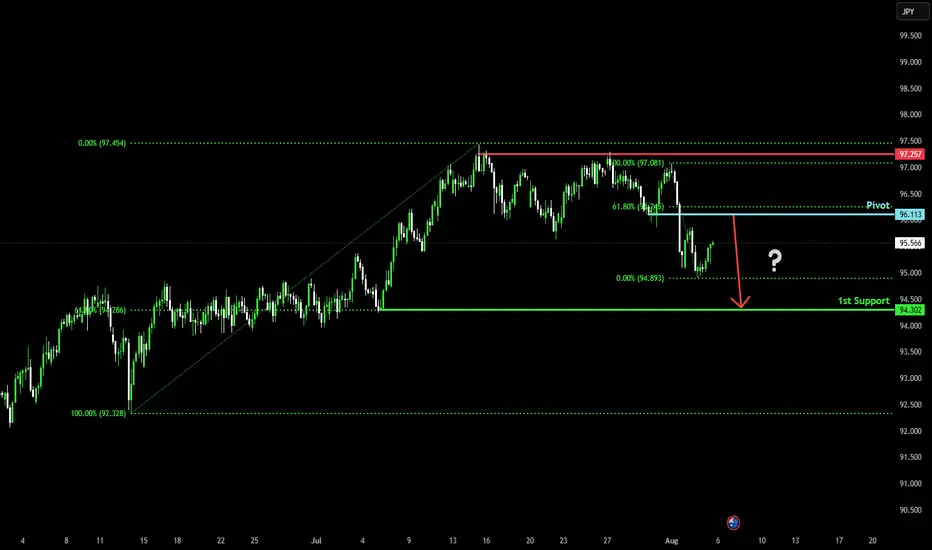
Bearish reversal off 61.8% Fibonacci resistance?AUD/JPY is rising towards the pivot which acts as a pullback resistance and could reverse to the 1st support, which aligns with the 61.8% Fibonacci retracement.
Pivot: 96.11
1st Support: 94.30
1st Resistance: 97.25
Risk Warning:
Trading Forex and CFDs carries a high level of risk to your capital and you should only trade with money you can afford to lose. Trading Forex and CFDs may not be suitable for all investors, so please ensure that you fully understand the risks involved and seek independent advice if necessary.
Disclaimer:
The above opinions given constitute general market commentary, and do not constitute the opinion or advice of IC Markets or any form of personal or investment advice.
Any opinions, news, research, analyses, prices, other information, or links to third-party sites contained on this website are provided on an "as-is" basis, are intended only to be informative, is not an advice nor a recommendation, nor research, or a record of our trading prices, or an offer of, or solicitation for a transaction in any financial instrument and thus should not be treated as such. The information provided does not involve any specific investment objectives, financial situation and needs of any specific person who may receive it. Please be aware, that past performance is not a reliable indicator of future performance and/or results. Past Performance or Forward-looking scenarios based upon the reasonable beliefs of the third-party provider are not a guarantee of future performance. Actual results may differ materially from those anticipated in forward-looking or past performance statements. IC Markets makes no representation or warranty and assumes no liability as to the accuracy or completeness of the information provided, nor any loss arising from any investment based on a recommendation, forecast or any information supplied by any third-party.
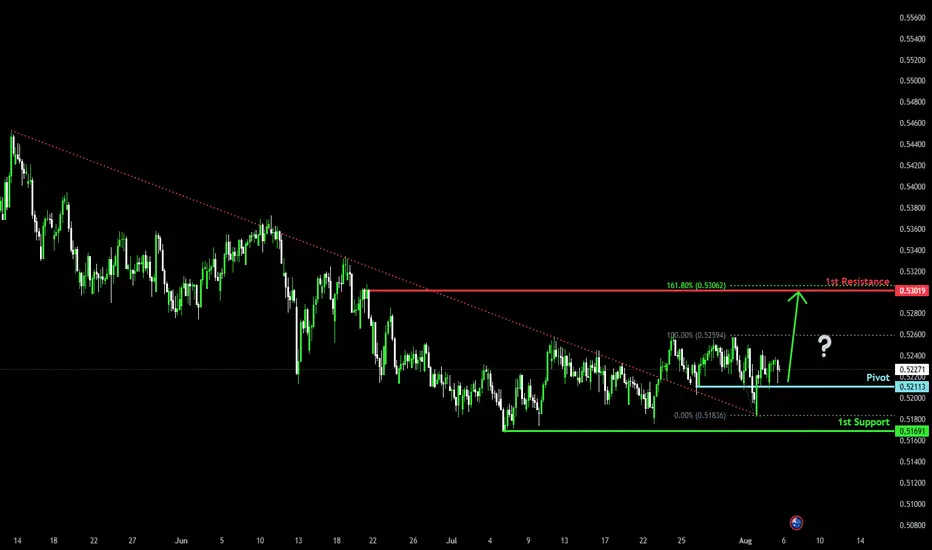
Bullish reversal?AUD/CHF is falling towards the pivot and could bounce to he 1st resistance which is a pullback resistance that lines up with the 161.8% Fibonacci extension.
Pivot: 0.52113
1st Support: 0.51691
1st Resistance: 0.53019
Risk Warning:
Trading Forex and CFDs carries a high level of risk to your capital and you should only trade with money you can afford to lose. Trading Forex and CFDs may not be suitable for all investors, so please ensure that you fully understand the risks involved and seek independent advice if necessary.
Disclaimer:
The above opinions given constitute general market commentary, and do not constitute the opinion or advice of IC Markets or any form of personal or investment advice.
Any opinions, news, research, analyses, prices, other information, or links to third-party sites contained on this website are provided on an "as-is" basis, are intended only to be informative, is not an advice nor a recommendation, nor research, or a record of our trading prices, or an offer of, or solicitation for a transaction in any financial instrument and thus should not be treated as such. The information provided does not involve any specific investment objectives, financial situation and needs of any specific person who may receive it. Please be aware, that past performance is not a reliable indicator of future performance and/or results. Past Performance or Forward-looking scenarios based upon the reasonable beliefs of the third-party provider are not a guarantee of future performance. Actual results may differ materially from those anticipated in forward-looking or past performance statements. IC Markets makes no representation or warranty and assumes no liability as to the accuracy or completeness of the information provided, nor any loss arising from any investment based on a recommendation, forecast or any information supplied by any third-party.
AUDUSD SWING THE SWING TRADES
Follow for more Simple And accurate swing analysis on Indices, Currency, Commodities.

AUDNZD: Expecting Bearish Continuation! Here is Why:
Looking at the chart of AUDNZD right now we are seeing some interesting price action on the lower timeframes. Thus a local move down seems to be quite likely.
Disclosure: I am part of Trade Nation's Influencer program and receive a monthly fee for using their TradingView charts in my analysis.
❤️ Please, support our work with like & comment! ❤️

EURAUD Resistance retest The EURAUD pair is currently trading with a bearish bias, aligned with the broader range-bound sideway consolidation. Recent price action shows a retest of the resistance, (previous rising support)
Key resistance is located at 1.7907, a prior consolidation zone. This level will be critical in determining the next directional move.
A bearish rejection from 1.7907 could confirm the resumption of the downtrend, targeting the next support levels at 1.7720, followed by 1.7680 and 1.7643 over a longer timeframe.
Conversely, a decisive breakout and daily close above 1.7907 would invalidate the current bearish setup, shifting sentiment to bullish and potentially triggering a move towards 1.7950, then 1.7986.
Conclusion:
The short-term outlook remains bearish unless the pair breaks and holds above 1.7907. Traders should watch for price action signals around this key level to confirm direction. A rejection favours fresh downside continuation, while a breakout signals a potential trend reversal or deeper correction.
This communication is for informational purposes only and should not be viewed as any form of recommendation as to a particular course of action or as investment advice. It is not intended as an offer or solicitation for the purchase or sale of any financial instrument or as an official confirmation of any transaction. Opinions, estimates and assumptions expressed herein are made as of the date of this communication and are subject to change without notice. This communication has been prepared based upon information, including market prices, data and other information, believed to be reliable; however, Trade Nation does not warrant its completeness or accuracy. All market prices and market data contained in or attached to this communication are indicative and subject to change without notice.

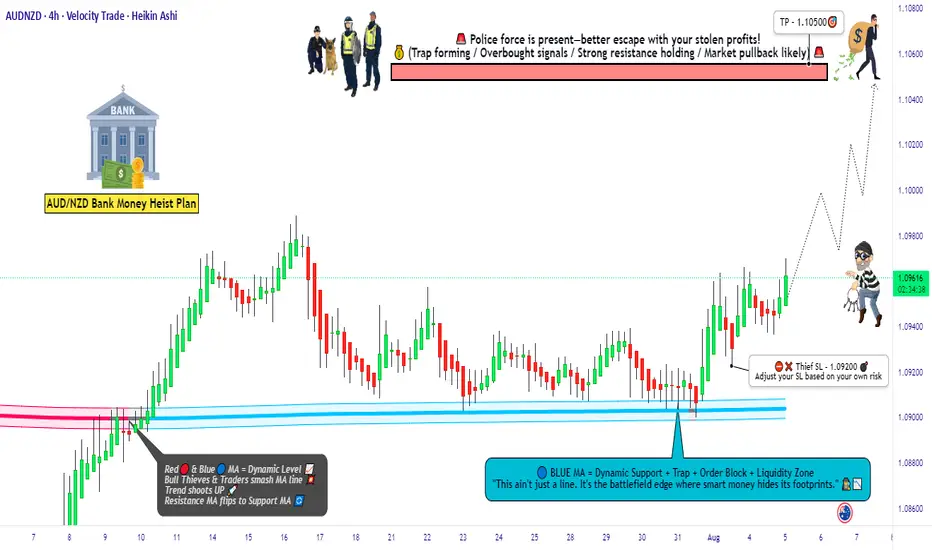
AUD/NZD Heist Loading... Will the Kiwi Surrender to the Aussie?🦘💵 AUD/NZD BULLISH LOOT RAID – THIEF TRADER ENTRY ACTIVE! 🔓🧠
🧭 Asset: AUD/NZD
📊 Plan: Bullish Heist in Progress
🎯 Entry: Thief dives in at any price – using layered limit orders to trap the perfect fill.
🛑 Stop Loss: 1.09200 – Emergency exit if alarms go off 🚨
💰 Target: 1.10500 – Vault full of pips awaiting collection! 💼💸
🕵️♂️ THIEF STRATEGY SNAPSHOT:
The Aussie is loading up the bags and the Kiwi’s guard is down 🐨🆚🥝.
This isn't just a trade—it’s a covert FX raid. Thief is stalking price silently, placing sneaky limit orders in layers—waiting for the market to slip up.
🚪 No fixed door in—every pullback is a crack in the vault.
⚔️ Patience is the blade—entries are stealthy, exits are explosive.
🧠 Using both market structure + sentiment, we sniff out the liquidity stash!
💡 TRADE TIPS FROM THE THIEF'S VAULT:
📉 Layer entries across minor dips (M15-H1 zones) – never chase.
🏃♂️ Price nearing reversal zones? Use tight stops and trail profits like a pro.
📰 Avoid entries during red news – get in before the crowd, not with them.
🧭 This pair respects structure. Don't fight momentum—ride it like a bandit horse.
🔔 THIEF CODE: “We don’t predict—we prepare.”
🎯 Lock in, layer deep, loot fast.
💬 Drop your setup thoughts below 💣
❤️ Like this? Smash that 👍 and join the thief crew!
📌 Save this plan & follow for more stealth market raids.
🕶️ Stay sharp. Stay hidden. Stay profitable.
💼 Next vault breach loading... 👇
📍#ThiefTrader #AUDNZD #LayeredLootPlan #ForexHeist #MarketRaiders
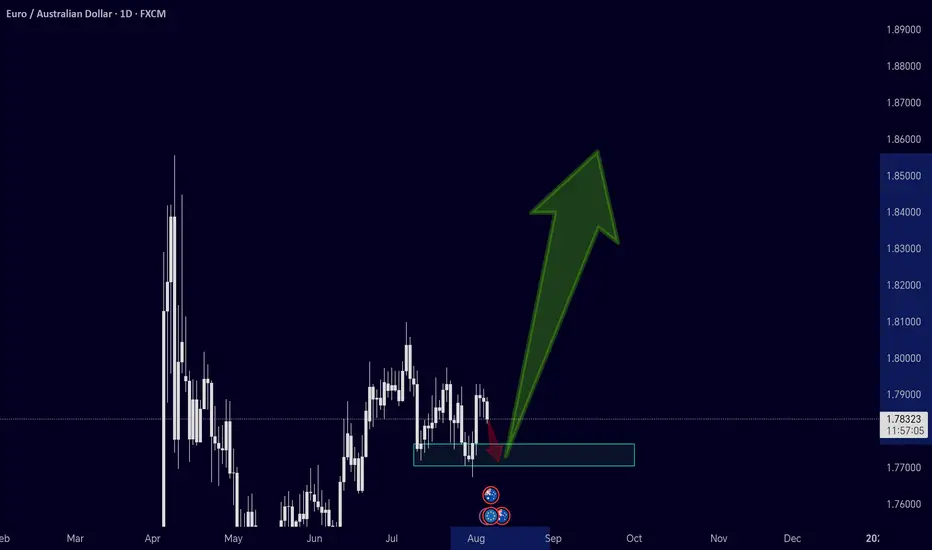
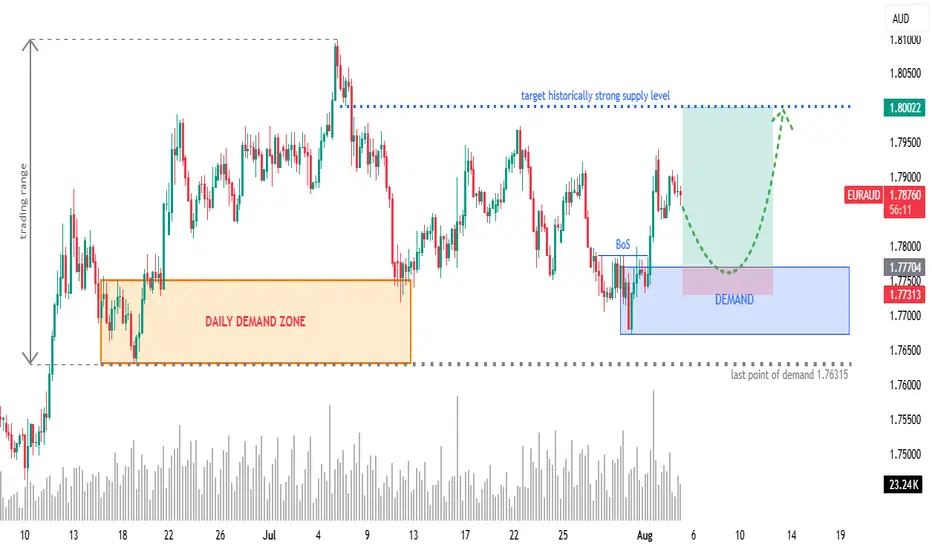
EURAUD 4H: Long Setup from Fresh Demand ZoneOverview:
OANDA:EURAUD retracing into a newly formed 4H demand zone after a bullish Break of Structure (BoS). Eyes on continuation towards a historically significant supply zone at 1.8000.
🧩 Setup Details
• Asset & Timeframe: EURAUD, 4H
• Bias: Bullish
• Entry Zone: 1.77300 – 1.77700 (DEMAND area)
• Targets:
🎯 T1 = 1.7900 (minor reaction level)
🎯 T2 = 1.8000 (historical supply level)
• Stop-Loss: Below 1.77300 (last valid demand)
• Risk-Reward: Approx. 1:6+
🧠 Why Now? (Trade Rationale)
• ✅ Fresh 4H Demand Zone: Price is retracing into a clear demand zone after rejecting lower prices.
• ✅ Break of Structure (BoS): Bullish BoS confirms shift in order flow.
• ✅ Volume Confirmation: Increasing demand near current price levels.
• ✅ Clear Liquidity Sweep: Price likely swept short-term lows before BoS.
• ✅ Target Supply Zone: 1.8000 is a well-respected historical supply/resistance level — clean magnet for price.
⏱ Multi-Timeframe Context
• Daily Chart: Price is reacting off a larger DAILY DEMAND ZONE. Trend bias is bullish.
• 4H Chart: Structure break + demand formation suggest continuation.
• 1H/Entry Level: Monitor price action in the blue zone for lower-timeframe confirmation (e.g. bullish engulfing, flip zones, LQ sweep, etc.) and potentially greater risk-reward.
📉 Risk Management & Duration
• Stop below 1.76315 keeps you protected from deeper invalidation.
• Trade Duration: Short to mid-term (1–4 days).
• Position Size: Scale based on volatility; ideal for swing trade conditions.
📌 Trade Plan Summary
📍 Watch for bullish PA on re-entry into demand (1.77300–1.77700)
📍 Set SL below 1.76315
📍 TP1 at 1.79000 — partials advised
📍 TP2 at 1.80000 — strong historical level
📍 Adjust SL to BE on momentum breakout
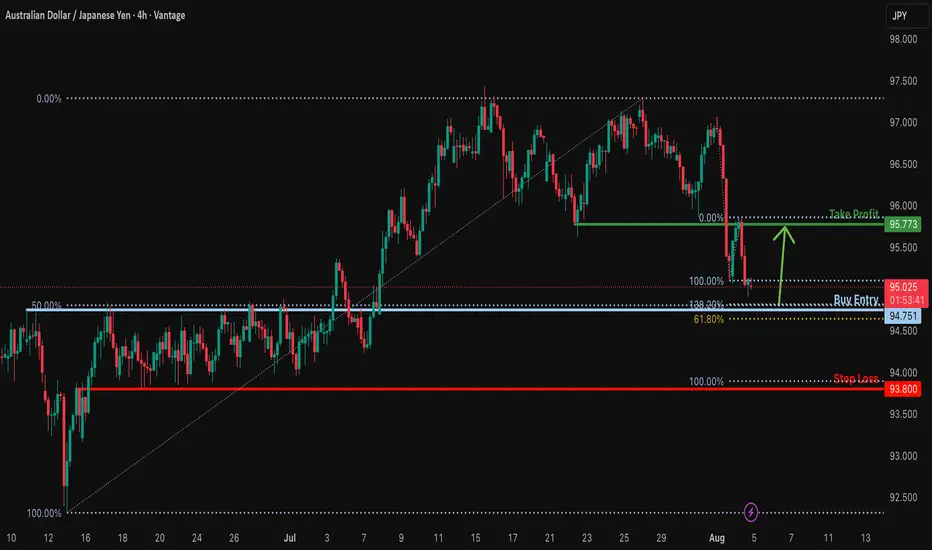
Bullish reversal off Fibonacci confluence?AUD/JPY is falling towards a support level, which is a pullback support aligning with the 138.2% Fibonacci extension, the 50% Fibonacci retracement, and the 61.8% Fibonacci projection. A bounce from this level could push the price toward our take-profit target.
Entry: 94.75
Why we like it:
There is a pullback support level that aligns with the 50% Fibonacci retracement, the 138.2% Fibonacci extension and the 61.8% Fibonacci projection.
Stop loss: 93.80
Why we like it:
There is a pullback support that lines up witht he 100% Fibonacci projection.
Takeprofit: 95.77
Why we like it:
There is an overlap resistance.
Enjoying your TradingView experience? Review us!
Please be advised that the information presented on TradingView is provided to Vantage (‘Vantage Global Limited’, ‘we’) by a third-party provider (‘Everest Fortune Group’). Please be reminded that you are solely responsible for the trading decisions on your account. There is a very high degree of risk involved in trading. Any information and/or content is intended entirely for research, educational and informational purposes only and does not constitute investment or consultation advice or investment strategy. The information is not tailored to the investment needs of any specific person and therefore does not involve a consideration of any of the investment objectives, financial situation or needs of any viewer that may receive it. Kindly also note that past performance is not a reliable indicator of future results. Actual results may differ materially from those anticipated in forward-looking or past performance statements. We assume no liability as to the accuracy or completeness of any of the information and/or content provided herein and the Company cannot be held responsible for any omission, mistake nor for any loss or damage including without limitation to any loss of profit which may arise from reliance on any information supplied by Everest Fortune Group.
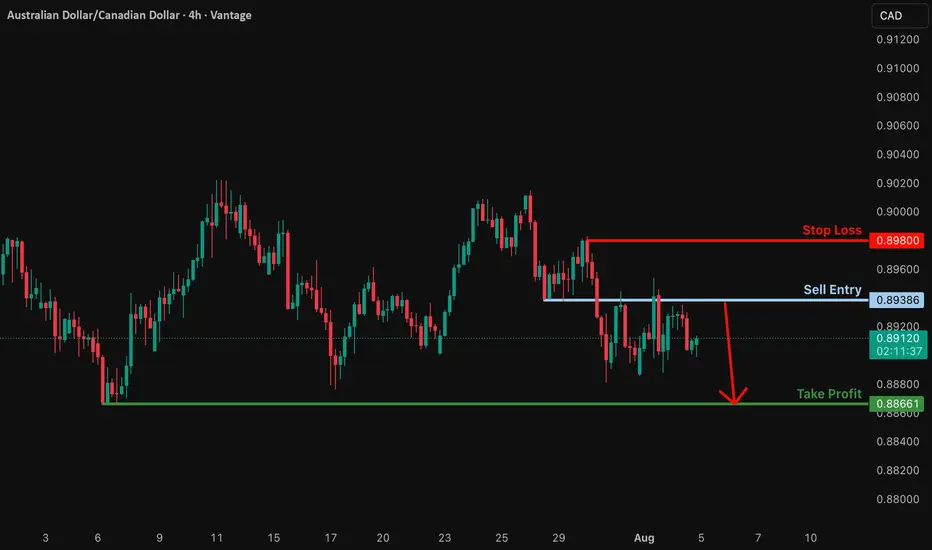
Bearish drop?AUD/CAD has rejected off the resistance level whihc is a pullback resistance and could drop from this level to our take profit.
Entry: 0.89386
Why we like it:
There is a pullback resistance.
Stop loss: 0.89800
Why we like it:
There is a pullback resistance.
Take profit: 0.88661
Why we like it:
There is a swing low support.
Enjoying your TradingView experience? Review us!
Please be advised that the information presented on TradingView is provided to Vantage (‘Vantage Global Limited’, ‘we’) by a third-party provider (‘Everest Fortune Group’). Please be reminded that you are solely responsible for the trading decisions on your account. There is a very high degree of risk involved in trading. Any information and/or content is intended entirely for research, educational and informational purposes only and does not constitute investment or consultation advice or investment strategy. The information is not tailored to the investment needs of any specific person and therefore does not involve a consideration of any of the investment objectives, financial situation or needs of any viewer that may receive it. Kindly also note that past performance is not a reliable indicator of future results. Actual results may differ materially from those anticipated in forward-looking or past performance statements. We assume no liability as to the accuracy or completeness of any of the information and/or content provided herein and the Company cannot be held responsible for any omission, mistake nor for any loss or damage including without limitation to any loss of profit which may arise from reliance on any information supplied by Everest Fortune Group.
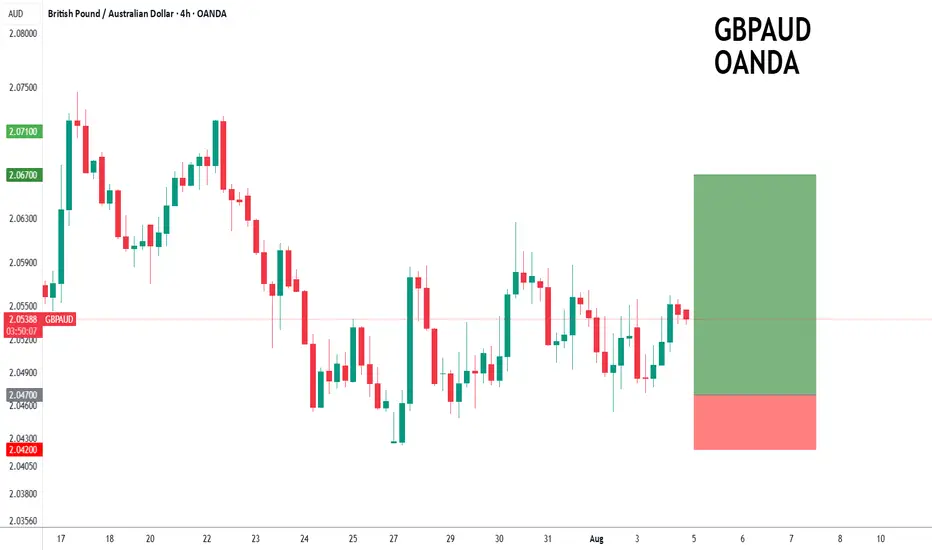
GBPAUD forming a bottom?GBPAUD - 24h expiry
The primary trend remains bullish.
Price action looks to be forming a bottom.
We look for a temporary move lower.
Preferred trade is to buy on dips.
Bespoke support is located at 2.0470.
We look to Buy at 2.0470 (stop at 2.0420)
Our profit targets will be 2.0670 and 2.0700
Resistance: 2.0600 / 2.0670 / 2.0700
Support: 2.0450 / 2.0420 / 2.0390
Risk Disclaimer
The trade ideas beyond this page are for informational purposes only and do not constitute investment advice or a solicitation to trade. This information is provided by Signal Centre, a third-party unaffiliated with OANDA, and is intended for general circulation only. OANDA does not guarantee the accuracy of this information and assumes no responsibilities for the information provided by the third party. The information does not take into account the specific investment objectives, financial situation, or particular needs of any particular person. You should take into account your specific investment objectives, financial situation, and particular needs before making a commitment to trade, including seeking, under a separate engagement, as you deem fit.
You accept that you assume all risks in independently viewing the contents and selecting a chosen strategy.
Where the research is distributed in Singapore to a person who is not an Accredited Investor, Expert Investor or an Institutional Investor, Oanda Asia Pacific Pte Ltd (“OAP“) accepts legal responsibility for the contents of the report to such persons only to the extent required by law. Singapore customers should contact OAP at 6579 8289 for matters arising from, or in connection with, the information/research distributed.
AUDJPY; Heikin Ashi Trade Idea📈 Hey Traders!
Here’s a fresh outlook from my trading desk. If you’ve been following me for a while, you already know my approach:
🧩 I trade Supply & Demand zones using Heikin Ashi chart on the 4H timeframe.
🧠 I keep it mechanical and clean — no messy charts, no guessing games.
❌ No trendlines, no fixed sessions, no patterns, no indicator overload.
❌ No overanalyzing market structure or imbalances.
❌ No scalping, and no need to be glued to the screen.
✅ I trade exclusively with limit orders, so it’s more of a set-and-forget style.
✅ This means more freedom, less screen time, and a focus on quality setups.
✅ Just a simplified, structured plan and a calm mindset.
💬 Let’s Talk:
💡Do you trade supply & demand too ?
💡What’s your go-to timeframe ?
💡Ever tried Heikin Ashi ?
📩 Got questions about my strategy or setup? Drop them below — ask me anything, I’m here to share.
Let’s grow together and keep it simple. 👊

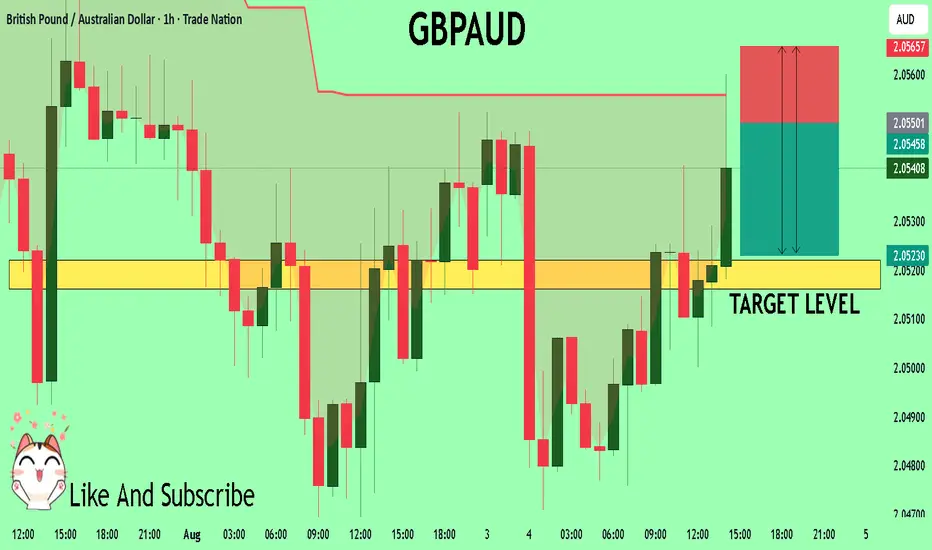
GBPAUD Technical Analysis! SELL!
My dear friends,
Please, find my technical outlook for GBPAUD below:
The instrument tests an important psychological level 2.0550
Bias - Bearish
Technical Indicators: Supper Trend gives a precise Bearish signal, while Pivot Point HL predicts price changes and potential reversals in the market.
Target - 2.0522
Recommended Stop Loss - 2.0565
About Used Indicators:
Super-trend indicator is more useful in trending markets where there are clear uptrends and downtrends in price.
Disclosure: I am part of Trade Nation's Influencer program and receive a monthly fee for using their TradingView charts in my analysis.
———————————
WISH YOU ALL LUCK
GBPAUD - COULD BE A GOOD SELL TRADEHey Traders!
I believe GBPAUD could have a strong bearish push towards the downside, since the institutional data suggest that GBP is weakening, while AUD orders are slightly increasing, looking at the 4 hour trends it seems it stay on a bearish path, however just recently it broke out the weekly pivot point, which could signal a breakout so consider risking less, overall daily timeframe is also bearish, there are also a number of chart patterns on the daily timeframe suggesting sell bias as well.
Some issues with this trade is the major pairs gbpusd especially has broken upwards past the weekly pivot showing signs of bullish pressure, so we could see a push of gbp before a exhaustion back down.
I suggest taking partial profits along the way.

AUDJPY Will Go Lower! Sell!
Take a look at our analysis for AUDJPY.
Time Frame: 9h
Current Trend: Bearish
Sentiment: Overbought (based on 7-period RSI)
Forecast: Bearish
The price is testing a key resistance 96.734.
Taking into consideration the current market trend & overbought RSI, chances will be high to see a bearish movement to the downside at least to 96.102 level.
P.S
Overbought describes a period of time where there has been a significant and consistent upward move in price over a period of time without much pullback.
Disclosure: I am part of Trade Nation's Influencer program and receive a monthly fee for using their TradingView charts in my analysis.
Like and subscribe and comment my ideas if you enjoy them!

GBP/AUD SELLERS WILL DOMINATE THE MARKET|SHORT
Hello, Friends!
GBP-AUD uptrend evident from the last 1W green candle makes short trades more risky, but the current set-up targeting 2.049 area still presents a good opportunity for us to sell the pair because the resistance line is nearby and the BB upper band is close which indicates the overbought state of the GBP/AUD pair.
Disclosure: I am part of Trade Nation's Influencer program and receive a monthly fee for using their TradingView charts in my analysis.
✅LIKE AND COMMENT MY IDEAS✅

One Sweet Bullish Candle Above 50EMA… and I’m All Yours, 1.7940I’ve got a lovely 1H bullish range from 1.7733 to 1.7940 — pure potential.
Market gave me a 100-pip pullback/retracement from 1.7940 to 1.7840 — just a little mood swing. 😒
Now I’m patiently stalking...
If a bullish candle closes above my 50EMA,
I’m not thinking twice — I’m riding the bull! 🐂💥
SL? Depends on the candle’s vibe:
If it’s a strong Marubozu, I’ll trust it like a loyal partner — SL goes just below it.
TP? Straight to 1.7940 — no detours, no drama. 🎯
Wish me luck… and a Marubozu with commitment issues! 😂📉📈

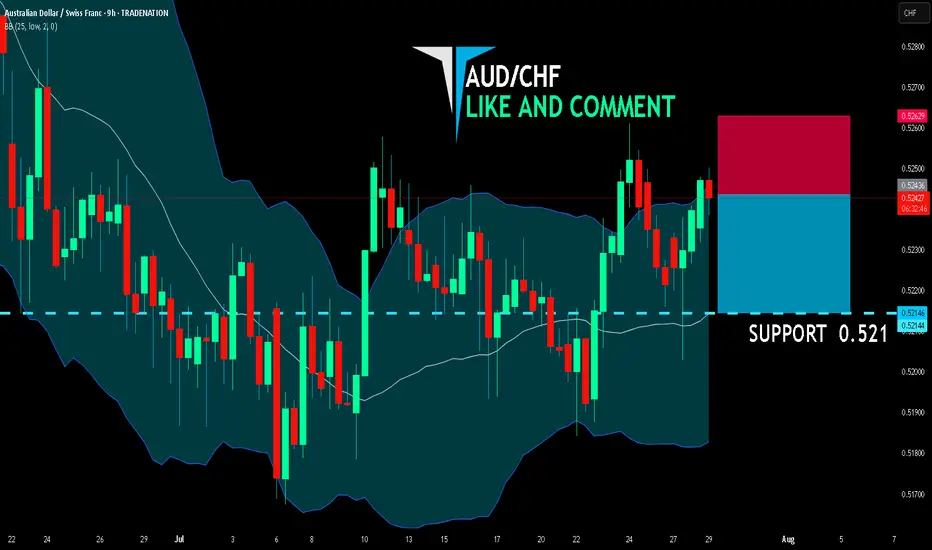
AUD/CHF BEARS ARE STRONG HERE|SHORT
AUD/CHF SIGNAL
Trade Direction: short
Entry Level: 0.524
Target Level: 0.521
Stop Loss: 0.526
RISK PROFILE
Risk level: medium
Suggested risk: 1%
Timeframe: 9h
Disclosure: I am part of Trade Nation's Influencer program and receive a monthly fee for using their TradingView charts in my analysis.
✅LIKE AND COMMENT MY IDEAS✅