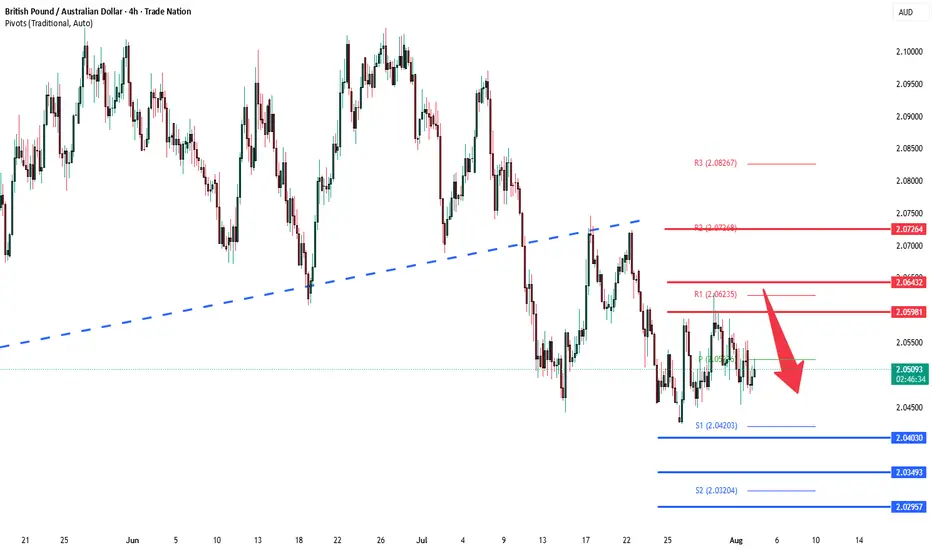
GBPAUD sideways consolidation capped at 2.0600The GBPAUD pair is currently trading with a bearish bias, aligned with the broader downward trend. Recent price action shows a retest of the resistance, suggesting a temporary relief rally within the downtrend.
Key resistance is located at 2.0600, a prior consolidation zone. This level will be critical in determining the next directional move.
A bearish rejection from 2.0600 could confirm the resumption of the downtrend, targeting the next support levels at 2.0400, followed by 2.0350 and 2.0290 over a longer timeframe.
Conversely, a decisive breakout and daily close above 2.0600 would invalidate the current bearish setup, shifting sentiment to bullish and potentially triggering a move towards 2.0645, then 2.0730.
Conclusion:
The short-term outlook remains bearish unless the pair breaks and holds above 2.0600. Traders should watch for price action signals around this key level to confirm direction. A rejection favours fresh downside continuation, while a breakout signals a potential trend reversal or deeper correction.
This communication is for informational purposes only and should not be viewed as any form of recommendation as to a particular course of action or as investment advice. It is not intended as an offer or solicitation for the purchase or sale of any financial instrument or as an official confirmation of any transaction. Opinions, estimates and assumptions expressed herein are made as of the date of this communication and are subject to change without notice. This communication has been prepared based upon information, including market prices, data and other information, believed to be reliable; however, Trade Nation does not warrant its completeness or accuracy. All market prices and market data contained in or attached to this communication are indicative and subject to change without notice.
AUD (Australian Dollar)

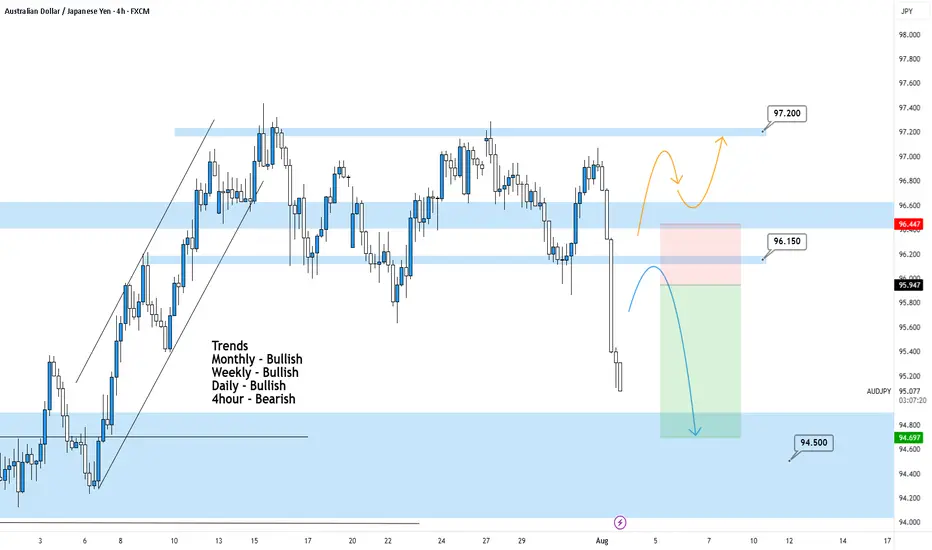
AUDJPY 4Hour TF - August 3rd,2025🟦 AUDJPY 4H Analysis Bearish Idea
📅 August 3rd, 2025
🔹 Top-Down Trend Bias:
• Monthly – Bullish
• Weekly – Bullish
• Daily – Bullish
• 4H – Bearish
AUDJPY has broken cleanly below prior structure around 96.15, signaling short term bearish momentum within a higher timeframe bullish environment. Price is currently approaching key decision zones.
🔍 Key Zone: 96.15 – 96.45
This former support zone may now act as a bearish retest area and new resistance. This offers a potential entry for continuation plays if structure holds below.
✅ Scenario A: Bearish Continuation (Blue Path)
1.If price retests and rejects from 96.15–96.45
2.Look for bearish confirmation (rejection wicks, engulfing, LTF structure shift)
Target: 94.50
This setup is trend aligned with current 4H momentum and offers a clean structure based downside.
⚠️ Scenario B: Bullish Reclaim (Orange Path)
1.If price breaks and holds above 96.45
2.Could signal a shift back toward higher timeframe bullish continuation
Target: 97.20 resistance zone
This is a counter-trend idea on the 4H and requires confirmation
🧠 Final Notes
• Short-term bearish bias while price remains below 96.45
• Let the retest confirm the direction
• Clean structure = clean setups
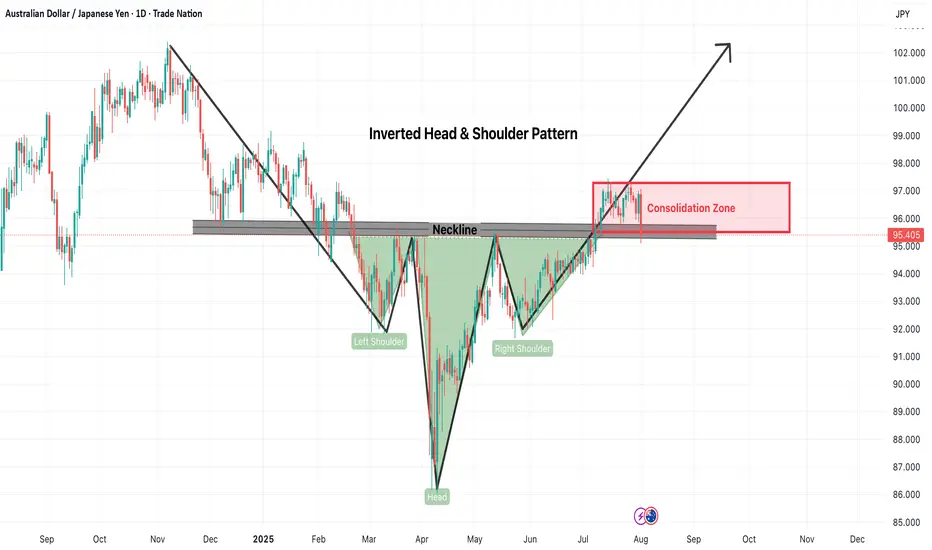
AUDJPY-Inverted Head & Shoulders Pattern at Reversal levelThe AUDJPY pair has formed a classic Inverted Head and Shoulders pattern, typically a strong bullish reversal signal. As seen on the daily chart, the left shoulder, head, and right shoulder have all developed with a clearly defined neckline near the 95.80–96.00 zone. Price action recently broke above this neckline but has since entered a consolidation phase between 95.00–97.00.
Bullish Scenario (Breakout Confirmation)
If AUDJPY decisively breaks above the 97.00 resistance with strong bullish momentum and volume, the inverted head and shoulders pattern will be fully confirmed. In this case, traders can expect an upward continuation toward:
Short-term Target: 99.00
Medium-term Target: 101.00
Measured Move Target: ~102.00 based on pattern height
Risk:
False breakout followed by quick pullback under neckline
Sudden JPY strength due to geopolitical or fundamental news
AUD weakness due to interest rate decisions or economic data
Sideways/Neutral Scenario (Extended Consolidation)
Another possibility is that AUDJPY continues to range between 95.00–97.00 for an extended period without a decisive breakout. This may happen if the market awaits more macroeconomic cues or central bank guidance.
Risk:
Whipsaws and fakeouts within the range
Frustration due to lack of clear direction
Risk Management Tips:
Wait for confirmation: Only trade post breakout or breakdown with candle close above 97.00 or below 95.00
Use tight stop-loss: Keep stops just below support or above resistance zones
Position sizing: Avoid overleveraging in rangebound conditions
Diversify exposure: Don’t put all capital into one trade setup
Conclusion:
AUDJPY is at a critical decision point. The inverted head and shoulders structure is bullish in nature, but the current consolidation adds uncertainty. Traders should stay alert for either a breakout for trend continuation or a breakdown invalidating the setup. Use proper risk management in all cases.
=================================================================
Disclosure: I am part of Trade Nation's Influencer program and receive a monthly fee for using their TradingView charts in my analysis.
=================================================================
EURAUD Short From Resistance!
HI,Traders !
#EURAUD keeps growing
In an uptrend but the pair
Will soon hit a horizontal
Resistance of 1.79647 from
Where we will be expecting
A local bearish pullback
And a further move down !
Comment and subscribe to help us grow !

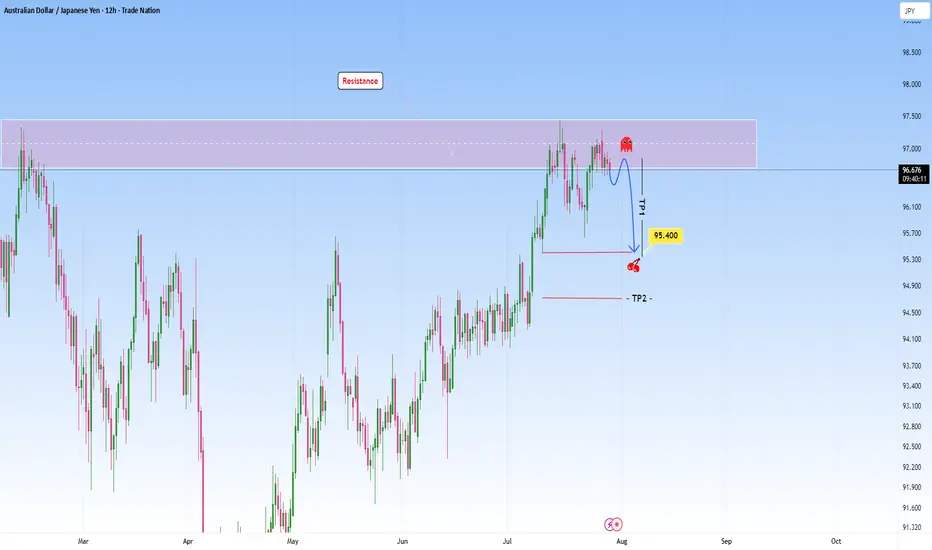
AUDJPY at Resistance: Could we see a reversal here?The market on this pair shows us a classic scenario where price presses into a resistance zone after a sustained bullish move. Price action approaching this zone appears hesitant, with smaller candles and wicks showing signs of exhaustion, meaning the possibility that buying momentum is weakening. There is a clear intention in this structure and I am anticipating a reversal here.
My first target (TP1) at 95.400 is placed just above a previous structure low and it’s a logical level for a partial exit, as price may pause or react there. The second target (TP2), placed even lower, hints at a full mean reversion idea targeting the origin of the previous bullish leg.
The setup requires patience, waiting for confirmation perhaps in the form of a strong bearish rejection before committing to the short. Overall, it’s a disciplined setup that mirrors the kind of analysis I like to gravitate toward: structured, simple and driven by high probability reversal zones.
Disclosure: I am part of Trade Nation's Influencer program and receive a monthly fee for using their TradingView charts in my analysis.
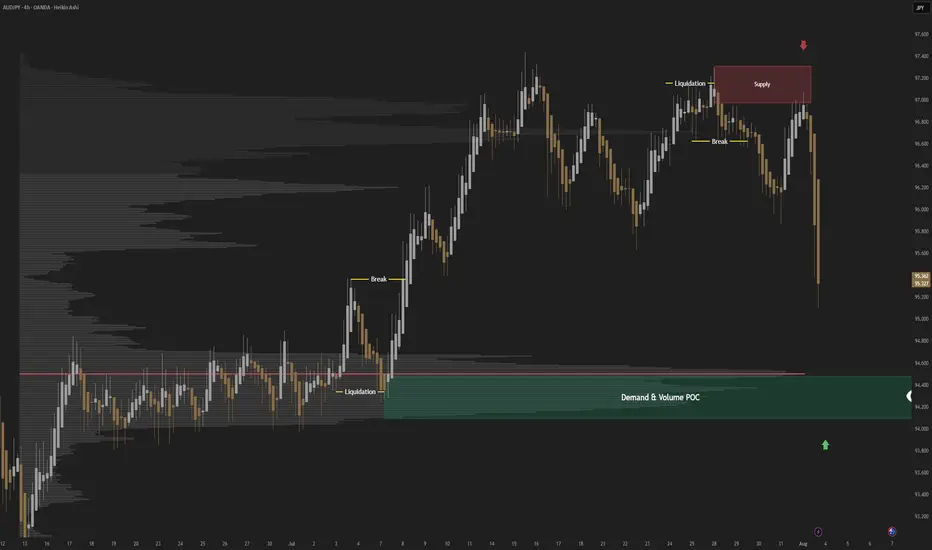
AUDJPY; Heikin Ashi Trade IdeaIn this post, I’ll be sharing my analysis of AUDJPY with my unique Heikin Ashi strategy.Picture tells more than 1000 words, no BS. I highlight key areas where I’m anticipating potential opportunities.
I’m always happy to receive any feedback.
Like, share and comment! ❤️
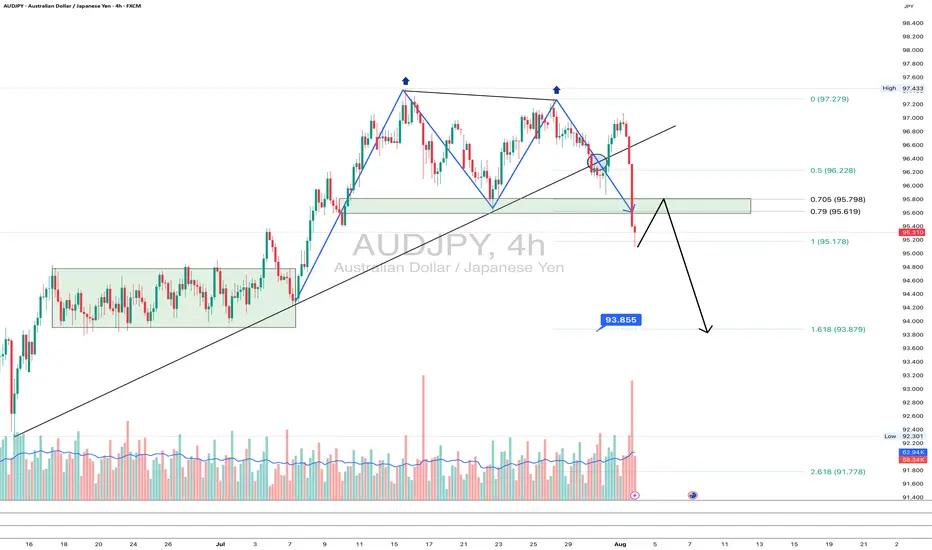
AUDJPY: goodbye uptrend?On the 4H chart, AUDJPY has printed a textbook double top pattern, breaking the rising trendline and diving below the 95.6–95.78 support zone - now acting as resistance. The pair is currently retesting this zone from below, which often provides a clean re-entry point for bears.
This area also aligns with the 0.705–0.79 Fibonacci retracement, reinforcing it as a key resistance. If the price rejects this zone, the next target is 93.85 (1.618 Fibo projection), followed by 93.25 and potentially 91.71 if momentum strengthens.
Fundamentally, the yen gains strength on risk-off flows and diverging rate expectations, while the Australian dollar is pressured by falling commodity prices and a likely pause from the RBA. This widens the rate differential and weakens AUD.
As long as price remains below 95.78, sellers are in control. Watch for a rejection from this retest zone.
EURAUD Ready to Bounce? Key Support & Fundamentals Aligned!Today I want to share a Long position idea on EURAUD ( OANDA:EURAUD ) with you.
From a fundamental perspective , both the Euro (EUR) and Australian Dollar (AUD) are currently under pressure. However, the Aussie appears fundamentally weaker in the short term, making the EURAUD Long setup more favorable at this stage.
AUD Weakness :
The Reserve Bank of Australia (RBA) has held rates steady at 3.85%, but recent inflation data has dropped to 2.7%, the lowest in over 3 years.
Most economists now expect the RBA to cut rates in its next meeting in August, possibly by 25 basis points.
Slowing economic growth and dovish forward guidance from the central bank are weighing heavily on AUD sentiment.
EUR Outlook :
The European Central Bank (ECB) is also facing weak economic data, but is taking a more cautious approach toward cutting rates.
Despite softer PMIs and sluggish growth in countries like Germany and France, the ECB has not confirmed a near-term rate cut, keeping EUR relatively stable.
This divergence between the RBA’s dovish stance and the ECB’s pause is supportive of EUR strength against AUD.
Summary :
With the RBA likely to ease policy soon and the ECB holding ground for now, the interest rate differential favors EURAUD upside. Fundamentals point toward further weakness in AUD, making the EURAUD Long a strategically sound trade idea for the coming days.
-------------------------------------------
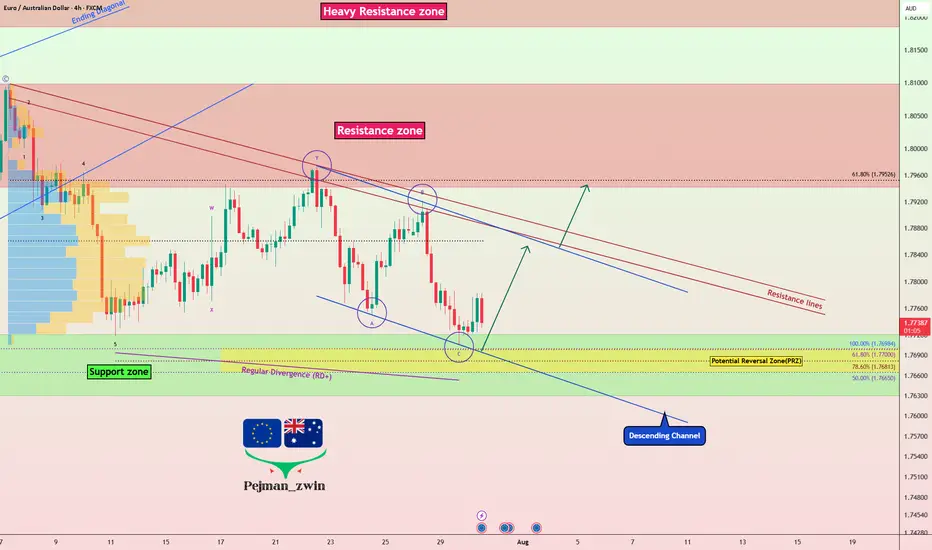
Now let's analyze the conditions of the EURAUD chart on the 4-hour time frame .
EURAUD is currently trading near the Support zone(1.772 AUD-1.763 AUD) , Potential Reversal Zone(PRZ) , and near the lower line of the descending channel .
According to Elliott Wave theory , EURAUD appears to have completed a Zigzag Correction(ABC/5-3-5) .
Also, we can see the Regular Divergence(RD+) between Consecutive Valleys .
I expect EURAUD to rise to at least 1.784 AUD .
Second Target: 1.792 AUD
Note: Stop Loss(SL): 1.762 AUD
Please respect each other's ideas and express them politely if you agree or disagree.
Euro/Australian Dollar Analyze (EURAUD), 4-hour time frame.
Be sure to follow the updated ideas.
Do not forget to put a Stop loss for your positions (For every position you want to open).
Please follow your strategy and updates; this is just my Idea, and I will gladly see your ideas in this post.
Please do not forget the ✅' like '✅ button 🙏😊 & Share it with your friends; thanks, and Trade safe.
AUDNZD Technical + Fundamental Align for DownsideToday I want to analyze a short position on the AUDNZD ( OANDA:AUDNZD ) pair, first, let's look at it from a fundamental analysis perspective .
Fundamental View on AUDNZD
Key reasons to short AUDNZD:
Australian weakness:
Recent data show weakening consumer sentiment and declining building approvals. The RBA seems hesitant to hike further, putting pressure on the Aussie.
New Zealand resilience:
The RBNZ maintains a relatively hawkish stance. Inflation is still a concern, and the central bank is committed to keeping rates high, supporting NZD strength.
Monetary policy divergence:
The divergence between RBA’s dovish stance and RBNZ’s hawkish approach supports further downside in AUDNZD.
----------------------
Now let's take a look at AUDNZD from a technical analysis perspective on the 4-hour timeframe .
AUDNZD is currently trading in a Heavy Resistance zone(1.0963 NZD-1.0870 NZD) near the upper line of the Range Channel , Potential Reversal Zone(PRZ) and Yearly Pivot Point .
In terms of Elliott Wave theory , AUDNZD appears to be completing microwave B of microwave Y of the main wave 4 .
I expect AUDNZD to drop to at least 1.0904 NZD(First Target) based on the above explanation .
Second Target: 1.0886 NZD
Note: Stop Loss(SL): 1.0963 NZD
Please respect each other's ideas and express them politely if you agree or disagree.
Australian Dollar/New Zealand Dollar Analyze (AUDNZD), 4-hour time frame.
Be sure to follow the updated ideas.
Do not forget to put a Stop loss for your positions (For every position you want to open).
Please follow your strategy and updates; this is just my Idea, and I will gladly see your ideas in this post.
Please do not forget the ✅' like '✅ button 🙏😊 & Share it with your friends; thanks, and Trade safe.

GBP-AUD Growth Ahead! Buy!
Hello,Traders!
GBP-AUD made a retest
Of the horizontal support
Of 2.0420 and we are
Already seeing a bullish
Rebound so we will be
Expecting a further
Bullish move up
Buy!
Comment and subscribe to help us grow!
Check out other forecasts below too!
Disclosure: I am part of Trade Nation's Influencer program and receive a monthly fee for using their TradingView charts in my analysis.

EUR-AUD Bullish Breakout! Buy!
Hello,Traders!
EUR-AUD made a bullish
Breakout of the falling resistance
And the breakout is confirmed
So we are bullish biased
And we will be expecting
A further bullish move up
On Monday!
Buy!
Comment and subscribe to help us grow!
Check out other forecasts below too!
Disclosure: I am part of Trade Nation's Influencer program and receive a monthly fee for using their TradingView charts in my analysis.

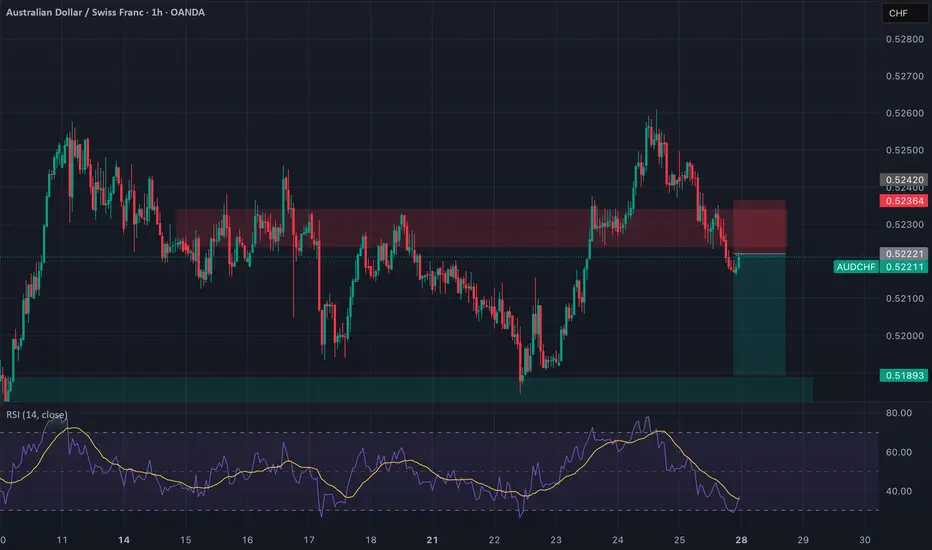
AUDCHF: Broken Support, Bearish Flow In Play Timeframe: 1H
Bias: Bearish
Type: Support Turncoat → Breakdown Play
📊 Technical Setup
AUDCHF previously broke the 4H resistance (0.5236) which flipped to support. However, price has now broken below this support, confirming it as a failed demand zone.
• Entry: Market execution or retest of 0.5236
• SL: Above 0.5245
• TP: 0.5189
• RR: ~1:2
• RSI: Below 50 and heading lower = momentum supports downside
📉 Macro & Fundamental Confluence
• AUD Weakness: RBA dovish, conditional score declining, bearish seasonality
• CHF Slightly Less Weak: Despite SNB dovish stance, CHF is outperforming AUD
• COT + Sentiment: AUD CFTC weakening, CHF holding steady
• Risk Sentiment: RISK ON environment reduces CHF demand but AUD still underperforms
🧭 Gameplan
“Support failed to hold. Bearish pressure intensifies. Target previous swing low zone.”
🔔 Watch for retest of 0.5236 for better RR setup before continuing short.
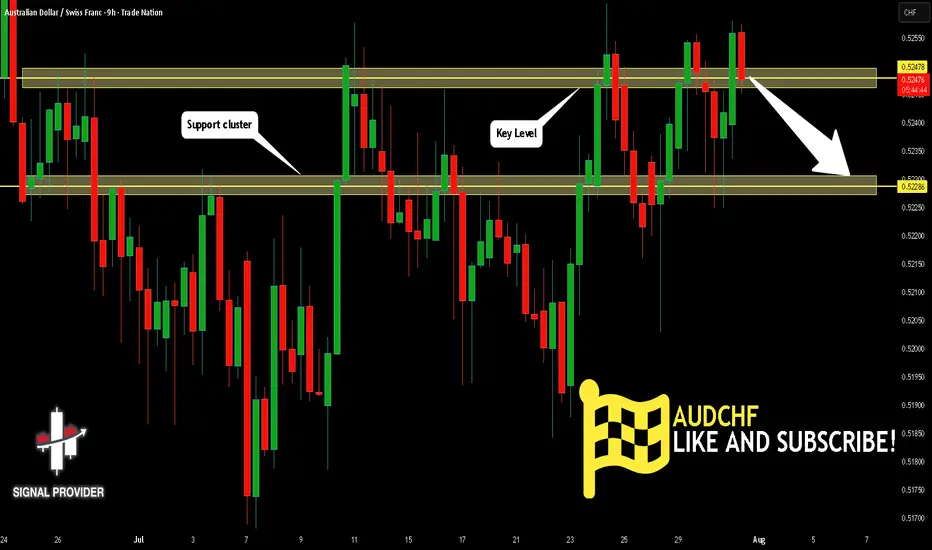
AUDCHF Will Go Down! Short!
Here is our detailed technical review for AUDCHF.
Time Frame: 9h
Current Trend: Bearish
Sentiment: Overbought (based on 7-period RSI)
Forecast: Bearish
The market is on a crucial zone of supply 0.524.
The above-mentioned technicals clearly indicate the dominance of sellers on the market. I recommend shorting the instrument, aiming at 0.522 level.
P.S
Please, note that an oversold/overbought condition can last for a long time, and therefore being oversold/overbought doesn't mean a price rally will come soon, or at all.
Disclosure: I am part of Trade Nation's Influencer program and receive a monthly fee for using their TradingView charts in my analysis.
Like and subscribe and comment my ideas if you enjoy them!
EUR/AUD BEARS ARE GAINING STRENGTH|SHORT
EUR/AUD SIGNAL
Trade Direction: short
Entry Level: 1.777
Target Level: 1.768
Stop Loss: 1.782
RISK PROFILE
Risk level: medium
Suggested risk: 1%
Timeframe: 2h
Disclosure: I am part of Trade Nation's Influencer program and receive a monthly fee for using their TradingView charts in my analysis.
✅LIKE AND COMMENT MY IDEAS✅

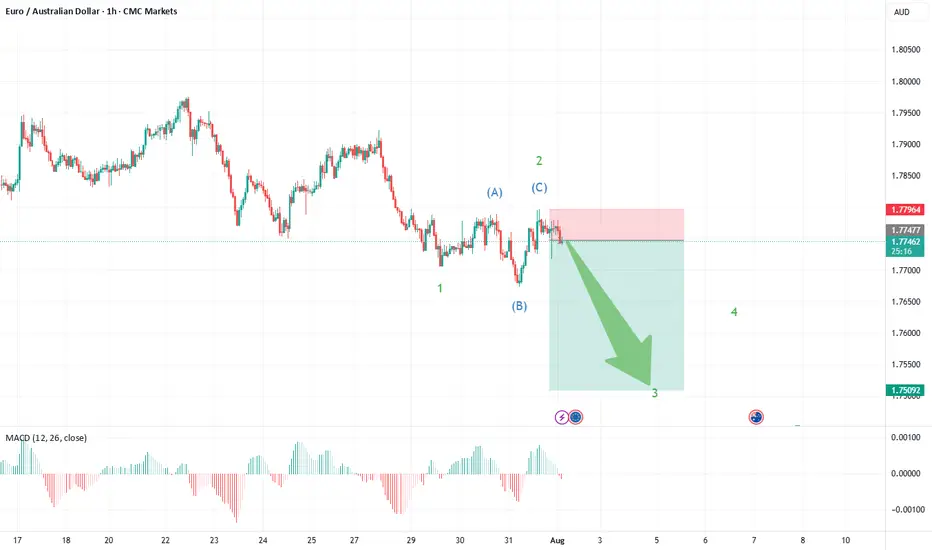
EUR/AUD: Short Setup Forming—Is the Downside Just Beginning?EUR/AUD is flashing the early signs of a new short trading opportunity, with the latest chart pointing toward a fresh move lower as the corrective phase may be wrapping up.
What the Current Structure Shows (Primary Scenario)
Corrective Pattern Complete: The strong advance off the May 14th, 2025 lows at 1.7247 unfolded as a classic double zigzag (WXY), culminating at recent highs. Price action has since reversed and formed an initial impulse down—clear evidence that the correction may be over.
Wave 1 Down, Expanded Flat for Wave 2: The chart now displays a completed wave 1 on the downside, followed by an expanded flat for wave 2—where price retraced upward but failed to break the previous peak, a sign of fading bullish momentum.
The recent structure shows a sharp, impulsive move down (wave 1), fitting Elliott Wave expectations for a new trend immediately after a complex correction.
The expanded flat for wave 2—where the B wave exceeded the start of A and C pushed higher—typically heralds a strong, extended wave 3. This supports a bearish outlook from current levels.
AUD/JPY bulls eye 99, 100The yen is broadly weaker, which is even allowing a weaker Australian dollar to rise. And with a decent bullish trend on the daily chart, I am now seeking dips within a recent consolidation range in anticipation of a move to 99 or even 100.
Matt Simpson, Market Analyst at City Index and Forex.com

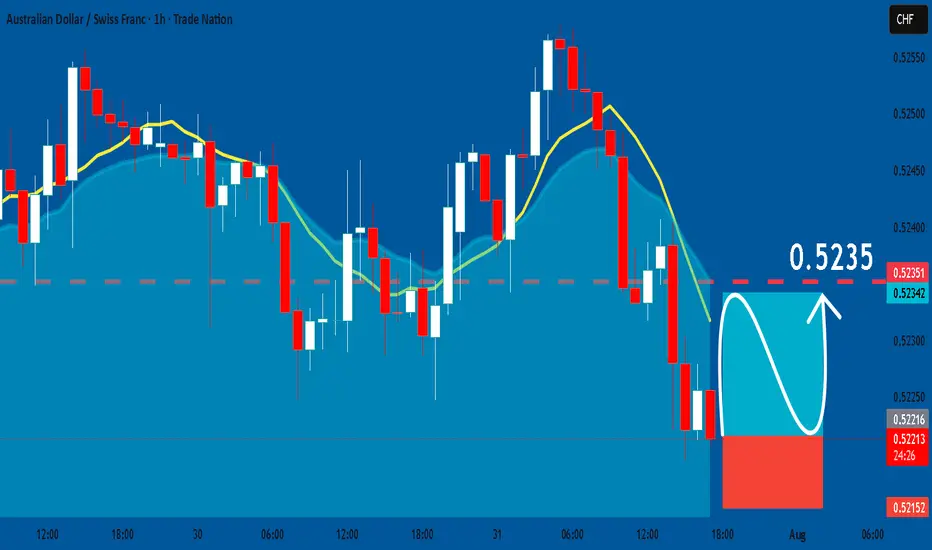
AUDCHF: Bullish Continuation & Long Signal
AUDCHF
- Classic bullish formation
- Our team expects pullback
SUGGESTED TRADE:
Swing Trade
Long AUDCHF
Entry - 0.5221
Sl - 0.5215
Tp - 0.5235
Our Risk - 1%
Start protection of your profits from lower levels
Disclosure: I am part of Trade Nation's Influencer program and receive a monthly fee for using their TradingView charts in my analysis.
❤️ Please, support our work with like & comment! ❤️
AUDJPY Bullish Continuation Key Support and Resistance Levels
Resistance Level 1: 97.527
Resistance Level 2: 98.091
Resistance Level 3: 99.00
Support Level 1: 96.00
Support Level 2: 95.574
Support Level 3: 95.060
This communication is for informational purposes only and should not be viewed as any form of recommendation as to a particular course of action or as investment advice. It is not intended as an offer or solicitation for the purchase or sale of any financial instrument or as an official confirmation of any transaction. Opinions, estimates and assumptions expressed herein are made as of the date of this communication and are subject to change without notice. This communication has been prepared based upon information, including market prices, data and other information, believed to be reliable; however, Trade Nation does not warrant its completeness or accuracy. All market prices and market data contained in or attached to this communication are indicative and subject to change without notice.

AUDCAD - Buyers ready to step in AUDCAD is in moving in LTF consolidation before next impulsive phase. Couple highs to target a good R ratio.
Good Luck

Short AUDCHFRR 1:1.5
Reason:
Selling pressure observed on Range Top.
Target Range Bottom
AUDCH Sell Trade based on William's Alligator and William's %R on Daily Time frame for bias and 1hr time frame for trade idea.

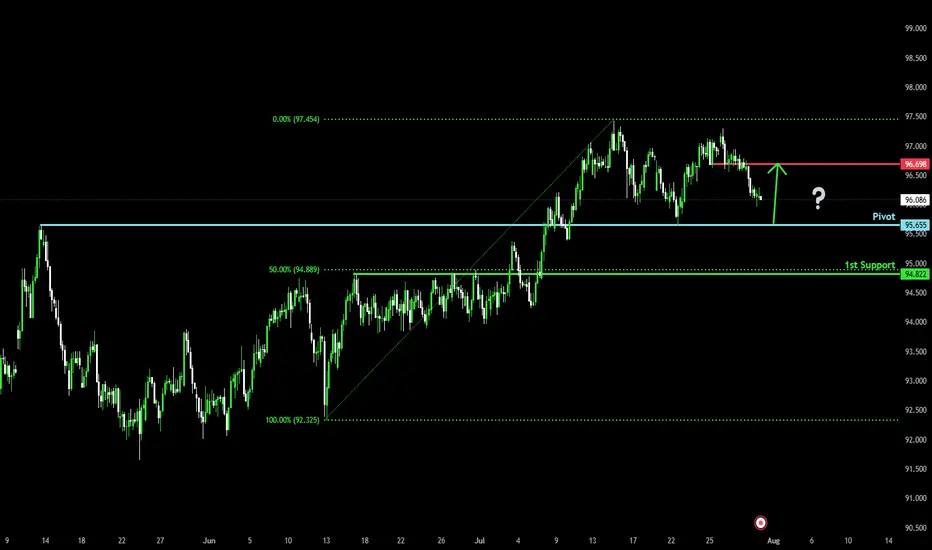
Falling towards overlap support?AUD/JPY is falling towards the pivot, which has been identified as an overlap support and could bounce to the 1st resistance.
Pivot: 95.65
1st Support: 94.82
1st Resistance: 96.69
Risk Warning:
Trading Forex and CFDs carries a high level of risk to your capital and you should only trade with money you can afford to lose. Trading Forex and CFDs may not be suitable for all investors, so please ensure that you fully understand the risks involved and seek independent advice if necessary.
Disclaimer:
The above opinions given constitute general market commentary, and do not constitute the opinion or advice of IC Markets or any form of personal or investment advice.
Any opinions, news, research, analyses, prices, other information, or links to third-party sites contained on this website are provided on an "as-is" basis, are intended only to be informative, is not an advice nor a recommendation, nor research, or a record of our trading prices, or an offer of, or solicitation for a transaction in any financial instrument and thus should not be treated as such. The information provided does not involve any specific investment objectives, financial situation and needs of any specific person who may receive it. Please be aware, that past performance is not a reliable indicator of future performance and/or results. Past Performance or Forward-looking scenarios based upon the reasonable beliefs of the third-party provider are not a guarantee of future performance. Actual results may differ materially from those anticipated in forward-looking or past performance statements. IC Markets makes no representation or warranty and assumes no liability as to the accuracy or completeness of the information provided, nor any loss arising from any investment based on a recommendation, forecast or any information supplied by any third-party.
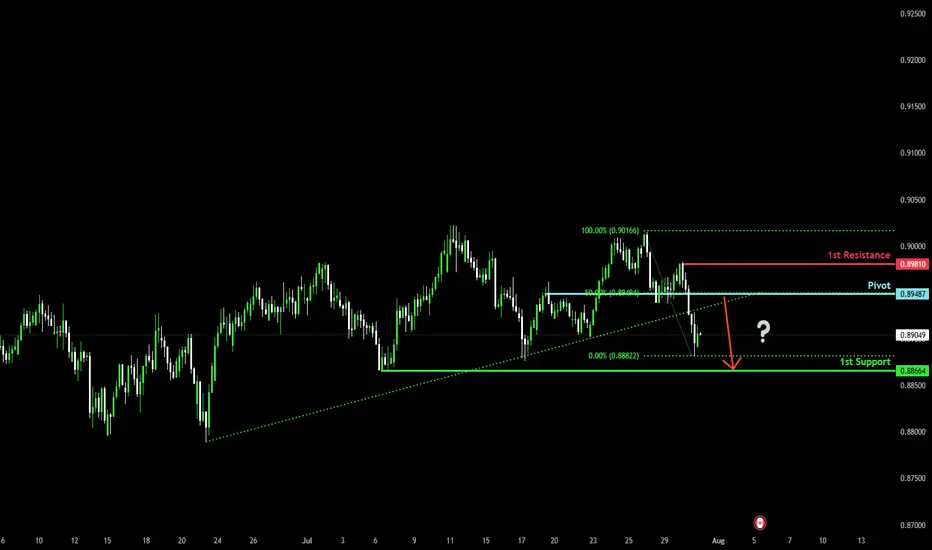
Bearish reversal?AUD/CAD is rising towards the pivot, which aligns with the 50% Fibonacci retracement and could reverse to the swing low support.
Pivot: 0.89487
1st Support: 0.88664
1st Resistance: 0.89810
Risk Warning:
Trading Forex and CFDs carries a high level of risk to your capital and you should only trade with money you can afford to lose. Trading Forex and CFDs may not be suitable for all investors, so please ensure that you fully understand the risks involved and seek independent advice if necessary.
Disclaimer:
The above opinions given constitute general market commentary, and do not constitute the opinion or advice of IC Markets or any form of personal or investment advice.
Any opinions, news, research, analyses, prices, other information, or links to third-party sites contained on this website are provided on an "as-is" basis, are intended only to be informative, is not an advice nor a recommendation, nor research, or a record of our trading prices, or an offer of, or solicitation for a transaction in any financial instrument and thus should not be treated as such. The information provided does not involve any specific investment objectives, financial situation and needs of any specific person who may receive it. Please be aware, that past performance is not a reliable indicator of future performance and/or results. Past Performance or Forward-looking scenarios based upon the reasonable beliefs of the third-party provider are not a guarantee of future performance. Actual results may differ materially from those anticipated in forward-looking or past performance statements. IC Markets makes no representation or warranty and assumes no liability as to the accuracy or completeness of the information provided, nor any loss arising from any investment based on a recommendation, forecast or any information supplied by any third-party.