AUD/JPY SELL IDEA (R:R=8.7)Selling AUD/JPY now. I have been waiting for this to close below the trend line. Overall direction is BEARISH according to Monthly timeframe.
Stop Loss is: 95.260
Please move SL to break even when trade is 70+ pips in profit.
1st Target: 93.500
2nd Target: 92.715
Happy Trading! :)
AUD (Australian Dollar)

AUDCHF: Bearish Forecast & Bearish Scenario
It is essential that we apply multitimeframe technical analysis and there is no better example of why that is the case than the current AUDCHF chart which, if analyzed properly, clearly points in the downward direction.
Disclosure: I am part of Trade Nation's Influencer program and receive a monthly fee for using their TradingView charts in my analysis.
❤️ Please, support our work with like & comment! ❤️

EURAUD bullish pennant may be developing! Intraday Update: Despite the weaker Australian CPI overnight the EURAUD slipped below 1.7085 which may allow for a move to the 1.7020 level, which is the 38% retracement. A bullish pennant may be developing.

The Journey has come to an end: AUDJPY hit TP, after 3 dayswe started the journey on Monday, London session, we held it no matter the market conditions.
we believed in our setup and we hit our TP.
cheers to y'all that followed it.
unto the next, let's fvcking goooo!!!

GBPAUD Will Move Lower! Short!
Please, check our technical outlook for GBPAUD.
Time Frame: 1h
Current Trend: Bearish
Sentiment: Overbought (based on 7-period RSI)
Forecast: Bearish
The market is approaching a key horizontal level 2.039.
Considering the today's price action, probabilities will be high to see a movement to 2.033.
P.S
We determine oversold/overbought condition with RSI indicator.
When it drops below 30 - the market is considered to be oversold.
When it bounces above 70 - the market is considered to be overbought.
Disclosure: I am part of Trade Nation's Influencer program and receive a monthly fee for using their TradingView charts in my analysis.
Like and subscribe and comment my ideas if you enjoy them!

EURAUD Long Australian Dollar weaker: Dispite of budegt defict forecast
2 apporaches:Conservative and aggressive entry
Profit targets similar
Risk management :Individual approach

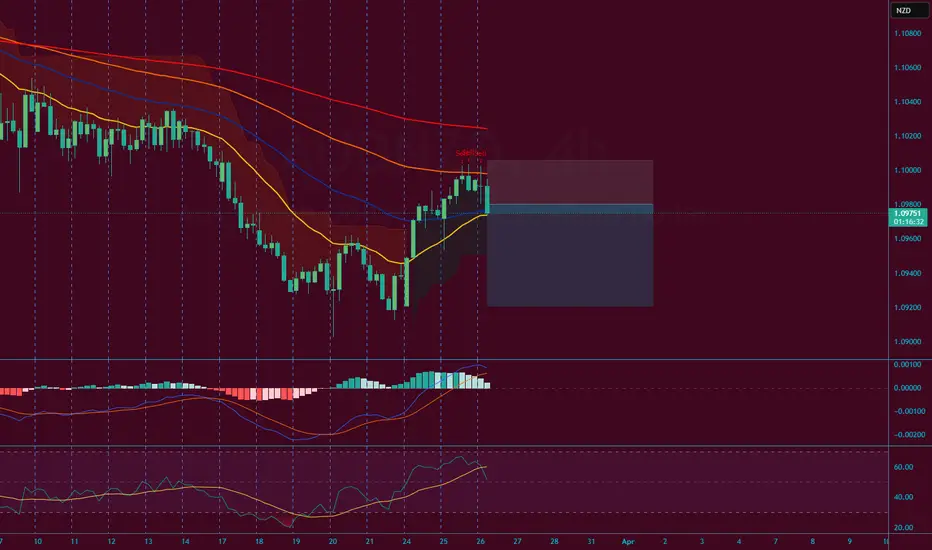
AUD/NZD BEARISH BIAS RIGHT NOW| SHORT
AUD/NZD SIGNAL
Trade Direction: short
Entry Level: 1.098
Target Level: 1.089
Stop Loss: 1.104
RISK PROFILE
Risk level: medium
Suggested risk: 1%
Timeframe: 6h
Disclosure: I am part of Trade Nation's Influencer program and receive a monthly fee for using their TradingView charts in my analysis.
✅LIKE AND COMMENT MY IDEAS✅

GBP/AUD Breakout (25.3.25)The GBP/AUD Pair on the M30 timeframe presents a Potential Selling Opportunity due to a recent Formation of a Trendline Breakout Pattern. This suggests a shift in momentum towards the downside in the coming hours.
Possible Short Trade:
Entry: Consider Entering A Short Position around Trendline Of The Pattern.
Target Levels:
1st Support – 2.0448
2nd Support – 2.0400
🎁 Please hit the like button and
🎁 Leave a comment to support for My Post !
Your likes and comments are incredibly motivating and will encourage me to share more analysis with you.
Best Regards, KABHI_TA_TRADING
Thank you.

GBP/AUD BEARS WILL DOMINATE THE MARKET|SHORT
Hello, Friends!
We are now examining the GBP/AUD pair and we can see that the pair is going up locally while also being in a uptrend on the 1W TF. But there is also a powerful signal from the BB upper band being nearby, indicating that the pair is overbought so we can go short from the resistance line above and a target at 2.054 level.
Disclosure: I am part of Trade Nation's Influencer program and receive a monthly fee for using their TradingView charts in my analysis.
✅LIKE AND COMMENT MY IDEAS✅

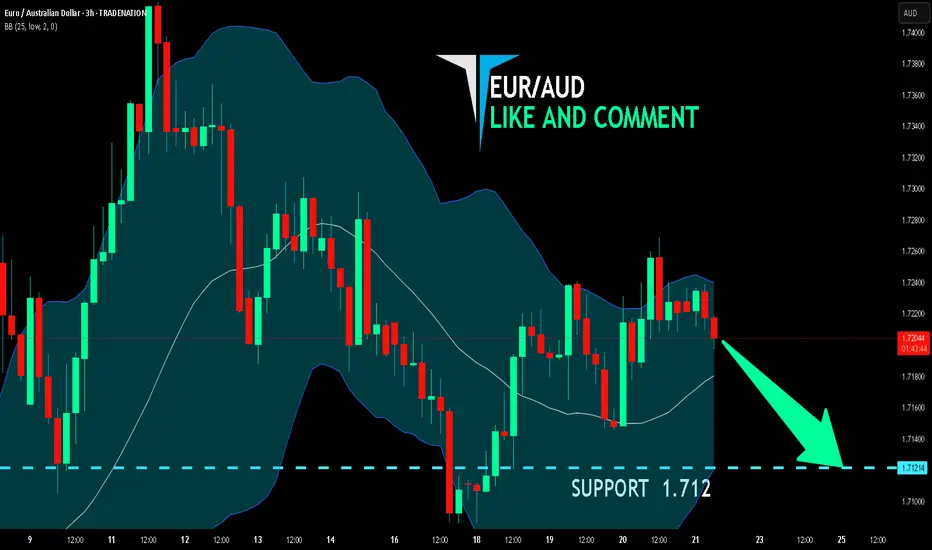
EUR/AUD BEARS ARE STRONG HERE|SHORT
Hello, Friends!
EUR/AUD pair is in the uptrend because previous week’s candle is green, while the price is clearly rising on the 3H timeframe. And after the retest of the resistance line above I believe we will see a move down towards the target below at 1.712 because the pair overbought due to its proximity to the upper BB band and a bearish correction is likely.
Disclosure: I am part of Trade Nation's Influencer program and receive a monthly fee for using their TradingView charts in my analysis.
✅LIKE AND COMMENT MY IDEAS✅
My AUDNZD Short Idea 26/03/2025The AUD recent data seems more bearish than the NZD recent data. We are seeing strength in the NZD and weakness in the AUD.
NZD CPI -> 2.2% from 2.2%
AUD CPI -> 2.4% from 2.8%
Interest rate forecast Q2:
AUD -> 3.85 from 4.1
NZD -> 3.25 from 3.75
My GBPAUD Long idea 26/03/2025The AUD currency has been seeing some weakness and if we look at the inflation it is relatively weakening. The inflation rate in Australia went from 2.8 to 2.4 and the interest rate for AUD is sitting at 4.1.
The Pound has seen some love due to raising inflation narrative we are sitting at 3.0 and it is expected to drop to 2.9 with the interest rate sitting at 4.5.
AUD interest rate projection -> Q1 4.1 -> Q2 3.85 -> Q3 3.85 -> Q4 3.6
GBP interest rate projection -> Q1 4.5 -> Q2 4.25 -> Q3 4.0 -> Q4 4.0
I would love to see the price make some pullbacks to the 50% fib or go a little below to the 100 EMA for a better RR. However, if you pull out the Bollinger Bands you will realize that the 4H price has bounced off of the lower Bollinger.
And if you try drawing a FIB from the recent 4H Swing Low you will notice a bounce from the 50% level. I would try DCA or put a tight SL below 204738 maybe if price stays flat but slowly melting upwards.

AUDCAD - Sell Trade SetupWaiting for AUDCAD to reach the level I plotted on the chart to sell it.
Leave a comment below, let me know what you think. Share with friends. Check out my profile for more awesome trade plans and setups. DM for copy trading, use any regulated FX broker.
Trade Safe - Trade Well
~Michael Harding

AUDCAD | Reoccurring FractalsWe're looking at 3 complete fractals and the fourth one being the current one. Same phase as the last, a bit of sideways trading/consolidation then aggressive buying breaking out to the upside.
Price action has been trending upwards with HHs and HLs and we're currently at a Lower High bouncing off the lower trendline below.
Would be ideal to look for long positions only for this setup as bulls are looking stronger from this view.
~300pips going into the 3rd wave.

GBP/AUD Bulls Eye 2020 HighFutures traders are net-long GBP/USD futures and net-short AUD/USD futures. So it is quite fitting to see GBP/AUD in a strong uptrend, with traders now eyeing the 2020 high.
However, the weekly chart suggests the current upswing may be nearing a cycle peak. A small bearish divergence has also formed on this timeframe. I am therefor seeking evidence of a swing high to form, somewhere around the 2020 high (or below).
For now, the daily chart is grinding higher and the 10-day EMA is supporting. There are also early signs of an ending diagonal / rising wedge, which could still allow for another leg or two higher before the anticipated mean reversion towards the 10 and 20-week EMAs kick in.
Matt Simpson, Market Analyst at City Index and Forex.com

AUDNZD - Sell Trade SetupTaking a look at AUDNZD on the daily timeframe, price action has pulled back to a key level of resistance. Unless something significant happens, there's no rational or fundamental reason for this pair to breakout to the upside. For this reason, I'm interested in short selling this pair.
Leave a comment below, let me know what you think. Share with friends. Check out my profile for more awesome trade plans and setups. DM for account management
Trade Safe - Trade Well
~Michael Harding
