GBPAUD - Bullish Price Action GBPAUD broke out of a reversal structure with a double bottom confluence. Expecting further growth for a long opportunity.
Good Luck
AUD (Australian Dollar)

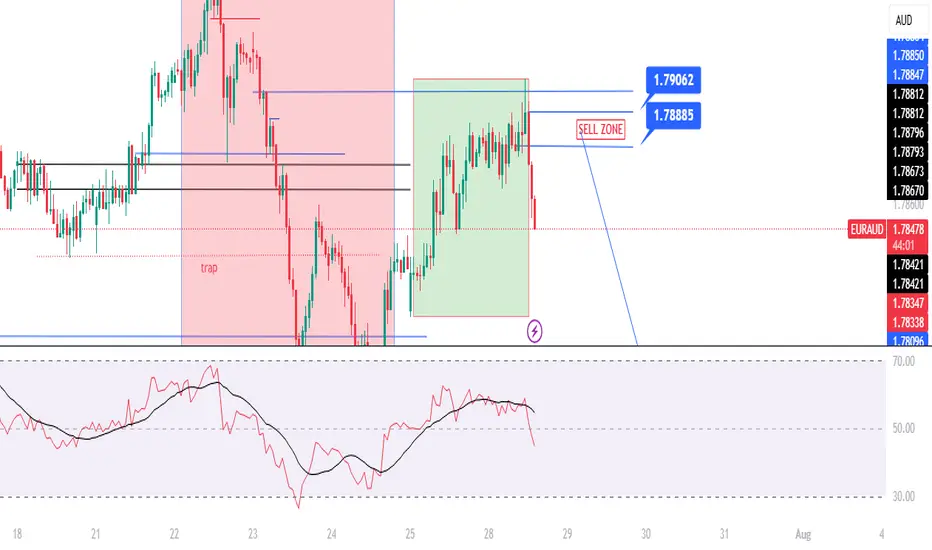
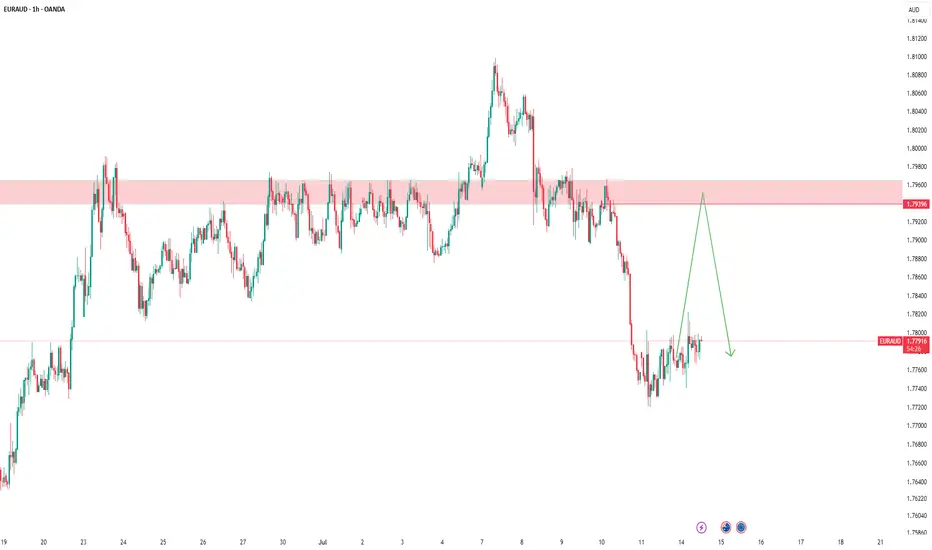
EURAUD | One Kiss from 1.7906 and I’m In – TP 140 Pips!The big picture of EURAUD is SELL possible up to 1.7750
Spot that H1 BUY range?
Inside it, there is conflict. A sneaky SELL range form inside it after rejection H4 BLUE LINE.
See that top blue line at 1.7916?
It got a gentle kiss from the H4 candle (REJECTION).
Then H1 already whispered, "a sweet breakout"!
📌LONG STORY SHORT, I'M SELL AROUND 1.7888 - 7906
If H4 comes and kisses one of the line (just a touch and wick), I’m SELLING — no more playing hard to get. 😘
Other wise, I’ll quietly cry in the corner
TP? 1.7750 — that’s a sweet 140-candlelit dinner!
WISH ME LUCK...!!!
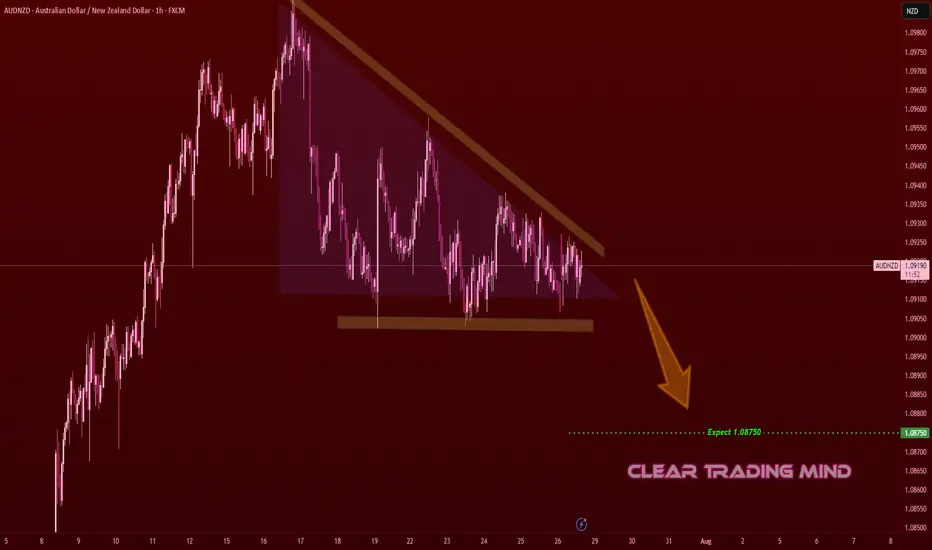
AUDNZD Descending Triangle – Bearish Breakout SetupOn the 1-hour chart, AUDNZD is forming a descending triangle 📐, a bearish continuation pattern.
- Horizontal support is holding but getting repeatedly tested
- Lower highs indicate selling pressure
Plan:
- Break and close below support may trigger a bearish continuation
- Target: 1.08750 🎯 (≈ 35 pips from current price)
- Invalidation if price breaks above descending trendline and holds
Reasoning:
- Descending triangle often leads to breakdowns when tested multiple times
- Lower highs show sellers gaining control
- Short bias remains as long as price respects the triangle resistance
(Personal chart study, not financial advice)
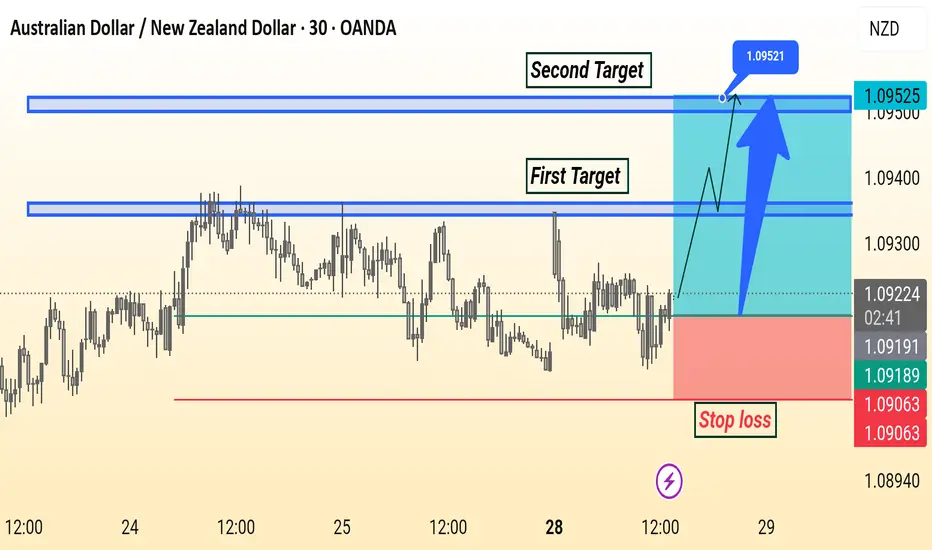
AUD/NZD Analysis is Ready Move Will Be Fly This AUD/NZD 30-minute chart shows a bullish setup with entry around 1.09216. The first target is near 1.09400 and the second target is at 1.09521. A stop loss is placed below support at 1.09063. The analysis suggests a potential upward move after a breakout.
GBPAUD Is Going Up! Long!
Here is our detailed technical review for GBPAUD.
Time Frame: 6h
Current Trend: Bullish
Sentiment: Oversold (based on 7-period RSI)
Forecast: Bullish
The market is on a crucial zone of demand 2.055.
The oversold market condition in a combination with key structure gives us a relatively strong bullish signal with goal 2.070 level.
P.S
Please, note that an oversold/overbought condition can last for a long time, and therefore being oversold/overbought doesn't mean a price rally will come soon, or at all.
Disclosure: I am part of Trade Nation's Influencer program and receive a monthly fee for using their TradingView charts in my analysis.
Like and subscribe and comment my ideas if you enjoy them!

GBPAUD oversold rally capped at 2.0600 resistanceThe GBPAUD pair is currently trading with a bearish bias, aligned with the broader downward trend. Recent price action shows a retest of the resistance, suggesting a temporary relief rally within the downtrend.
Key resistance is located at 2.0600, a prior consolidation zone. This level will be critical in determining the next directional move.
A bearish rejection from 2.0600 could confirm the resumption of the downtrend, targeting the next support levels at 2.0400, followed by 2.0350 and 2.0290 over a longer timeframe.
Conversely, a decisive breakout and daily close above 2.0600 would invalidate the current bearish setup, shifting sentiment to bullish and potentially triggering a move towards 2.0645, then 2.0730.
Conclusion:
The short-term outlook remains bearish unless the pair breaks and holds above 2.0600. Traders should watch for price action signals around this key level to confirm direction. A rejection favours fresh downside continuation, while a breakout signals a potential trend reversal or deeper correction.
This communication is for informational purposes only and should not be viewed as any form of recommendation as to a particular course of action or as investment advice. It is not intended as an offer or solicitation for the purchase or sale of any financial instrument or as an official confirmation of any transaction. Opinions, estimates and assumptions expressed herein are made as of the date of this communication and are subject to change without notice. This communication has been prepared based upon information, including market prices, data and other information, believed to be reliable; however, Trade Nation does not warrant its completeness or accuracy. All market prices and market data contained in or attached to this communication are indicative and subject to change without notice.
AUD/CAD SELLERS WILL DOMINATE THE MARKET|SHORT
Hello, Friends!
We are now examining the AUD/CAD pair and we can see that the pair is going up locally while also being in a uptrend on the 1W TF. But there is also a powerful signal from the BB upper band being nearby, indicating that the pair is overbought so we can go short from the resistance line above and a target at 0.885 level.
Disclosure: I am part of Trade Nation's Influencer program and receive a monthly fee for using their TradingView charts in my analysis.
✅LIKE AND COMMENT MY IDEAS✅

AUD/CAD’s Big Move: Don’t Sleep on This Breakout Setup!Hey traders, Skeptic from Skeptic Lab here! 🔥 While everyone’s freaking out over interest rate news and Non-Farm Employments , AUD/CAD ’s stealing the show on the daily time frame.
📉Post-tariff crash, it’s rebounding strong. A daily resistance break could kick off a major uptrend. Use RSI overbought/oversold ( linked in my TradingView article ) to confirm momentum.
👀Beware of fakeouts this week—volatility’s high! Trade smart, keep risk tight, and don’t FOMO. Share your thoughts in the comments, boost if it helps <3 🩵

AUDCAD – DAILY FORECAST Q3 | W31 | D28 | Y25📊 AUDCAD – DAILY FORECAST
Q3 | W31 | D28 | Y25
Daily Forecast 🔍📅
Here’s a short diagnosis of the current chart setup 🧠📈
Higher time frame order blocks have been identified — these are our patient points of interest 🎯🧭.
It’s crucial to wait for a confirmed break of structure 🧱✅ before forming a directional bias.
This keeps us disciplined and aligned with what price action is truly telling us.
📈 Risk Management Protocols
🔑 Core principles:
Max 1% risk per trade
Only execute at pre-identified levels
Use alerts, not emotion
Stick to your RR plan — minimum 1:2
🧠 You’re not paid for how many trades you take, you’re paid for how well you manage risk.
🧠 Weekly FRGNT Insight
"Trade what the market gives, not what your ego wants."
Stay mechanical. Stay focused. Let the probabilities work.
FX:AUDCAD

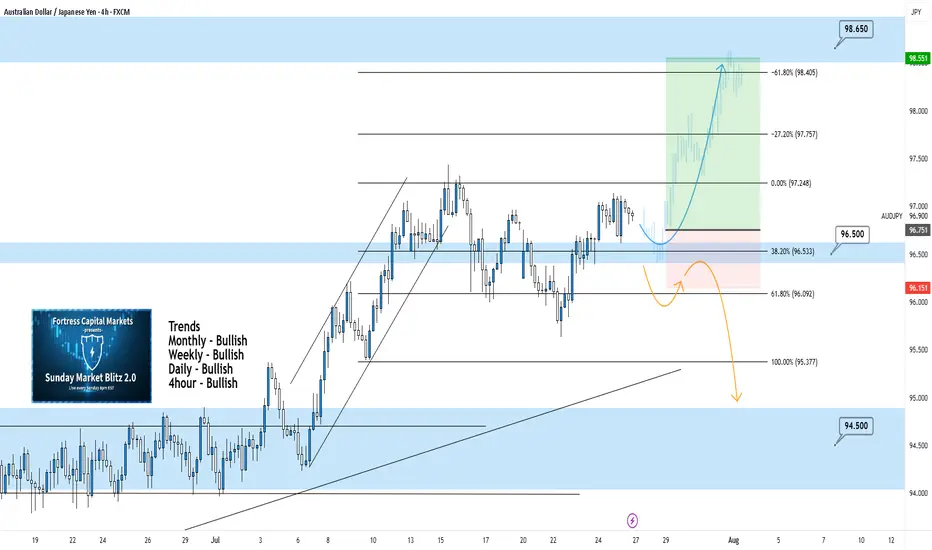
AUDJPY 4Hour TF - July 27th, 2025AUDJPY 7/27/2025
AUDJPY 4hour Bullish Idea
Monthly - Bullish
Weekly - Bullish
Dailly - Bullish
4hour - Bullish
We’re looking bullish again on AUDJPY for the week ahead, but will it stick? The overall higher timeframes suggest we are bullish as well but we will need to see key structure before entering any trades. Let’s take a look at two potential scenarios we would want to see happen this week.
Bullish Continuation - We ended last week in a perfect spot, right above our 96.500 zone. This leaves us in a position for a potential long opportunity where we only need to see 1 or two more forms of confirmation.
Look for our 96.500 zone to be tested and held as support. If this happens and we can confirm a higher low above 96.500 we’ll be looking to enter and target higher toward major levels of resistance like 98.650.
Bearish Reversal - For us to consider AJ bearish again we would need to see a strong break below the current zone at 96.500.
Look for signs of structure (LL, LH) to form below the current zone. If this happens we can consider targeting lower toward major levels of support like 94.500
AUDNZD: Bullish Continuation & Long Trade
AUDNZD
- Classic bullish formation
- Our team expects growth
SUGGESTED TRADE:
Swing Trade
Buy AUDNZD
Entry Level - 1.0913
Sl - 1.0909
Tp - 1.0920
Our Risk - 1%
Start protection of your profits from lower levels
Disclosure: I am part of Trade Nation's Influencer program and receive a monthly fee for using their TradingView charts in my analysis.
❤️ Please, support our work with like & comment! ❤️

AUDCAD – WEEKLY FORECAST Q3 | W31 | Y25📊 AUDCAD – WEEKLY FORECAST
Q3 | W30 | Y25
Weekly Forecast 🔍📅
Here’s a short diagnosis of the current chart setup 🧠📈
Higher time frame order blocks have been identified — these are our patient points of interest 🎯🧭.
It’s crucial to wait for a confirmed break of structure 🧱✅ before forming a directional bias.
This keeps us disciplined and aligned with what price action is truly telling us.
📈 Risk Management Protocols
🔑 Core principles:
Max 1% risk per trade
Only execute at pre-identified levels
Use alerts, not emotion
Stick to your RR plan — minimum 1:2
🧠 You’re not paid for how many trades you take, you’re paid for how well you manage risk.
🧠 Weekly FRGNT Insight
"Trade what the market gives, not what your ego wants."
Stay mechanical. Stay focused. Let the probabilities work.
FX:AUDCAD

GBPAUD: Bullish Forecast & Outlook
Balance of buyers and sellers on the GBPAUD pair, that is best felt when all the timeframes are analyzed properly is shifting in favor of the buyers, therefore is it only natural that we go long on the pair.
Disclosure: I am part of Trade Nation's Influencer program and receive a monthly fee for using their TradingView charts in my analysis.
❤️ Please, support our work with like & comment! ❤️

GBPAUD Is Going Up! Buy!
Here is our detailed technical review for GBPAUD.
Time Frame: 1D
Current Trend: Bullish
Sentiment: Oversold (based on 7-period RSI)
Forecast: Bullish
The market is testing a major horizontal structure 2.051.
Taking into consideration the structure & trend analysis, I believe that the market will reach 2.072 level soon.
P.S
The term oversold refers to a condition where an asset has traded lower in price and has the potential for a price bounce.
Overbought refers to market scenarios where the instrument is traded considerably higher than its fair value. Overvaluation is caused by market sentiments when there is positive news.
Disclosure: I am part of Trade Nation's Influencer program and receive a monthly fee for using their TradingView charts in my analysis.
Like and subscribe and comment my ideas if you enjoy them!

AUDJPY: Bullish Structure Shift Signals Institutional Buy ZoneGreetings Traders,
In today’s analysis of AUDJPY, we observe a recent bullish market structure shift (MSS), signaling potential for continued upward movement. With this in mind, we aim to capitalize on buying opportunities at key institutional points of interest to target higher premium prices.
Higher Timeframe Context:
The weekly timeframe maintains a clear bullish narrative. This long-term bias is now supported by a bullish MSS on the H4 timeframe, offering strong confluence and alignment across both macro and intermediate structures. This increases our confidence in expecting further bullish continuation.
Key Observations on H4:
Weekly Fair Value Gap (FVG) Support: Price recently pulled back into a weekly FVG and has rebalanced that inefficiency. This reaction aligns with the H4 MSS, reinforcing the weekly FVG as a strong institutional support zone.
Reclaimed Bullish Order Block: After the MSS, price retraced into a bullish reclaimed order block—an area where previous institutional positioning occurred. Since price has now reclaimed this level, it becomes a high-probability zone for renewed buying interest in the direction of the dominant trend.
Lower Timeframe Confirmation: This reclaimed order block will serve as our primary zone of interest to seek confirmations on the lower timeframes for precise entries.
Trading Plan:
Entry Strategy: Wait for bullish confirmation within the reclaimed H4 order block zone before entering long positions.
Target: The primary objective is the H4 liquidity pool situated at premium prices, which the market is likely to be drawn toward.
For a detailed market walkthrough and in-depth execution zones, be sure to watch this week’s Forex Market Breakdown:
As always, execute with discipline and align your trade management with your overall plan.
Kind Regards,
The Architect 🏛️📈

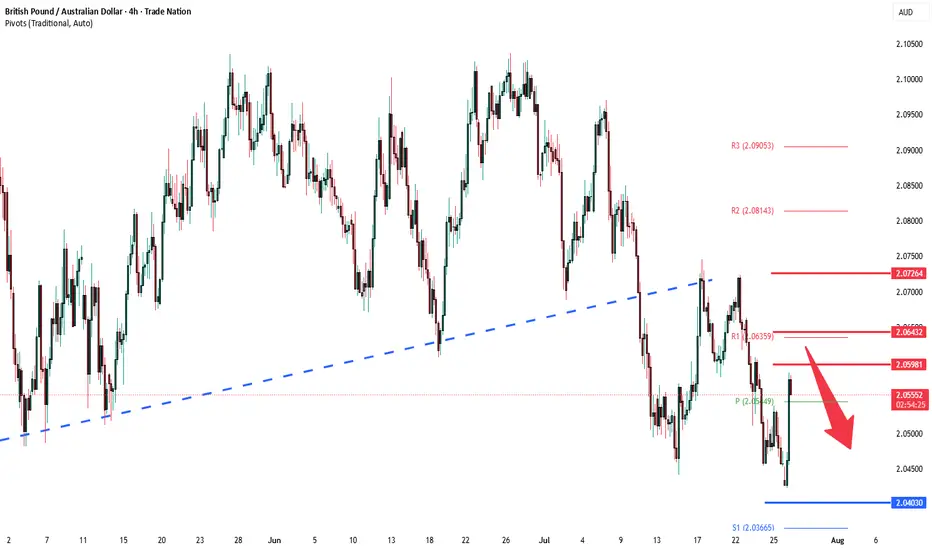
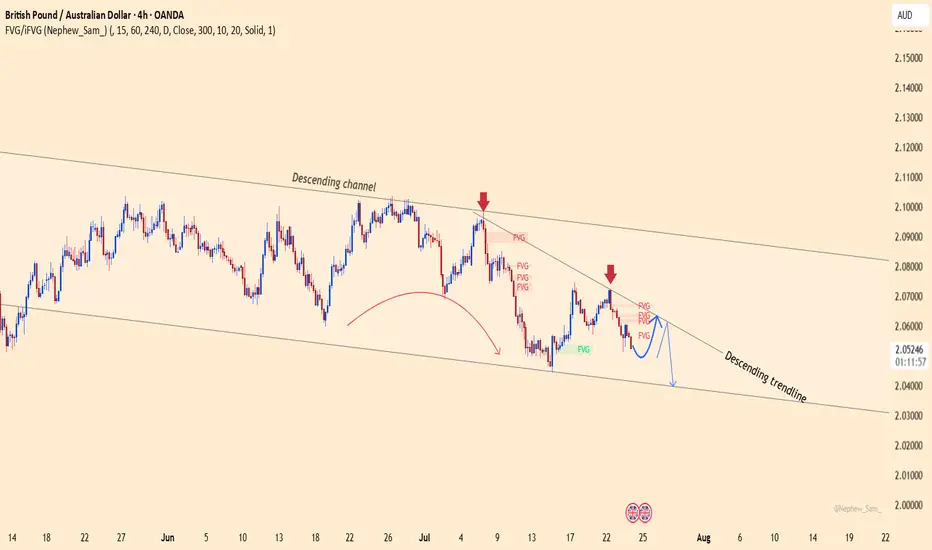
GBPAUD – False breakout or the next sharp drop?The GBPAUD pair continues to trade within a well-defined descending channel, with every bullish attempt being firmly rejected by the descending trendline. Recent candlesticks show a clear sell signal right at the FVG resistance zone.
Market-moving news:
Australia’s manufacturing PMI surprised to the upside → strong support for AUD
GBP remains under pressure after dovish comments from the BoE, diminishing hopes of further rate hikes.
If the price fails to break above the 2.0640 zone — creating yet another fake top — a sharp drop toward 2.0400 is highly likely.
Strategy: Look to SELL near the trendline and FVG zone, targeting 2.0400.
AUD-NZD Local Long! Buy!
Hello,Traders!
AUD-NZD is about to retest
A strong horizontal support
Level of 1.0912 and as we are
Bullish biased we will be expecting
A local bullish rebound
Buy!
Comment and subscribe to help us grow!
Check out other forecasts below too!
Disclosure: I am part of Trade Nation's Influencer program and receive a monthly fee for using their TradingView charts in my analysis.

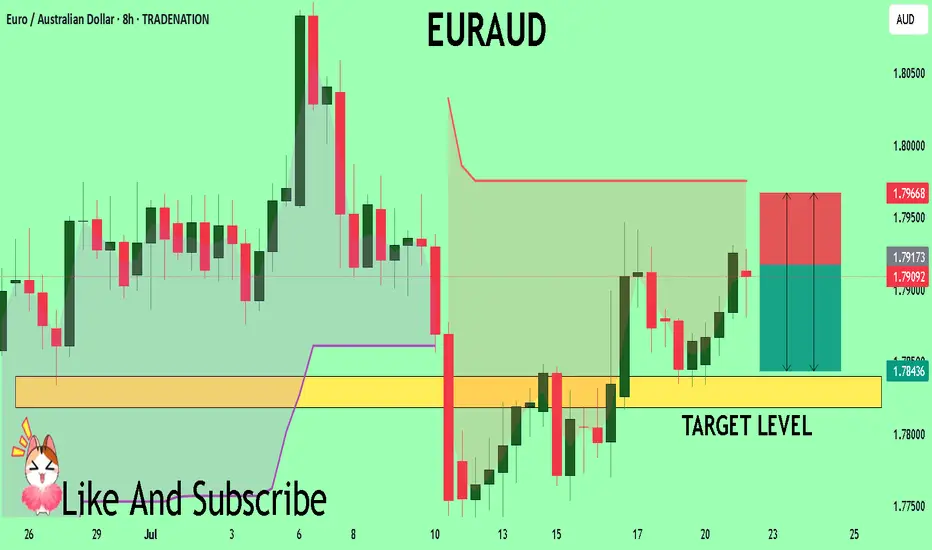
EURAUD Set To Fall! SELL!
My dear followers,
I analysed this chart on EURAUD and concluded the following:
The market is trading on 1.7917 pivot level.
Bias - Bearish
Technical Indicators: Both Super Trend & Pivot HL indicate a highly probable Bearish continuation.
Target - 1.7840
Safe Stop Loss - 1.7966
About Used Indicators:
A super-trend indicator is plotted on either above or below the closing price to signal a buy or sell. The indicator changes color, based on whether or not you should be buying. If the super-trend indicator moves below the closing price, the indicator turns green, and it signals an entry point or points to buy.
Disclosure: I am part of Trade Nation's Influencer program and receive a monthly fee for using their TradingView charts in my analysis.
———————————
WISH YOU ALL LUCK
GBPAUD Sellers In Panic! BUY!
My dear followers,
This is my opinion on the GBPAUD next move:
The asset is approaching an important pivot point 2.0491
Bias - Bullish
Technical Indicators: Supper Trend generates a clear long signal while Pivot Point HL is currently determining the overall Bullish trend of the market.
Goal - 2.0573
About Used Indicators:
For more efficient signals, super-trend is used in combination with other indicators like Pivot Points.
Disclosure: I am part of Trade Nation's Influencer program and receive a monthly fee for using their TradingView charts in my analysis.
———————————
WISH YOU ALL LUCK

EURAUD: Bullish Forecast & Outlook
Our strategy, polished by years of trial and error has helped us identify what seems to be a great trading opportunity and we are here to share it with you as the time is ripe for us to buy EURAUD.
Disclosure: I am part of Trade Nation's Influencer program and receive a monthly fee for using their TradingView charts in my analysis.
❤️ Please, support our work with like & comment! ❤️

EURAUD – Planning Ahead, Not PredictingAs usual, I have marked my level.
🎯 I’m waiting for the price to reach it and if a valid sell signal appears, I will enter a short position.
If the level is broken cleanly,
I’ll wait for a pullback and enter a buy trade.
We are just traders, not predictors.
We have no impact on the market —
we are just a tiny part of a huge system.
🧠 So I never say: “Price will come here, then must fall.”
That’s not my mindset.
My belief is simple:
Manage risk, be prepared for everything.
One trade won’t make me rich,
and I won’t let one trade destroy me.
📌 Stop-loss is the first and last rule.
Trading without a stop-loss is just gambling.
LONG ON GBP/AUDGA has given us a CHOC (change of character) to the upside after making a new low.
Price has since pulled back to the demand area that created that change leaving us with a possible double bottom forming.
I expect GA to rise to sweep buy side liquidity at the equal highs then reaching the previous supply level / previous High.
Looking to catch 200-300 pips.

GBPAUD oversold rallies capped at 2.0555The GBPAUD pair is currently trading with a bearish bias, aligned with the broader downward trend. Recent price action shows a retest of the resistance, suggesting a temporary relief rally within the downtrend.
Key resistance is located at 2.0555, a prior consolidation zone. This level will be critical in determining the next directional move.
A bearish rejection from 2.0555 could confirm the resumption of the downtrend, targeting the next support levels at 2.0400, followed by 2.0350 and 2.0290 over a longer timeframe.
Conversely, a decisive breakout and daily close above 2.0555 would invalidate the current bearish setup, shifting sentiment to bullish and potentially triggering a move towards 2.0600, then 2.0645.
Conclusion:
The short-term outlook remains bearish unless the pair breaks and holds above 2.0555. Traders should watch for price action signals around this key level to confirm direction. A rejection favours fresh downside continuation, while a breakout signals a potential trend reversal or deeper correction.
This communication is for informational purposes only and should not be viewed as any form of recommendation as to a particular course of action or as investment advice. It is not intended as an offer or solicitation for the purchase or sale of any financial instrument or as an official confirmation of any transaction. Opinions, estimates and assumptions expressed herein are made as of the date of this communication and are subject to change without notice. This communication has been prepared based upon information, including market prices, data and other information, believed to be reliable; however, Trade Nation does not warrant its completeness or accuracy. All market prices and market data contained in or attached to this communication are indicative and subject to change without notice.
