AUDJPY Q3 | D24 | W30 | Y25📊AUDJPY Q3 | D24 | W30 | Y25
Daily Forecast🔍📅
Here’s a short diagnosis of the current chart setup 🧠📈
Higher time frame order blocks have been identified — these are our patient points of interest 🎯🧭.
It’s crucial to wait for a confirmed break of structure 🧱✅ before forming a directional bias.
This keeps us disciplined and aligned with what price action is truly telling us.
📈 Risk Management Protocols
🔑 Core principles:
Max 1% risk per trade
Only execute at pre-identified levels
Use alerts, not emotion
Stick to your RR plan — minimum 1:2
🧠 You’re not paid for how many trades you take, you’re paid for how well you manage risk.
🧠 Weekly FRGNT Insight
"Trade what the market gives, not what your ego wants."
Stay mechanical. Stay focused. Let the probabilities work.
FRGNT
AUD (Australian Dollar)

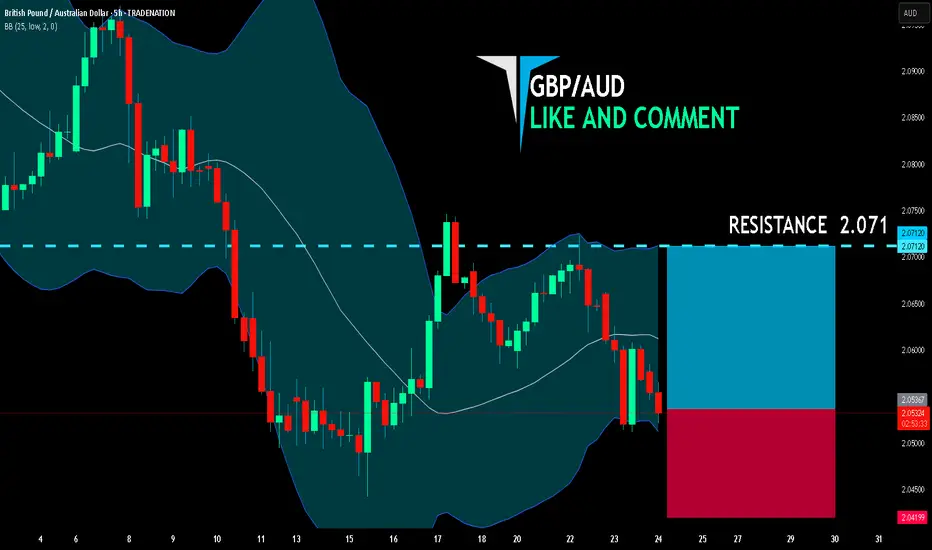
GBP/AUD LONG FROM SUPPORT
GBP/AUD SIGNAL
Trade Direction: long
Entry Level: 2.053
Target Level: 2.071
Stop Loss: 2.041
RISK PROFILE
Risk level: medium
Suggested risk: 1%
Timeframe: 5h
Disclosure: I am part of Trade Nation's Influencer program and receive a monthly fee for using their TradingView charts in my analysis.
✅LIKE AND COMMENT MY IDEAS✅
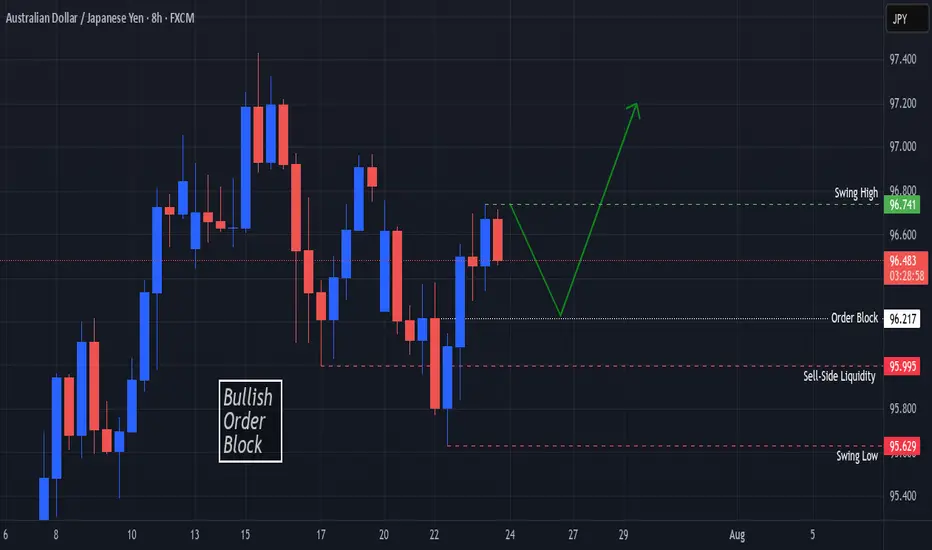
AUDJPY Bullish Order Block In SightOANDA:AUDJPY Price finds Support at the Swing Low @ 95.629 and creates a Swing High @ 96.741!
Based on the ICT Method, the Swing Low broke Sell-Side Liquidity @ 95.995 and opened up a Bullish Order Block Opportunity @ 96.217!
Price is currently working down from 96.49 at the time of publishing but once Price visits the Order Block, this could deliver Long Opportunities!!
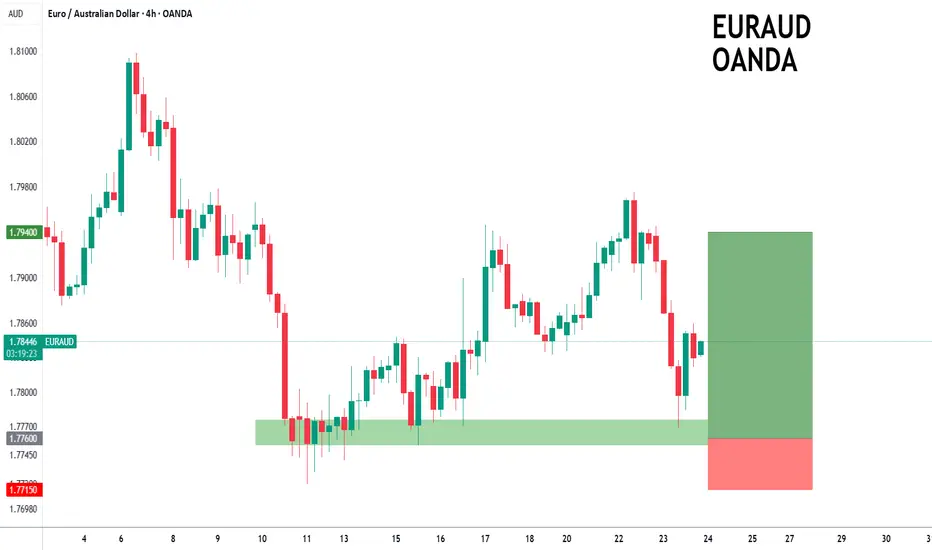
EURAUD to find buyers at previous support?EURAUD - 24h expiry
The primary trend remains bullish.
We are trading at oversold extremes.
Preferred trade is to buy on dips.
Risk/Reward would be poor to call a buy from current levels.
Bespoke support is located at 1.7760.
We look to Buy at 1.7760 (stop at 1.7715)
Our profit targets will be 1.7940 and 1.7960
Resistance: 1.7840 / 1.7900 / 1.7950
Support: 1.7750 / 1.7720 / 1.7700
Risk Disclaimer
The trade ideas beyond this page are for informational purposes only and do not constitute investment advice or a solicitation to trade. This information is provided by Signal Centre, a third-party unaffiliated with OANDA, and is intended for general circulation only. OANDA does not guarantee the accuracy of this information and assumes no responsibilities for the information provided by the third party. The information does not take into account the specific investment objectives, financial situation, or particular needs of any particular person. You should take into account your specific investment objectives, financial situation, and particular needs before making a commitment to trade, including seeking, under a separate engagement, as you deem fit.
You accept that you assume all risks in independently viewing the contents and selecting a chosen strategy.
Where the research is distributed in Singapore to a person who is not an Accredited Investor, Expert Investor or an Institutional Investor, Oanda Asia Pacific Pte Ltd (“OAP“) accepts legal responsibility for the contents of the report to such persons only to the extent required by law. Singapore customers should contact OAP at 6579 8289 for matters arising from, or in connection with, the information/research distributed.
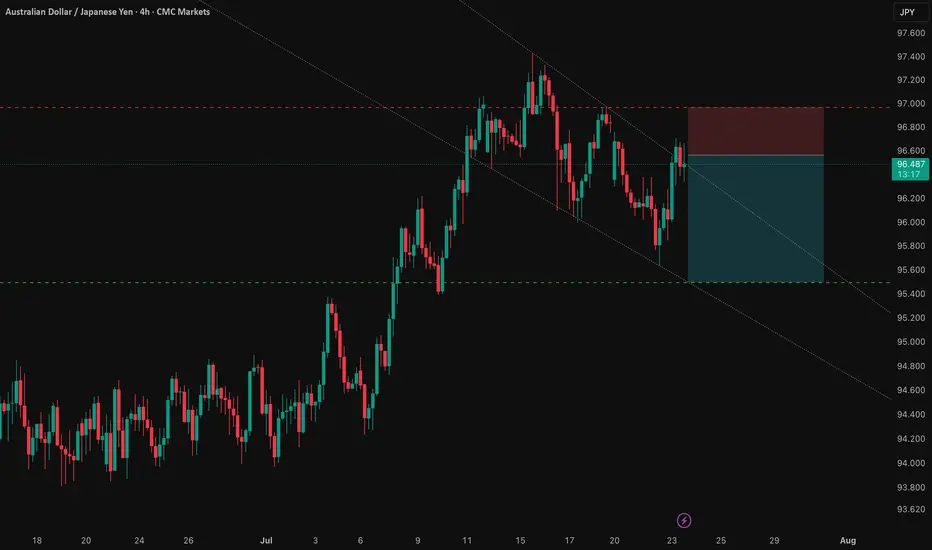
AUD/JPY: Capitalizing on the RBA-BoJ Monetary Policy GapThis analysis outlines a compelling short opportunity in AUD/JPY, driven by a powerful confluence of fundamental and technical factors. The trade is strategically positioned ahead of a key catalyst that could unlock significant downside potential.
1️⃣ The Core Thesis: A Clear Policy Divergence
The primary driver behind this trade is the stark and widening gap in monetary policy between the Reserve Bank of Australia (RBA) and the Bank of Japan (BoJ). The RBA is signaling a clear dovish pivot amid a weakening labor market, making an interest rate cut imminent. Conversely, the BoJ is in a tightening phase, creating a fundamental headwind for the AUD relative to the JPY. This divergence underpins the strategic bearish bias.
2️⃣ The Confirmation: Technical Alignment
This fundamental view is supported by a clear technical picture. The pair is in a well-defined downtrend and is currently testing a critical support level. This alignment of fundamental and technical factors presents a clear short opportunity, with the entry positioned for a breakdown below this key juncture.
3️⃣ The Catalyst: The RBA Bulletin
The immediate catalyst for this trade is the upcoming RBA Bulletin on July 24, 2025. Any dovish language from the RBA concerning Australia's economic outlook will likely reinforce expectations for a rate cut and accelerate the downward move in AUD/JPY.
The Trade Setup ✅
Here is the recommended trade setup:
📉 Trade: SHORT AUD/JPY
👉 Entry: 96.56200
⛔️ Stop Loss: 96.96386
🎯 Take Profit: 95.49900
🧠 Risk/Reward Ratio: 2.65
This setup offers a compelling risk-reward profile, capitalizing on a clear and powerful macroeconomic theme. The trade is designed to perform should the expected catalyst confirm the underlying bearish fundamentals.
AUDJPY: Waiting to BUYIn this video I walk through my full thought process on how I plan to approach this setup. I’m not rushing in or trying to predict what price will do. Instead, I’m staying reactive. I’ve identified a clean FVG that price is currently approaching, and my plan is to wait patiently for price to tap into that zone.
But tapping the FVG alone is not enough for me to jump in. What I really want to see is a clear bullish reaction, something like a strong bullish engulfing candle or a shift in structure that confirms the buyers are stepping in. If that happens, then I’ll look to take a long position targeting another liquidy zone.
This isn’t about guessing the bottom. It’s about letting price tell the story and only acting when there’s a clear signal. That’s the discipline behind this trade.

EURAUD: Waiting for the FVG Tap and Confirmation to ShortPrice ran previous liquidity and dropped aggressively, creating a clean FVG.
I’m now watching for price to retrace into that imbalance and form a strong bearish candle. If it does, I’ll be looking to short down
Clean structure. Just waiting for confirmation.

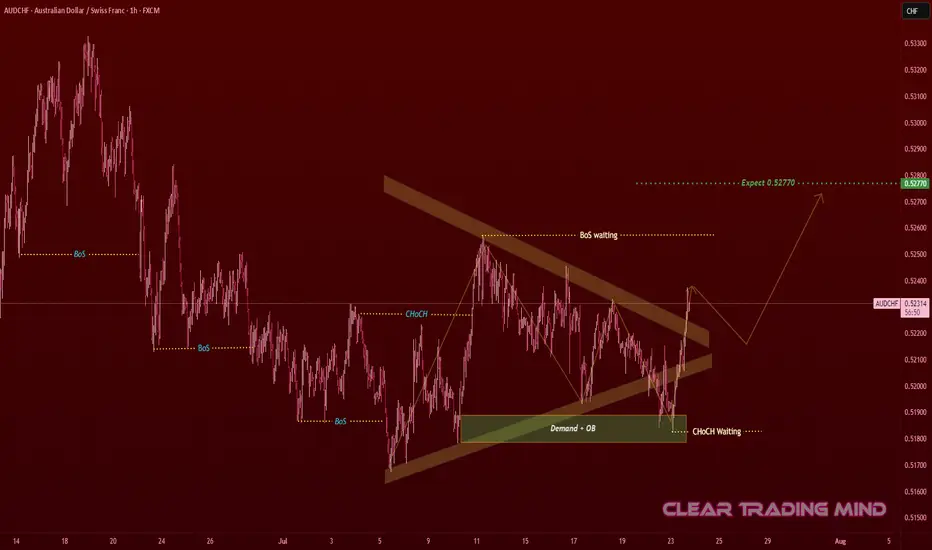
AUDCHF Contracting Triangle – Waiting for Breakout Confirmation
AUDCHF on the 1-hour chart is forming a contracting triangle 🔺, showing consolidation after a downtrend.
From an SMC perspective:
🟩 Demand + OB (Order Block) zone holding strong near 0.51900
🔄 Previous CHoCH shows buyer interest
⏳ Waiting for BoS (Break of Structure) confirmation above the triangle
Plan:
* Breakout Entry: Above 0.52400 after retest 🔓
🎯 First Target: 0.52770 – 0.52800 (≈ 37 pips from breakout)
🛡 Invalidation: Below 0.51900 (demand failure)
Reasoning:
+ Contracting triangles often lead to strong impulsive moves ⚡
+ Buyers are already active at demand 🔥
+ Confirmation of CHoCH + BoS could push price to targets 🚀
// (Not financial advice – personal chart observation)
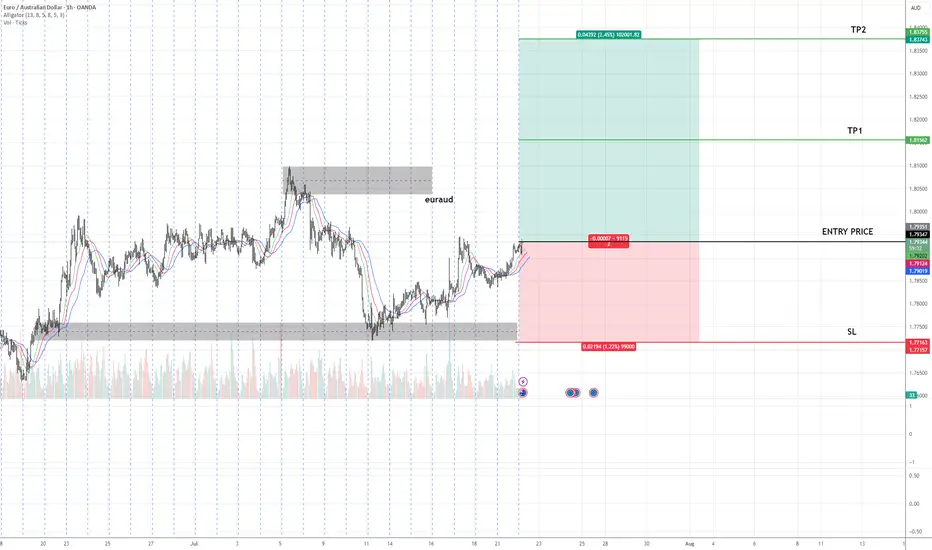
EURAUD Buy Setup – Advanced Analysis Entry: As marked on chart
🎯 TP1: As highlighted on chart
🎯 TP2: As highlighted on chart
🛑 SL: As defined on chart
📊 Technical Insight:
Price has completed a higher low formation, indicating the potential start of a new uptrend phase.
The market has shown an accumulation phase followed by a breakout above minor resistance, suggesting strong demand at current levels.
Volume analysis supports the breakout, with increased participation on bullish pushes and decreasing volume on retracements, confirming healthy trend dynamics.
📍 As long as price holds above the stop loss zone, we expect continuation towards TP1 and TP2 in line with the primary trend.
AUDCAD Q3 | D23 | W30 | Y25📊AUDCAD Q3 | D23 | W30 | Y25
Daily Forecast🔍📅
Here’s a short diagnosis of the current chart setup 🧠📈
Higher time frame order blocks have been identified — these are our patient points of interest 🎯🧭.
It’s crucial to wait for a confirmed break of structure 🧱✅ before forming a directional bias.
This keeps us disciplined and aligned with what price action is truly telling us.
📈 Risk Management Protocols
🔑 Core principles:
Max 1% risk per trade
Only execute at pre-identified levels
Use alerts, not emotion
Stick to your RR plan — minimum 1:2
🧠 You’re not paid for how many trades you take, you’re paid for how well you manage risk.
🧠 Weekly FRGNT Insight
"Trade what the market gives, not what your ego wants."
Stay mechanical. Stay focused. Let the probabilities work.
FRGNT

EUR/AUD BUYERS WILL DOMINATE THE MARKET|LONG
EUR/AUD SIGNAL
Trade Direction: long
Entry Level: 1.787
Target Level: 1.791
Stop Loss: 1.785
RISK PROFILE
Risk level: medium
Suggested risk: 1%
Timeframe: 1h
Disclosure: I am part of Trade Nation's Influencer program and receive a monthly fee for using their TradingView charts in my analysis.
✅LIKE AND COMMENT MY IDEAS✅

AUD-JPY Will Grow! Buy!
Hello,Traders!
AUD-JPY already made a
Bullish rebound from the
Strong horizontal support
Of 95.610 and as we are
Bullish biased we will be
Expecting a further bullish
Move up
Buy!
Comment and subscribe to help us grow!
Check out other forecasts below too!
Disclosure: I am part of Trade Nation's Influencer program and receive a monthly fee for using their TradingView charts in my analysis.

GBPAUD: Liquidity Grab and Fair Value Gap RejectionPrice recently swept liquidity above a key level, grabbing stops resting above that range. Following that, it quickly reversed and left behind a clean Fair Value Gap , suggesting a possible shift in intent.
We are now watching price retrace into the FVG zone. If price reacts from there with a strong bearish confirmation candle like a bearish engulfing or another sign of rejection, we could see a continuation move lower. Our short-term target would be the previous day’s low.
This setup reflects how important it is to wait for confirmation and not chase the first reaction. Let price come to you and show its hand. Patience leads to clarity and better entries.
A trade without confirmation is just a guess. A trade with structure, confluence, and patience is a plan. Stay sharp.

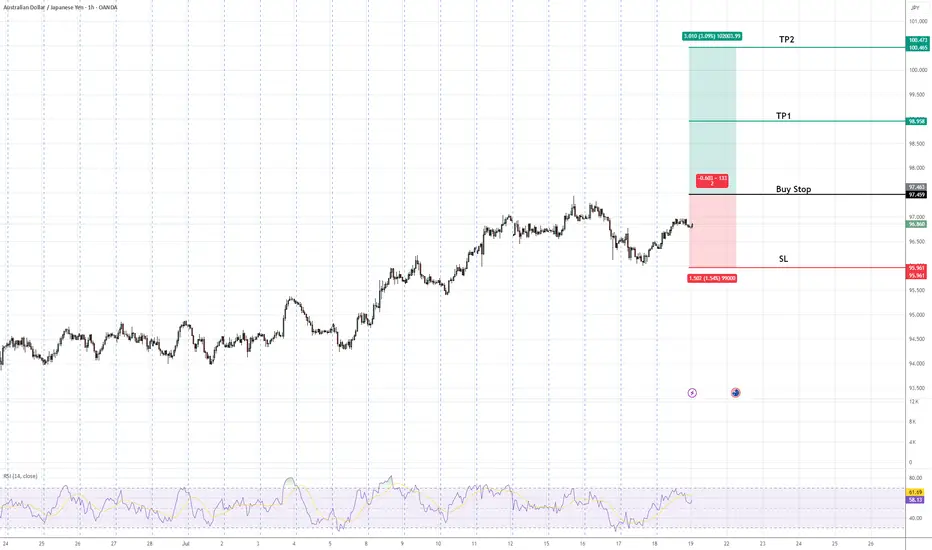
AUDJPY Buy Stop Setup | Trend Continuation in FocusAUDJPY is in an established uptrend, forming higher highs and higher lows. A buy stop is positioned above the recent swing high to confirm bullish continuation. The setup includes a defined stop-loss below the previous higher low to manage risk and two target profit levels (TP1 & TP2) aligned with key resistance zones. This approach favors trend-following traders seeking confirmation of upward momentum before entry.
EURUAD is in the Buy directionHello Traders
In This Chart EUR/AUD 4 HOURLY Forex Forecast By FOREX PLANET
today EUR/AUD analysis 👆
🟢This Chart includes_ (EUR/AUD market update)
🟢What is The Next Opportunity on EUR/AUD Market
🟢how to Enter to the Valid Entry With Assurance Profit
This CHART is For Trader's that Want to Improve Their Technical Analysis Skills and Their Trading By Understanding How To Analyze The Market Using Multiple Timeframes and Understanding The Bigger Picture on the Charts

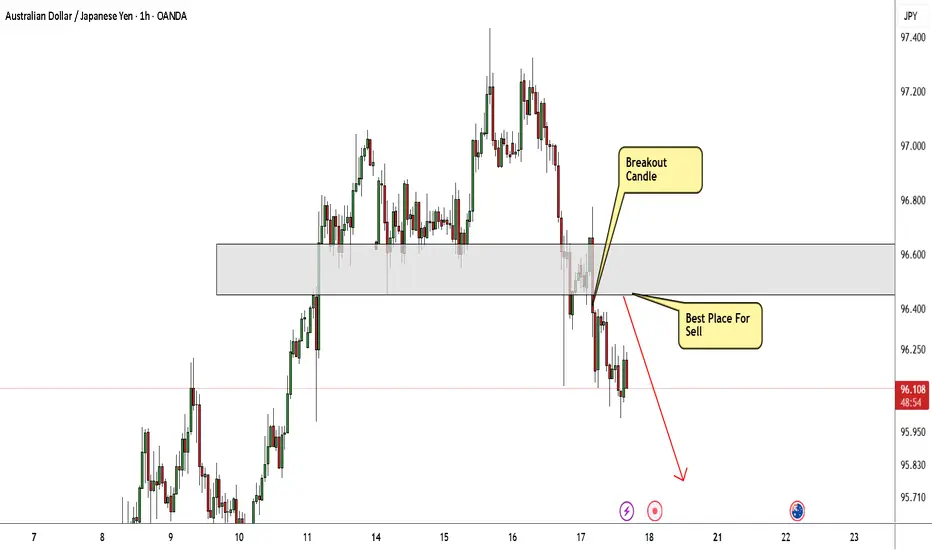
AUD/JPY Finally Decided To Go Down , Don`t Miss This 150 Pips !Here is my 1H Chart on AUD/JPY , And my opinion is we have a very clear breakout and the price will go down a little to make a retracement after this huge movement to upside without any correction , so i`, waiting the price to retest my broken supp and new Res and then we can enter a sell trade and targeting 100 : 150 pips . if the price go up again and closed above my res area with daily candle then this idea will not be valid anymore.
audnzd long trade in my opinion this is a good trade with a good r/r hope hit the tp consider this is my trade not your trade and i just like to share my trades with world


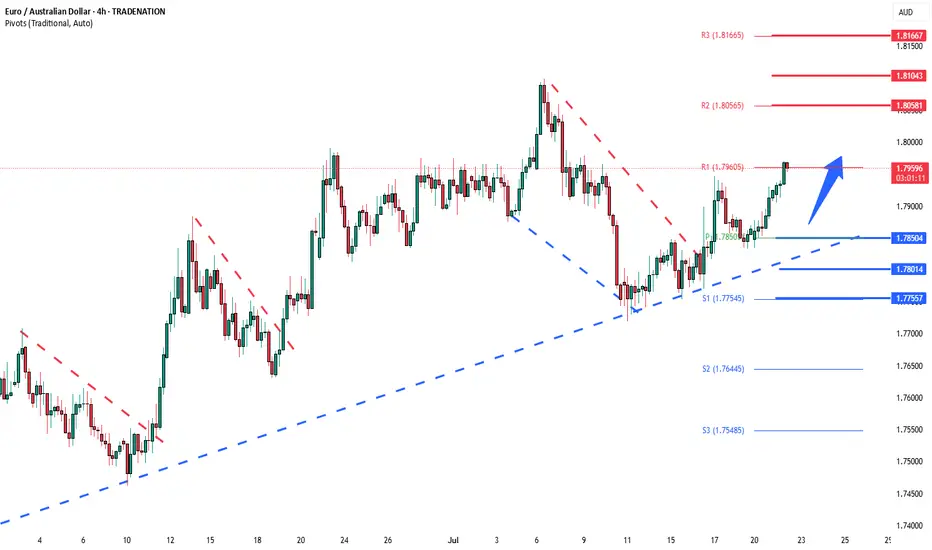
EURAUD Bullish breakout supported at 1.7650The EURAUD remains in a bullish trend, with recent price action indicating a continuation breakout within the broader uptrend.
Support Zone: 1.7850 – a key level from previous consolidation. Price is currently testing or approaching this level.
A bullish rebound from 1.7850 would confirm ongoing upside momentum, with potential targets at:
1.8060 – initial resistance
1.8100 – psychological and structural level
1.8165 – extended resistance on the longer-term chart
Bearish Scenario:
A confirmed break and daily close below 1.7850 would weaken the bullish outlook and suggest deeper downside risk toward:
1.7800 – minor support
1.7755 – stronger support and potential demand zone
Outlook:
Bullish bias remains intact while the EURAUD holds above 1.7850. A sustained break below this level could shift momentum to the downside in the short term.
This communication is for informational purposes only and should not be viewed as any form of recommendation as to a particular course of action or as investment advice. It is not intended as an offer or solicitation for the purchase or sale of any financial instrument or as an official confirmation of any transaction. Opinions, estimates and assumptions expressed herein are made as of the date of this communication and are subject to change without notice. This communication has been prepared based upon information, including market prices, data and other information, believed to be reliable; however, Trade Nation does not warrant its completeness or accuracy. All market prices and market data contained in or attached to this communication are indicative and subject to change without notice.
AUDCAD Q3 | D21 | W30 | Y25 📊AUDCAD Q3 | D21 | W30 | Y25
Daily Forecast 🔍📅
Here’s a short diagnosis of the current chart setup 🧠📈
Higher time frame order blocks have been identified — these are our patient points of interest 🎯🧭.
It’s crucial to wait for a confirmed break of structure 🧱✅ before forming a directional bias.
This keeps us disciplined and aligned with what price action is truly telling us.
📈 Risk Management Protocols
🔑 Core principles:
Max 1% risk per trade
Only execute at pre-identified levels
Use alerts, not emotion
Stick to your RR plan — minimum 1:2
🧠 You’re not paid for how many trades you take, you’re paid for how well you manage risk.
🧠 Weekly FRGNT Insight
"Trade what the market gives, not what your ego wants."
Stay mechanical. Stay focused. Let the probabilities work.
FRGNT 📊

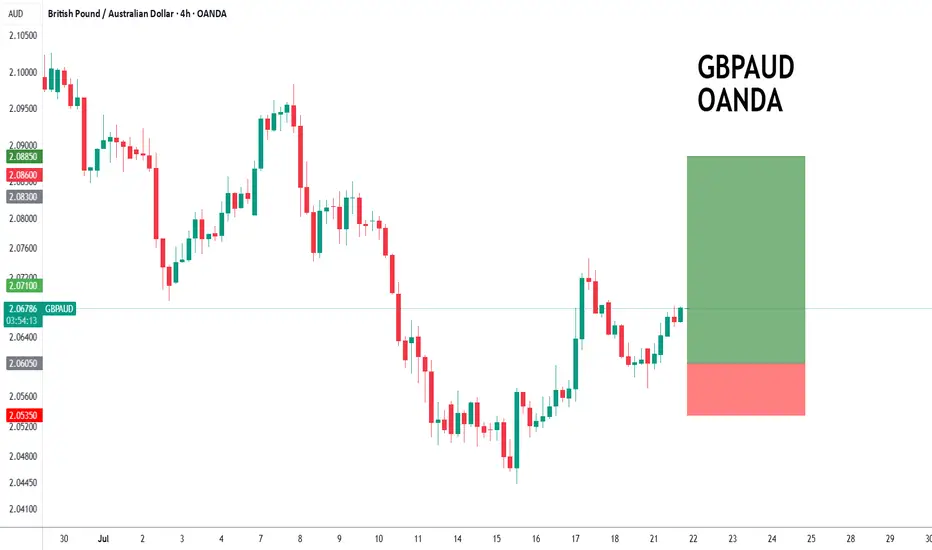
GBPAUD to find buyers at current support?GBPAUD - 24h expiry
The primary trend remains bullish.
Price action looks to be forming a bottom.
We look for a temporary move lower.
Preferred trade is to buy on dips.
Bespoke support is located at 2.0605.
We look to Buy at 2.0605 (stop at 2.0535)
Our profit targets will be 2.0885 and 2.0950
Resistance: 2.0750 / 2.0800 / 2.0970
Support: 2.0600 / 2.0520 / 2.0450
Risk Disclaimer
The trade ideas beyond this page are for informational purposes only and do not constitute investment advice or a solicitation to trade. This information is provided by Signal Centre, a third-party unaffiliated with OANDA, and is intended for general circulation only. OANDA does not guarantee the accuracy of this information and assumes no responsibilities for the information provided by the third party. The information does not take into account the specific investment objectives, financial situation, or particular needs of any particular person. You should take into account your specific investment objectives, financial situation, and particular needs before making a commitment to trade, including seeking advice from an independent financial adviser regarding the suitability of the investment, under a separate engagement, as you deem fit.
You accept that you assume all risks in independently viewing the contents and selecting a chosen strategy.
Where the research is distributed in Singapore to a person who is not an Accredited Investor, Expert Investor or an Institutional Investor, Oanda Asia Pacific Pte Ltd (“OAP“) accepts legal responsibility for the contents of the report to such persons only to the extent required by law. Singapore customers should contact OAP at 6579 8289 for matters arising from, or in connection with, the information/research distributed.
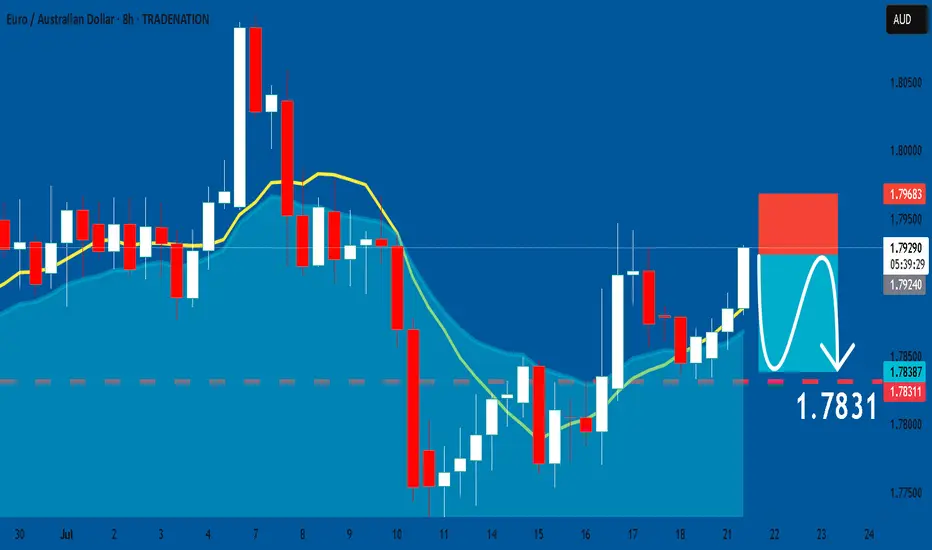
EURAUD: Short Signal Explained
EURAUD
- Classic bearish pattern
- Our team expects retracement
SUGGESTED TRADE:
Swing Trade
Sell EURAUD
Entry - 1.7924
Stop - 1.7968
Take - 1.7831
Our Risk - 1%
Start protection of your profits from lower levels
Disclosure: I am part of Trade Nation's Influencer program and receive a monthly fee for using their TradingView charts in my analysis.
❤️ Please, support our work with like & comment! ❤️
euraud long tradein my opinion this is a good trade with a good r/r
hope hit the tp
consider this is my trade not your trade and i just like to share my trades with world
