Bearish reversal off swing high resistance?AUD/JPY is rising towards the pivot, which acts as a swing high resistance and could potentially drop to the 50% Fibonacci support.
Pivot: 96.93
1st Support: 95.80
1st Resistance: 97.42
Risk Warning:
Trading Forex and CFDs carries a high level of risk to your capital and you should only trade with money you can afford to lose. Trading Forex and CFDs may not be suitable for all investors, so please ensure that you fully understand the risks involved and seek independent advice if necessary.
Disclaimer:
The above opinions given constitute general market commentary, and do not constitute the opinion or advice of IC Markets or any form of personal or investment advice.
Any opinions, news, research, analyses, prices, other information, or links to third-party sites contained on this website are provided on an "as-is" basis, are intended only to be informative, is not an advice nor a recommendation, nor research, or a record of our trading prices, or an offer of, or solicitation for a transaction in any financial instrument and thus should not be treated as such. The information provided does not involve any specific investment objectives, financial situation and needs of any specific person who may receive it. Please be aware, that past performance is not a reliable indicator of future performance and/or results. Past Performance or Forward-looking scenarios based upon the reasonable beliefs of the third-party provider are not a guarantee of future performance. Actual results may differ materially from those anticipated in forward-looking or past performance statements. IC Markets makes no representation or warranty and assumes no liability as to the accuracy or completeness of the information provided, nor any loss arising from any investment based on a recommendation, forecast or any information supplied by any third-party.
Aud-jpy

Bullish bounce off pullback support?AUD/JPY has bounced off the support level which is a pullback support and could bounce from this level to our take profit.
Entry: 96.14
Why we like it:
There is a pullback support.
Stop loss: 95.04
Why we like it:
There is a swing low support.
Take profit: 97.22
Why we like it:
There is a multi swing high resistance.
Enjoying your TradingView experience? Review us!
Please be advised that the information presented on TradingView is provided to Vantage (‘Vantage Global Limited’, ‘we’) by a third-party provider (‘Everest Fortune Group’). Please be reminded that you are solely responsible for the trading decisions on your account. There is a very high degree of risk involved in trading. Any information and/or content is intended entirely for research, educational and informational purposes only and does not constitute investment or consultation advice or investment strategy. The information is not tailored to the investment needs of any specific person and therefore does not involve a consideration of any of the investment objectives, financial situation or needs of any viewer that may receive it. Kindly also note that past performance is not a reliable indicator of future results. Actual results may differ materially from those anticipated in forward-looking or past performance statements. We assume no liability as to the accuracy or completeness of any of the information and/or content provided herein and the Company cannot be held responsible for any omission, mistake nor for any loss or damage including without limitation to any loss of profit which may arise from reliance on any information supplied by Everest Fortune Group.

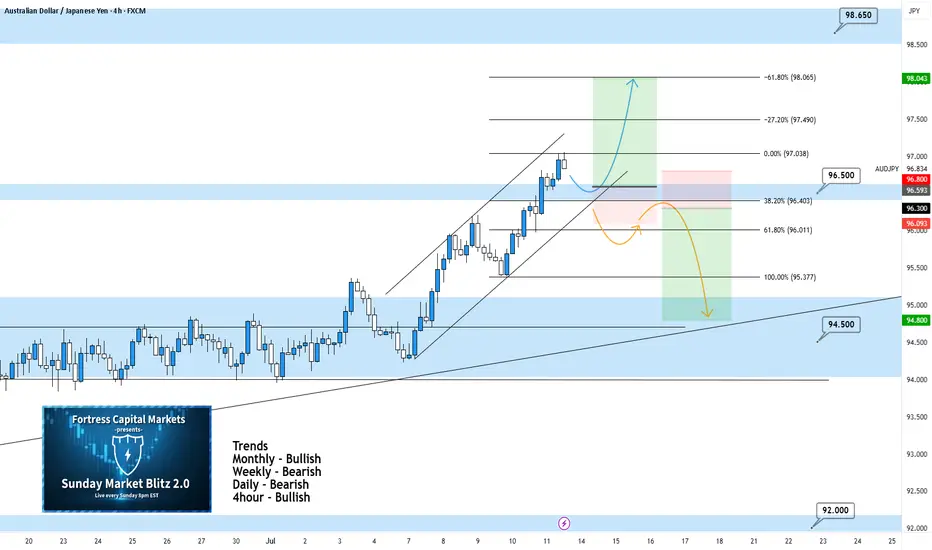
AUDJPY 4Hour TF - August 10th,2025🟦 AUDJPY 4H Analysis
📅 August 10, 2025
Top-Down Trend Bias:
• Monthly – Bullish
• Weekly – Bullish
• Daily – Bullish
• 4H – Bearish
AUDJPY pushed above 96.15 resistance zone after a short term bullish correction. Higher timeframes remain bullish, but the 4H could still show signs of further bearish movement.
🔍 Key Zone: 96.15
This zone has acted as support and resistance in the past and will be the deciding area for the next directional move.
✅ Scenario A: Bullish Breakout (Blue Path)
1.If price holds above 96.150 area
2.Look for continuation into 97.20 support
This would align with the higher timeframe bullish bias
⚠️ Scenario B: Bearish Rejection (Orange Path)
1.If price breaks and holds below 96.150
2.Watch for bearish confirmation (engulfing, LTF BOS, rejection wicks)
Target: 94.50 support zone
This would maintain the current 4H bearish structure despite the bullish HTF backdrop.
🧠 Final Notes
• 96.15 is the short term decision point for both buyers and sellers
• HTFs favor longs, but sellers may control the 4H
• Confirmation at the zone is key before taking either direction

AUDJPY SELL SETUP SHOOOOOOOOOOOOOORTTHE Price now on resistance level
and it shaped head and shoulder on time frame 2H and take inducement so i expect shoort

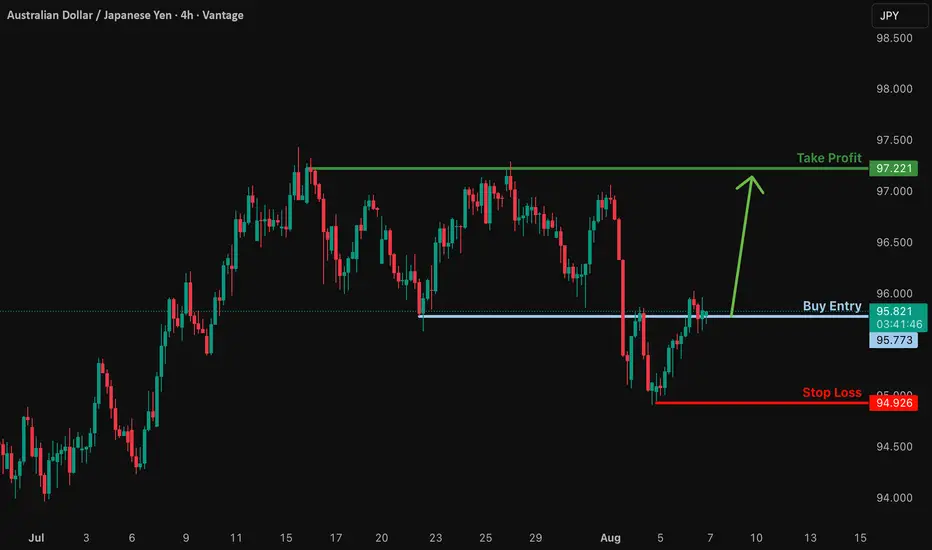
Bullish rise?AUD/JPY is reacting off the support level which is an overlap support and could bounce from this level to our take profit.
Entry: 95.77
Why we like it:
There is an overlap support.
Stop loss: 94.92
Why we like it:
There is a swing low support.
Take profit: 97.22
Why we like it:
There is a multi swing high resistance.
Enjoying your TradingView experience? Review us!
Please be advised that the information presented on TradingView is provided to Vantage (‘Vantage Global Limited’, ‘we’) by a third-party provider (‘Everest Fortune Group’). Please be reminded that you are solely responsible for the trading decisions on your account. There is a very high degree of risk involved in trading. Any information and/or content is intended entirely for research, educational and informational purposes only and does not constitute investment or consultation advice or investment strategy. The information is not tailored to the investment needs of any specific person and therefore does not involve a consideration of any of the investment objectives, financial situation or needs of any viewer that may receive it. Kindly also note that past performance is not a reliable indicator of future results. Actual results may differ materially from those anticipated in forward-looking or past performance statements. We assume no liability as to the accuracy or completeness of any of the information and/or content provided herein and the Company cannot be held responsible for any omission, mistake nor for any loss or damage including without limitation to any loss of profit which may arise from reliance on any information supplied by Everest Fortune Group.
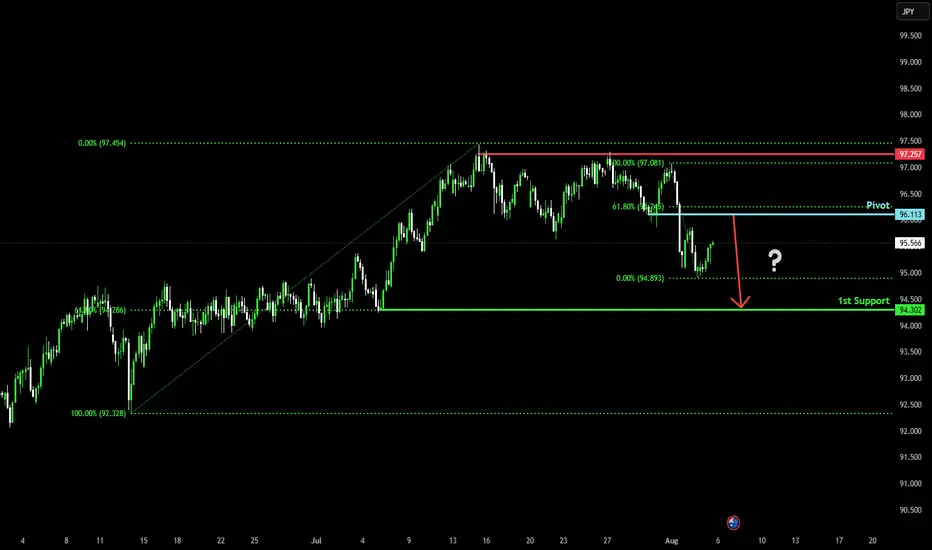
Bearish reversal off 61.8% Fibonacci resistance?AUD/JPY is rising towards the pivot which acts as a pullback resistance and could reverse to the 1st support, which aligns with the 61.8% Fibonacci retracement.
Pivot: 96.11
1st Support: 94.30
1st Resistance: 97.25
Risk Warning:
Trading Forex and CFDs carries a high level of risk to your capital and you should only trade with money you can afford to lose. Trading Forex and CFDs may not be suitable for all investors, so please ensure that you fully understand the risks involved and seek independent advice if necessary.
Disclaimer:
The above opinions given constitute general market commentary, and do not constitute the opinion or advice of IC Markets or any form of personal or investment advice.
Any opinions, news, research, analyses, prices, other information, or links to third-party sites contained on this website are provided on an "as-is" basis, are intended only to be informative, is not an advice nor a recommendation, nor research, or a record of our trading prices, or an offer of, or solicitation for a transaction in any financial instrument and thus should not be treated as such. The information provided does not involve any specific investment objectives, financial situation and needs of any specific person who may receive it. Please be aware, that past performance is not a reliable indicator of future performance and/or results. Past Performance or Forward-looking scenarios based upon the reasonable beliefs of the third-party provider are not a guarantee of future performance. Actual results may differ materially from those anticipated in forward-looking or past performance statements. IC Markets makes no representation or warranty and assumes no liability as to the accuracy or completeness of the information provided, nor any loss arising from any investment based on a recommendation, forecast or any information supplied by any third-party.
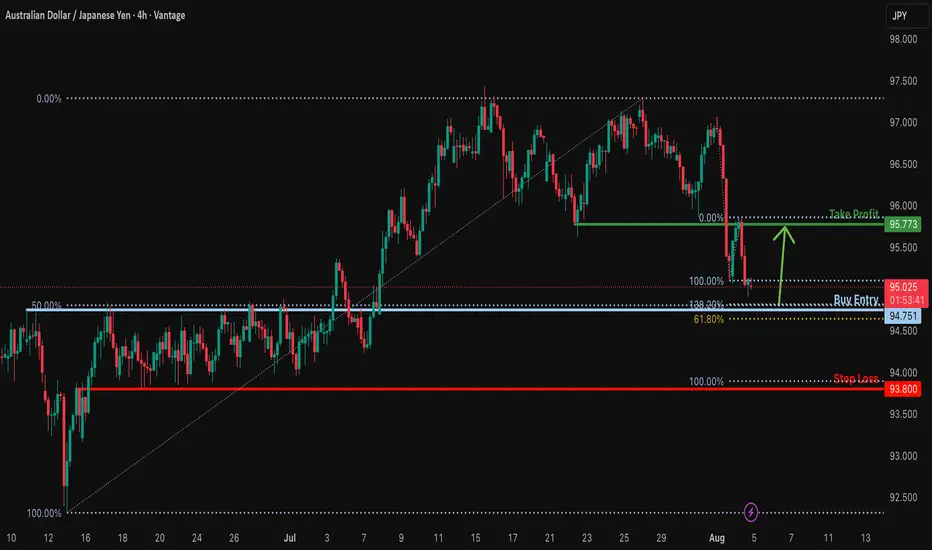
Bullish reversal off Fibonacci confluence?AUD/JPY is falling towards a support level, which is a pullback support aligning with the 138.2% Fibonacci extension, the 50% Fibonacci retracement, and the 61.8% Fibonacci projection. A bounce from this level could push the price toward our take-profit target.
Entry: 94.75
Why we like it:
There is a pullback support level that aligns with the 50% Fibonacci retracement, the 138.2% Fibonacci extension and the 61.8% Fibonacci projection.
Stop loss: 93.80
Why we like it:
There is a pullback support that lines up witht he 100% Fibonacci projection.
Takeprofit: 95.77
Why we like it:
There is an overlap resistance.
Enjoying your TradingView experience? Review us!
Please be advised that the information presented on TradingView is provided to Vantage (‘Vantage Global Limited’, ‘we’) by a third-party provider (‘Everest Fortune Group’). Please be reminded that you are solely responsible for the trading decisions on your account. There is a very high degree of risk involved in trading. Any information and/or content is intended entirely for research, educational and informational purposes only and does not constitute investment or consultation advice or investment strategy. The information is not tailored to the investment needs of any specific person and therefore does not involve a consideration of any of the investment objectives, financial situation or needs of any viewer that may receive it. Kindly also note that past performance is not a reliable indicator of future results. Actual results may differ materially from those anticipated in forward-looking or past performance statements. We assume no liability as to the accuracy or completeness of any of the information and/or content provided herein and the Company cannot be held responsible for any omission, mistake nor for any loss or damage including without limitation to any loss of profit which may arise from reliance on any information supplied by Everest Fortune Group.
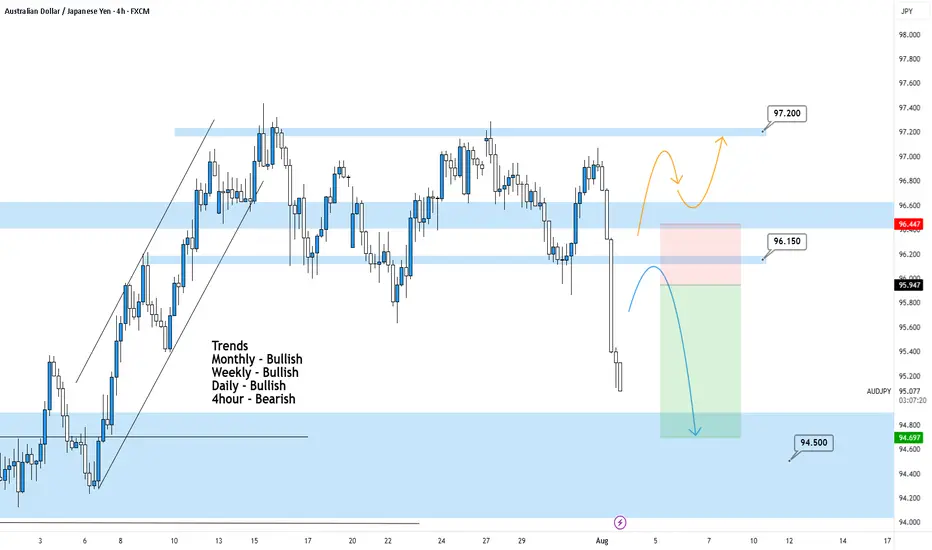
AUDJPY 4Hour TF - August 3rd,2025🟦 AUDJPY 4H Analysis Bearish Idea
📅 August 3rd, 2025
🔹 Top-Down Trend Bias:
• Monthly – Bullish
• Weekly – Bullish
• Daily – Bullish
• 4H – Bearish
AUDJPY has broken cleanly below prior structure around 96.15, signaling short term bearish momentum within a higher timeframe bullish environment. Price is currently approaching key decision zones.
🔍 Key Zone: 96.15 – 96.45
This former support zone may now act as a bearish retest area and new resistance. This offers a potential entry for continuation plays if structure holds below.
✅ Scenario A: Bearish Continuation (Blue Path)
1.If price retests and rejects from 96.15–96.45
2.Look for bearish confirmation (rejection wicks, engulfing, LTF structure shift)
Target: 94.50
This setup is trend aligned with current 4H momentum and offers a clean structure based downside.
⚠️ Scenario B: Bullish Reclaim (Orange Path)
1.If price breaks and holds above 96.45
2.Could signal a shift back toward higher timeframe bullish continuation
Target: 97.20 resistance zone
This is a counter-trend idea on the 4H and requires confirmation
🧠 Final Notes
• Short-term bearish bias while price remains below 96.45
• Let the retest confirm the direction
• Clean structure = clean setups
AUD/JPY bulls eye 99, 100The yen is broadly weaker, which is even allowing a weaker Australian dollar to rise. And with a decent bullish trend on the daily chart, I am now seeking dips within a recent consolidation range in anticipation of a move to 99 or even 100.
Matt Simpson, Market Analyst at City Index and Forex.com

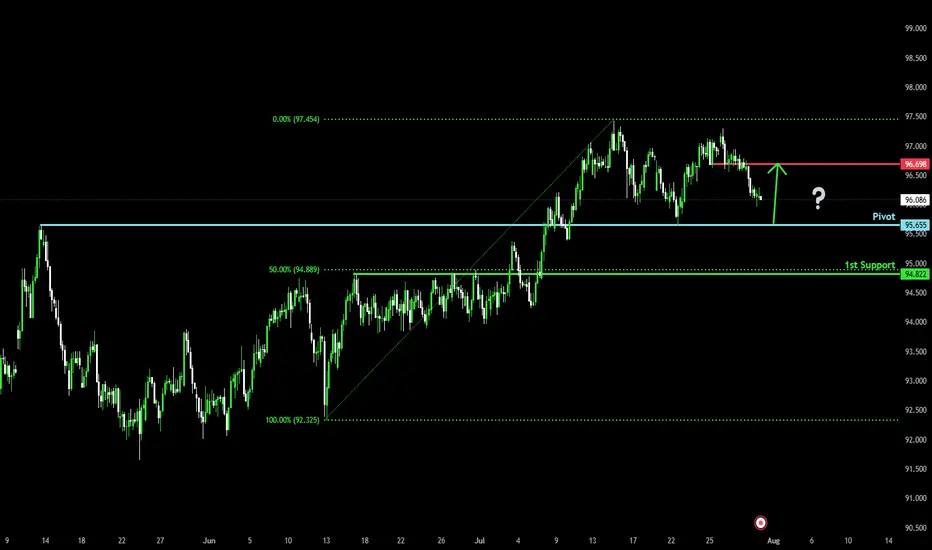
Falling towards overlap support?AUD/JPY is falling towards the pivot, which has been identified as an overlap support and could bounce to the 1st resistance.
Pivot: 95.65
1st Support: 94.82
1st Resistance: 96.69
Risk Warning:
Trading Forex and CFDs carries a high level of risk to your capital and you should only trade with money you can afford to lose. Trading Forex and CFDs may not be suitable for all investors, so please ensure that you fully understand the risks involved and seek independent advice if necessary.
Disclaimer:
The above opinions given constitute general market commentary, and do not constitute the opinion or advice of IC Markets or any form of personal or investment advice.
Any opinions, news, research, analyses, prices, other information, or links to third-party sites contained on this website are provided on an "as-is" basis, are intended only to be informative, is not an advice nor a recommendation, nor research, or a record of our trading prices, or an offer of, or solicitation for a transaction in any financial instrument and thus should not be treated as such. The information provided does not involve any specific investment objectives, financial situation and needs of any specific person who may receive it. Please be aware, that past performance is not a reliable indicator of future performance and/or results. Past Performance or Forward-looking scenarios based upon the reasonable beliefs of the third-party provider are not a guarantee of future performance. Actual results may differ materially from those anticipated in forward-looking or past performance statements. IC Markets makes no representation or warranty and assumes no liability as to the accuracy or completeness of the information provided, nor any loss arising from any investment based on a recommendation, forecast or any information supplied by any third-party.
AUDJPY – DAILY FORECAST Q3 | W31 | D30 | Y25
📊 AUDJPY – DAILY FORECAST
Q3 | W31 | D30 | Y25
Daily Forecast 🔍📅
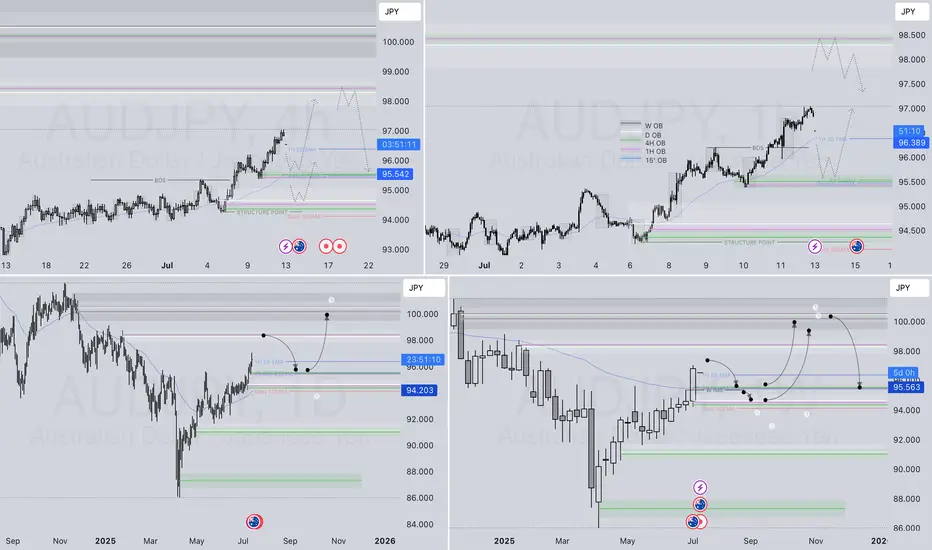
Here’s a short diagnosis of the current chart setup 🧠📈
Higher time frame order blocks have been identified — these are our patient points of interest 🎯🧭.
It’s crucial to wait for a confirmed break of structure 🧱✅ before forming a directional bias.
This keeps us disciplined and aligned with what price action is truly telling us.
📈 Risk Management Protocols
🔑 Core principles:
Max 1% risk per trade
Only execute at pre-identified levels
Use alerts, not emotion
Stick to your RR plan — minimum 1:2
🧠 You’re not paid for how many trades you take, you’re paid for how well you manage risk.
🧠 Weekly FRGNT Insight
"Trade what the market gives, not what your ego wants."
Stay mechanical. Stay focused. Let the probabilities work.
FX:AUDJPY

AUDJPY 4Hour TF - July 27th, 2025AUDJPY 7/27/2025
AUDJPY 4hour Bullish Idea
Monthly - Bullish
Weekly - Bullish
Dailly - Bullish
4hour - Bullish
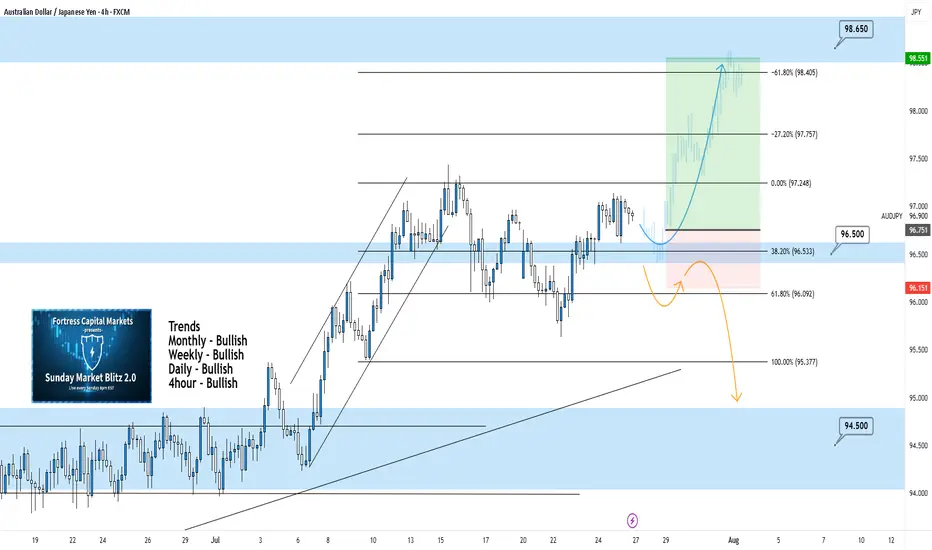
We’re looking bullish again on AUDJPY for the week ahead, but will it stick? The overall higher timeframes suggest we are bullish as well but we will need to see key structure before entering any trades. Let’s take a look at two potential scenarios we would want to see happen this week.
Bullish Continuation - We ended last week in a perfect spot, right above our 96.500 zone. This leaves us in a position for a potential long opportunity where we only need to see 1 or two more forms of confirmation.
Look for our 96.500 zone to be tested and held as support. If this happens and we can confirm a higher low above 96.500 we’ll be looking to enter and target higher toward major levels of resistance like 98.650.
Bearish Reversal - For us to consider AJ bearish again we would need to see a strong break below the current zone at 96.500.
Look for signs of structure (LL, LH) to form below the current zone. If this happens we can consider targeting lower toward major levels of support like 94.500
AUDJPY Q3 | D24 | W30 | Y25📊AUDJPY Q3 | D24 | W30 | Y25
Daily Forecast🔍📅
Here’s a short diagnosis of the current chart setup 🧠📈
Higher time frame order blocks have been identified — these are our patient points of interest 🎯🧭.
It’s crucial to wait for a confirmed break of structure 🧱✅ before forming a directional bias.
This keeps us disciplined and aligned with what price action is truly telling us.
📈 Risk Management Protocols
🔑 Core principles:
Max 1% risk per trade
Only execute at pre-identified levels
Use alerts, not emotion
Stick to your RR plan — minimum 1:2
🧠 You’re not paid for how many trades you take, you’re paid for how well you manage risk.
🧠 Weekly FRGNT Insight
"Trade what the market gives, not what your ego wants."
Stay mechanical. Stay focused. Let the probabilities work.
FRGNT

AUDJPY Q3 | D21 | W30 | Y25📊AUDJPY Q3 | D21 | W30 | Y25
Daily Forecast 🔍📅
Here’s a short diagnosis of the current chart setup 🧠📈
Higher time frame order blocks have been identified — these are our patient points of interest 🎯🧭.
It’s crucial to wait for a confirmed break of structure 🧱✅ before forming a directional bias.
This keeps us disciplined and aligned with what price action is truly telling us.
📈 Risk Management Protocols
🔑 Core principles:
Max 1% risk per trade
Only execute at pre-identified levels
Use alerts, not emotion
Stick to your RR plan — minimum 1:2
🧠 You’re not paid for how many trades you take, you’re paid for how well you manage risk.
🧠 Weekly FRGNT Insight
"Trade what the market gives, not what your ego wants."
Stay mechanical. Stay focused. Let the probabilities work.
FRGNT 📊

AUDJPY 4Hour TF - July 20th,2025AUDJPY 7/20/2025
AUDJPY 4hour Bullish Idea
Monthly - Bullish
Weekly - Bearish
Dailly - Bullish
4hour - Bullish
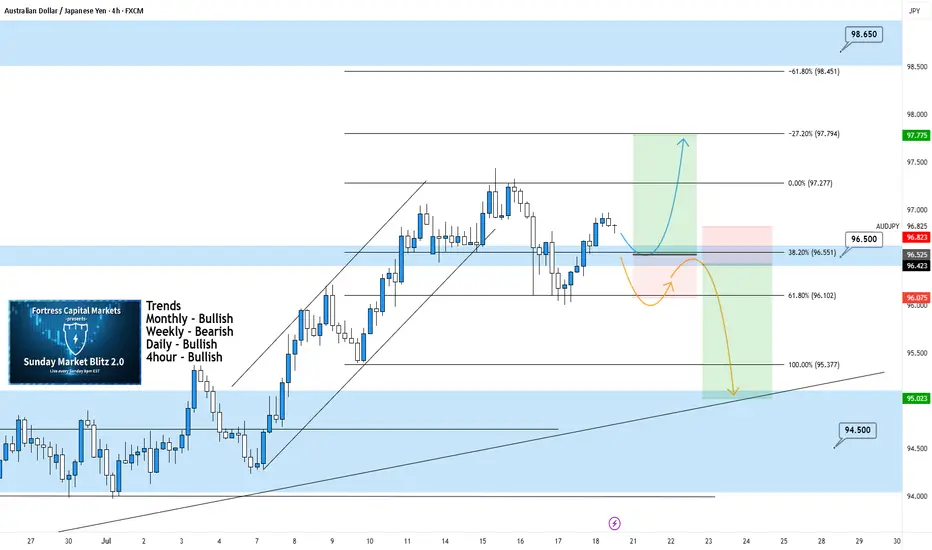
We’re looking mostly bullish on AJ going into this week but will this 96.500 hold as support? Let’s take a look at two potential scenarios for the week ahead:
Bullish Continuation - This is the most likely for AU this week according to the trends in play. For us to get confident in long scenarios, we would like to see strong bullish rejection from support around 96.500. If this happens look to target higher toward our negative fib levels and key resistance.
Bearish Reversal - For us to consider AJ bearish for the week, we would need to see some bearish pressure step in and push us below 96.500. If this happens we only need confirmation in the form of a lower high below 96.500.
Look to target lower toward major support levels like 94.500 area if this happens.
AUDJPY LONG & SHORT – WEEKLY FORECAST Q3 | W29 | Y25💼 AUDJPY LONG & SHORT – WEEKLY FORECAST
Q3 | W29 | Y25
📊 MARKET STRUCTURE SNAPSHOT
AUD JPY is currently reaching for a key higher time frame supply zone, looking for price action to show weakness at premium levels. Structure and momentum are now aligning for a short opportunity backed by multi-timeframe confluence.
🔍 Confluences to Watch 📝
✅ Daily Order Block (OB)
Looking for Strong reaction and early signs of distribution.
✅ 4H Order Block
Break of internal structure (iBoS) confirms a short-term bearish transition.
✅ 1H Order Block
📈 Risk Management Protocols
🔑 Core principles:
Max 1% risk per trade
Only execute at pre-identified levels
Use alerts, not emotion
Stick to your RR plan — minimum 1:2
🧠 You’re not paid for how many trades you take, you’re paid for how well you manage risk.
🧠 Weekly FRGNT Insight
"Trade what the market gives, not what your ego wants."
Stay mechanical. Stay focused. Let the probabilities work.
🏁 Final Thoughts from FRGNT
📌 The structure is clear.
The confluences are stacked.
Let execution follow discipline, not emotion.
AUDJPY 4Hour TF - July 13th, 2025AUDJPY 7/13/2025
AUDJPY 4hour Bullish Idea
Monthly - Bullish
Weekly - Bearish
Dailly - Bearish
4hour - Bullish
Looking good on AJ! Last week’s analysis played out perfectly and we can see going into this week we have a similar scenario.
Here are the two potential trade paths for the week ahead:
Bullish Continuation - This is the most likely scenario going into this week as we just broke our 96.500 resistance and are now testing it as support. If we can confirm a higher low with strong bullish conviction we can look to enter long and target higher toward major resistance levels.
Bearish Reversal - For us to consider AJ bearish we would first need to see a break back below 96.500. If we can spot a clear trend change and some lower highs below 96.500 we can begin looking short. Target lower toward major support levels if this happens.
AUDJPY SHORT FORECAST Q3 D8 W28 Y25AUDJPY SHORT FORECAST Q3 D8 W28 Y25
Professional Risk Managers👋
Welcome back to another FRGNT chart update📈
Diving into some Forex setups using predominantly higher time frame order blocks alongside confirmation breaks of structure.
Let’s see what price action is telling us today! 👀
🔑 Remember, to participate in trading comes always with a degree of risk, therefore as professional risk managers it remains vital that we stick to our risk management plan as well as our trading strategies.
📈The rest, we leave to the balance of probabilities.
💡Fail to plan. Plan to fail.
🏆It has always been that simple.
❤️Good luck with your trading journey, I shall see you at the very top.
🎯Trade consistent, FRGNT X

AUDJPY – Trade the Range… Until It EndsHello TradingView Family / Fellow Traders. This is Richard, also known as theSignalyst.
📈AUDJPY has been trading within a big range marked in red.
Moreover, the it is retesting the lower bound of its rising channel marked in blue.
🏹 Thus, the highlighted blue circle is a strong area to look for buy setups as it is the intersection of support and lower blue trendline acting as a non-horizontal support.
📚 As per my trading style:
As #AUDJPY approaches the blue circle zone, I will be looking for bullish reversal setups (like a double bottom pattern, trendline break , and so on...)
📚 Always follow your trading plan regarding entry, risk management, and trade management.
Good luck!
All Strategies Are Good; If Managed Properly!
~Rich
Disclosure: I am part of Trade Nation's Influencer program and receive a monthly fee for using their TradingView charts in my analysis.

AUDJPY 4hour TF - June 29th, 2025AUDJPY 4hour Neutral Idea
Monthly - Bullish
Weekly - Bearish
Dailly - Bearish
4hour - Ranging
AJ is currently sitting at a major daily resistance area around 94.500. We have to wait for price action to make a move and show some conviction before we can become confident in a setup.
Lucky us, price action is usually easy to follow when waiting for a break of a range. The way I see it, we have two great options.
Bullish Breakout - In the scenario where we see price action break above the 94.500 zone we will look for long setups. Ideally, we spot some clear higher lows above 94.500 with strong bullish conviction. Look to target higher resistance levels like 96.500.
Bearish Continuation - If we see this resistance level at 94.500 continue to hold we could see a daily bearish continuation happen. Look for strong bearish candles rejecting the current zone followed by clear lower highs. We’re targeting lower if that happens to around the 92.000 area.

AUD/JPY at Risk of Breakdown as Bullish Momentum FadesAUD/JPY failed to follow through on a bullish breakout above 94.00, despite initial signs of strength from a bullish hammer and inverted H&S pattern. The pair has since printed a bearish engulfing candle on the daily chart to take prices near the lows of its range of the past week.
With the 1-hour RSI (2) hitting oversold levels, a minor bounce is possible, but risks remain skewed to the downside. A break beneath 93.70 would confirm a range breakdown and open the door to a deeper pullback towards the high-volume node (HVN) at 93.85.
Matt Simpson, Market Analyst at City Index and Forex.com.

AUDJPY - Potential Short at the upper supply liquidity levelLooking for the potential short, only valid with bearish PA around the upper supply level, ideally sweeping the upper level of liquidity around 94.400-94.405. Bearish PA then bring this trade down.

AUDJPY: Sell opportunity.AUDJPY is basically neutral on its 1D technical outlook (RSI = 56.422, MACD = 0.430, ADX = 19.989), ranging inside the 1D MA200 and 1D MA50 since the start of May. The last bullish wave top of the Channel Down got rejected around those levels and targeted the S1 Zone. Short, TP = 90.150.
## If you like our free content follow our profile to get more daily ideas. ##
## Comments and likes are greatly appreciated. ##
