AUDJPY facing bearish pressure | 6th Aug 2021Price is reversing from the sell entry at 81.352 at 61.8% Fibonacci retracement towards our take profit at 80.598 in line with 61.8 Fibonacci retracement and extension. Otherwise price may rise to stop loss at 81.656 in line with 78.6% Fibonacci extension .
Any opinions, news, research, analyses, prices, other information, or links to third-party sites contained on this website are provided on an "as-is" basis, as general market commentary and do not constitute investment advice. The market commentary has not been prepared in accordance with legal requirements designed to promote the independence of investment research, and it is therefore not subject to any prohibition on dealing ahead of dissemination. Although this commentary is not produced by an independent source, FXCM takes all sufficient steps to eliminate or prevent any conflicts of interests arising out of the production and dissemination of this communication. The employees of FXCM commit to acting in the clients' best interests and represent their views without misleading, deceiving, or otherwise impairing the clients' ability to make informed investment decisions. For more information about the FXCM's internal organizational and administrative arrangements for the prevention of conflicts, please refer to the Firms' Managing Conflicts Policy. Please ensure that you read and understand our Full Disclaimer and Liability provision concerning the foregoing Information, which can be accessed on the website.
Aud-jpy

AUDJPYReal nice risk reward set up in AUDJPY, Potential to long for 1:6 Risk reward. Wait for hourly confirmation.

AUDJPY Facing Bearish Pressure | 2 Aug 2021AUD/JPY is holding below the descending trendline and approaching the sell entry at 80.181 which is in line with our horizontal overlap resistance and 23.6% Fibonacci retracement . Price is likely to resist off this level to take support at 79.443 in line with -27.2 % Fibonacci retracement . Our bearish view is further strengthen by how price is holding below the EMA as well as by how MACD is holding below 0.
Any opinions, news, research, analyses, prices, other information, or links to third-party sites contained on this website are provided on an "as-is" basis, as general market commentary and do not constitute investment advice. The market commentary has not been prepared in accordance with legal requirements designed to promote the independence of investment research, and it is therefore not subject to any prohibition on dealing ahead of dissemination. Although this commentary is not produced by an independent source, FXCM takes all sufficient steps to eliminate or prevent any conflicts of interests arising out of the production and dissemination of this communication. The employees of FXCM commit to acting in the clients' best interests and represent their views without misleading, deceiving, or otherwise impairing the clients' ability to make informed investment decisions. For more information about the FXCM's internal organizational and administrative arrangements for the prevention of conflicts, please refer to the Firms' Managing Conflicts Policy. Please ensure that you read and understand our Full Disclaimer and Liability provision concerning the foregoing Information, which can be accessed on the website.


AUDJPY 4hour Analysis August 1st, 2021AUDJPY Bearish idea
Weekly Trend: Bearish
Daily Trend: Bearish
4Hour Trend: Bearish
Trade scenario 1: Definitely looking bearish this week! We currently can spot a potential perfect setup already.
From the current level we’re looking for price action to retest broken support at 80.750 to confirm a lower high. Look to enter short on confirmation of the lower high and target lower toward key support levels.
Trade scenario 2: For us to consider AJ bullish we would need to see a transition of 81.400 resistance. If we can spot a higher low above this level we will look to enter long and target high resistance levels.

AJ more downside should be coming...short short
Hello there!
If you like my analysis and it helped you ,do give me a thumbs ups on tradingview! 🙏
And if you would like to show further support for me, you can gift me some coins on tradingview! 😁
Thank you!
Disclaimers:
The analysis shared through this channel are purely for educational and entertainment purposes only. They are by no means professional advice for individual/s to enter trades for investment or trading purposes.
The author/producer of these content shall not and will not be responsible for any form of financial/physical/assets losses incurred from trades executed from the derived conclusion of the individual from these content shared.
Thank you, and please do your due diligence before any putting on any trades!

AUD/JPY:UPDATE PRICE ACTION+FIBO ANALISYS|DOWNTREND|SHORT 🔔The forecast for the AUD/JPY remains bearish as global economic indicators point towards weaker than expected performance. Traders should expect more volatile trading after the Tenkan-sen, and the Kijun-sen, turned sideways, with the Ichimoku Kinko Hyo Cloud extending its descend.
Check the Links in Description and If you LIKE this analysis, Please support our page and Ideas by hitting the LIKE 👍 button
Traders, if you like this idea or have your own opinion about it, please write your own in the comment box . We will be glad for this.
Feel free to request any pair/instrument analysis or ask any questions in the comment section below.
Have a Good Day Trading !

AUD/JPY:DOWNTREND|PRICE ACTION+FIBO ANALISYS|SHORT IDEA 🔔Welcome back Traders, Investors, and Community!
Check the Links in Description and If you LIKE this analysis, Please support our page and Ideas by hitting the LIKE 👍 button
Traders, if you like this idea or have your own opinion about it, please write your own in the comment box . We will be glad for this.
Feel free to request any pair/instrument analysis or ask any questions in the comment section below.
Have a Good Day Trading !

AUDJPY facing bullish pressure | 28 July 2021Appears that price is likely to take support and bounce up from the 80.689 level which is in line with the 50% Fibonacci retracement, 127.2% Fibonacci retracement as well as the horizontal overlap resistance. Price is expected to rise until the horizontal swing high at 81.516 which is also in line with the 100% Fibonacci extension level. Our bullish bias is further confirmed by how the MACD is holding above the 0 line.
Any opinions, news, research, analyses, prices, other information, or links to third-party sites contained on this website are provided on an "as-is" basis, as general market commentary, and do not constitute investment advice. The market commentary has not been prepared in accordance with legal requirements designed to promote the independence of investment research, and it is therefore not subject to any prohibition on dealing ahead of dissemination. Although this commentary is not produced by an independent source, FXCM takes all sufficient steps to eliminate or prevent any conflicts of interest arising out of the production and dissemination of this communication. The employees of FXCM commit to acting in the clients' best interests and represent their views without misleading, deceiving, or otherwise impairing the clients' ability to make informed investment decisions. For more information about the FXCM's internal organizational and administrative arrangements for the prevention of conflicts, please refer to the Firms' Managing Conflicts Policy. Please ensure that you read and understand our Full Disclaimer and Liability provision concerning the foregoing Information, which can be accessed on the website.

AUDJPY facing bearish pressure | 27th July 2021Price currently approaching the horizontal overlap support which is in line with the 50% Fibonacci retracement as well at the 38.2% Fibonacci extension. Should price break that level, we can expect it to plunge further to take support at the 79.819 level which is in line with the horizontal swing low support and the 78.6% Fibonacci extension level. Our bearish bias is further supported by how MACD is below the 0 line.
Any opinions, news, research, analyses, prices, other information, or links to third-party sites contained on this website are provided on an "as-is" basis, as general market commentary, and do not constitute investment advice. The market commentary has not been prepared in accordance with legal requirements designed to promote the independence of investment research, and it is therefore not subject to any prohibition on dealing ahead of dissemination. Although this commentary is not produced by an independent source, FXCM takes all sufficient steps to eliminate or prevent any conflicts of interest arising out of the production and dissemination of this communication. The employees of FXCM commit to acting in the clients' best interests and represent their views without misleading, deceiving, or otherwise impairing the clients' ability to make informed investment decisions. For more information about the FXCM's internal organizational and administrative arrangements for the prevention of conflicts, please refer to the Firms' Managing Conflicts Policy. Please ensure that you read and understand our Full Disclaimer and Liability provision concerning the foregoing Information, which can be accessed on the website.

AUDJPY ANALYSISAUDJPY broke minor downtrendline
RSI is above level 50
we r waiting for price to exceed the key level at 81.60 to open long trade
It's expected to target a major downtrendline near level 83.40

AUDJPY 4hour Analysis July 24th, 2021AUDJPY Bearish idea
Weekly Trend: Bearish
Daily Trend: Bearish
4Hour Trend: Bearish
Trade scenario 1: Looking overall bearish on this pair as well but structure is not yet that clear.
We know we’re looking for short positions after we can confirm a lower high and that can happen at two major places on this chart.
At the current level we could see a reversal with some good short entry opportunities or we could see price action retrace some more.
We could see a deeper reversal happen around our 82.200 resistance level before price action continues with the bearish sentiment. Keep this in mind and watch for the right confirmations at either levels.
Trade scenario 2: For us to consider AJ bullish we would ideally need to see a break above resistance around 82.200 with a confirmed higher low.
If this happens we’ll look to target toward higher resistance levels.


AUDJPY 4hour Analysis July 18th, 2021AUDJPY Bearish idea
Weekly Trend: Bearish
Daily Trend: Bearish
4Hour Trend: Bearish
Trade scenario 1: We are still looking very bearish here on AJ and it looks like it will be continuing with this trend.
From where current price action is it will either push lower with strong bearish momentum or price action will pull back to a resistance level before dropping.
Either way we’re looking to target our -27% fib level once we can confirm our next lower high and enter on strong bearish setups.
Trade scenario 2: For us to consider AJ bullish we need to see a lot from price action. Ideally, a break above 82.200 with some clean higher lower setups would be enough to mark up some long positions.

AUD/JPY Short Setup formingAUD/JPY Patience is key, wait for the confirmation of the short.
Key area 81.34:- waiting for this level to break and then a confirmation of the resistance re-test level will confirm a short entry. This will confirm a clone movement to the downside.

AUD/JPY 2H Technical analysis It's just my opinion about this pair.
Please share your thoughts with me.

AUDJPY ANALYSISAUDJPY is trading in downtrend
Price broke corrective uptrendline
Strong bearish wave (a) ended at level 81.35 then corrective bullish wave (b) rejected from key level corresponding to 50% Fibonacci level at 82.75
Below SMA 100
MACD shows bearish momentum
we r waiting price to break support level at 82.05 to open short trade
It's expected forming bearish wave (c) to target support level at 80.00

AUDJPY 4hour Analysis July 11th, 2021AUDJPY Bearish idea
Weekly Trend: Bearish
Daily Trend: Bearish
4Hour Trend: Bearish
Trade scenario 1: This pair also is bearish across all major timeframes and we plan to look for continuations supporting this trend.
Ideally we see a lower high form right now near 82.200 followed by strong bearish setups to enter short on. Look to target lower toward major support levels and negative fib levels.
Trade scenario 2: For us to consider AJ bullish we would need to see a break of resistance near 83.250, our weekly zone, with a higher low above.
This means price action is generally bearish until we see this break happen.

Breakout Identified in AUDJPYThe Breakout Opportunities system has just sold AUDJPY at 82.468. The system recommends entering this trade at any price between 82.324 and 82.685. The signal was issued because the AUDJPY has broken its 24-hour low while our Speculative Sentiment Index was at 1.228, suggesting that the AUDJPY may have further to fall. A stop loss has been set at the 24-hour high of 83.335 and a profit target has been set at the 1 Day ATR level at 81.894. The system will move the stop to the next 24-hour high every time that 24-hour high is lower than the previous 24-hour high. Breakout Opportunities is a breakout strategy that aims to catch the significant moves that typically happen when currencies break through technical support or resistance.
Any opinions, news, research, analyses, prices, other information, or links to third-party sites contained on this website are provided on an "as-is" basis, as general market commentary and do not constitute investment advice. The market commentary has not been prepared in accordance with legal requirements designed to promote the independence of investment research, and it is therefore not subject to any prohibition on dealing ahead of dissemination. Although this commentary is not produced by an independent source, FXCM takes all sufficient steps to eliminate or prevent any conflicts of interests arising out of the production and dissemination of this communication. The employees of FXCM commit to acting in the clients' best interests and represent their views without misleading, deceiving, or otherwise impairing the clients' ability to make informed investment decisions. For more information about the FXCM's internal organizational and administrative arrangements for the prevention of conflicts, please refer to the Firms' Managing Conflicts Policy. Please ensure that you read and understand our Full Disclaimer and Liability provision concerning the foregoing Information, which can be accessed on the website.

💡Don't miss the great sell opportunity in AUDJPYTrading suggestion:
". There is still a possibility of temporary retracement to the suggested resistance line (83.33).
if so, traders can set orders based on Price Action and expect to reach short-term targets."
Technical analysis:
. AUDJPY is in a downtrend, and the continuation of the downtrend is expected.
. The price is below the 21-Day WEMA, which acts as a dynamic resistance.
. The RSI is at 49.
Take Profits:
TP1= @ 83.03
TP2= @ 82.67
TP3= @ 82.50
TP4= @ 82.34
TP5= @ 82.15
SL: Break Above R2
❤️ If you find this helpful and want more FREE forecasts in TradingView
. . . . . Please show your support back,
. . . . . . . . Hit the 👍 LIKE button,
. . . . . . . . . . . Drop some feedback below in the comment!
❤️ Your Support is very much 🙏 appreciated!❤️
💎 Want us to help you become a better Forex / Crypto trader?
Now, It's your turn!
Be sure to leave a comment; let us know how you see this opportunity and forecast.
Trade well, ❤️
ForecastCity English Support Team ❤️

AUDJPY 4hour Analysis July 5th, 2021AUDJPY Bearish idea
Weekly Trend: Bearish
Daily Trend: Bearish
4Hour Trend: Bearish
Trade scenario 1: Overall we’re very bearish on AJ and currently we’re seeing a bit of consolidation in the form of an ascending triangle pattern.
Ideally we would like to see the pattern break bearishly along with support at 83.250. We would then look for confirmation of a lower high that we can then enter short on.
Look to target lower toward 82.200.
Trade scenario 2: For us to consider AJ bullish we would first need to see a break and retest of resistance at 83.800. We will then consider long entries on higher lows above this level.

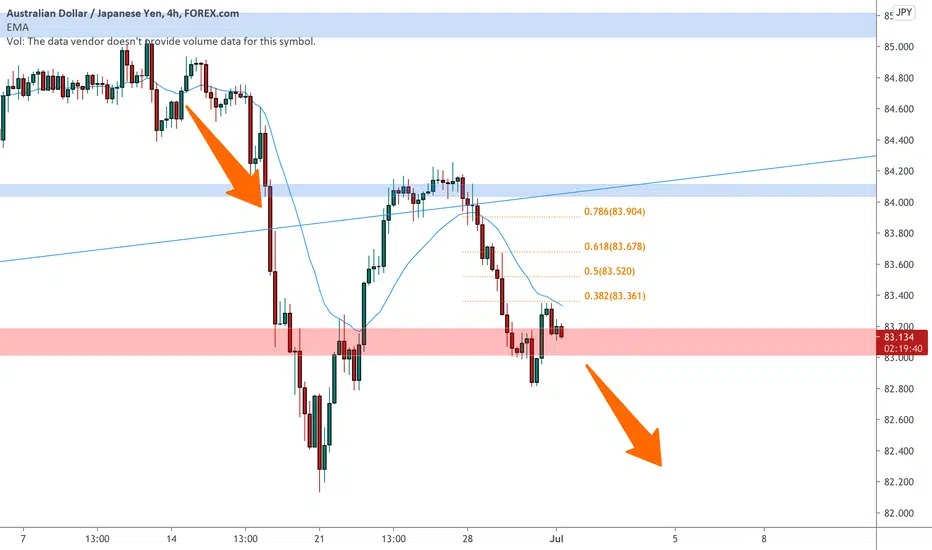
AUDJPY a turn at the 0.382 🦐AUDJPY after our previous analysis reached the weekly support.
The market retraced at the 0.382 Fibonacci and now retest the support.
According to Plancton's strategy if the price will break below we will set a nice short order.
–––––
Follow the Shrimp 🦐
Keep in mind.
🟣 Purple structure -> Monthly structure.
🔴 Red structure -> Weekly structure.
🔵 Blue structure -> Daily structure.
🟡 Yellow structure -> 4h structure.
⚫️ Black structure -> >4h structure.
Here is the Plancton0618 technical analysis , please comment below if you have any question.
The ENTRY in the market will be taken only if the condition of the Plancton0618 strategy will trigger.