AUDJPY on a bearish outlook? 🦐AUDJPY after the resistance rejection has moved to the trendline support.
According to Plancton's strategy if the price will break the trenndline and break also below the support area we will set a nice short order.
–––––
Follow the Shrimp 🦐
Keep in mind.
🟣 Purple structure -> Monthly structure.
🔴 Red structure -> Weekly structure.
🔵 Blue structure -> Daily structure.
🟡 Yellow structure -> 4h structure.
⚫️ Black structure -> >4h structure.
Here is the Plancton0618 technical analysis , please comment below if you have any question.
The ENTRY in the market will be taken only if the condition of the Plancton0618 strategy will trigger.
Aud-jpy

AUDJPY looking for new highs 🦐AUDJPY after the rejection of the daily resistance is moving lower to the 84.600 support area.
If the price will show us a sign of conversion we will set a nice long order according to plancton's strategy.
–––––
Follow the Shrimp 🦐
Keep in mind.
🟣 Purple structure -> Monthly structure.
🔴 Red structure -> Weekly structure.
🔵 Blue structure -> Daily structure.
🟡 Yellow structure -> 4h structure.
⚫️ Black structure -> >4h structure.
Here is the Plancton0618 technical analysis , please comment below if you have any question.
The ENTRY in the market will be taken only if the condition of the Plancton0618 strategy will trigger.

AUD JPY BUY (AUSTRALIAN DOLLAR - JAPANESE YEN)Hi there.
Price is forming a continuation pattern to the upside.
Wait for the price to complete the pattern and watch strong price action for buy.

AUDJPY testing the channel 🦐AUDJPY on the 4chart is moving inside a descending channel.
The market is now approaching the upper trendline and according to Plancton's strategy if the price will break above we will set a nice long order.
–––––
Follow the Shrimp 🦐
Keep in mind.
🟣 Purple structure -> Monthly structure.
🔴 Red structure -> Weekly structure.
🔵 Blue structure -> Daily structure.
🟡 Yellow structure -> 4h structure.
⚫️ Black structure -> >4h structure.
Here is the Plancton0618 technical analysis , please comment below if you have any question.
The ENTRY in the market will be taken only if the condition of the Plancton0618 strategy will trigger.

AUDJPY ANALYSIS AUDJPY is trading in uptrend
Pair is based above support level at 83.95
Price is based above HVN at level 84.25 which indicates that pair is in accumulation phase
MACD shows bullish momentum
Price broke upper limit of continuation falling wedge pattern
It's expected for coming bullish wave to target resistance level at 85.80

💡Don't miss the great sell opportunity in AUDJPY
Trading suggestion:
". There is still a possibility of temporary retracement to the suggested resistance line (84.480).
if so, traders can set orders based on Price Action and expect to reach short-term targets."
Technical analysis:
. AUDJPY is in a range bound, and the beginning of a downtrend is expected.
. The price is below the 21-Day WEMA, which acts as a dynamic resistance.
. The RSI is at 48
Take Profits:
TP1= @ 84.230
TP2= @ 83.970
TP3= @ 83.740
TP4= @ 83.440
TP5= @ 83.020
SL: Break Above R2
❤️ If you find this helpful and want more FREE forecasts in TradingView
. . . . . Please show your support back,
. . . . . . . . Hit the 👍 LIKE button,
. . . . . . . . . . . Drop some feedback below in the comment!
❤️ Your Support is very much 🙏 appreciated!❤️
💎 Want us to help you become a better Forex / Crypto trader?
Now, It's your turn!
Be sure to leave a comment; let us know how you see this opportunity and forecast.
Trade well, ❤️
ForecastCity English Support Team ❤️

AUD/JPY, room to the upsideThe price has bounced off the ascending trendline and broken the structure marked on the chart. We are expecting the price to keep growing and hit the Target indicated on the graph

AUDJPY 4hour Analysis May 23rd, 2021AUDJPY Short idea
Weekly Trend: Bullish
Daily Trend: Bullish
4Hour Trend: Bearish
Trade scenario 1: All timeframes above the 4hour have been bullish for a while. We can see price action just formed a 4hr lower high and is showing bearish conviction. Look to enter on more bearish setups and potentially a retest of recently broken support near 84.400. Target lower toward our next key support level near 83.250.
Trade scenario 2: For us to consider AJ bullish again we need to see a break and retest of our 84.700 level ideally. Look to enter long after we can confirm a higher low above this level.

AUD JPY BUY (AUSTRALIAN DOLLAR - JAPANESE YEN)Hi there.
Price is forming a continuation pattern to the upside.
Wait for the price to complete the pattern and watch strong price action for buy.

AUD/JPY, time to flyAs it can be inferred from the graphic, the pair is currently sitting on an important key zone. It has printed a nice bullish candle and bounced off the crucial area. We are now waiting for the price to continue its move to the upside and reach the target identified on the chart!
What do you think, family? Feel free to drop your ideas in the comment section.


AUDJPY looking for new highs 🦐AUDJPY after the resistance rejection tested the 0.5 Fibonacci level.
The market is now approaching again the structure and according to Plancton's strategy if the price will break above we will set a nice long order.
–––––
Follow the Shrimp 🦐
Keep in mind.
🟣 Purple structure -> Monthly structure.
🔴 Red structure -> Weekly structure.
🔵 Blue structure -> Daily structure.
🟡 Yellow structure -> 4h structure.
⚫️ Black structure -> >4h structure.
Here is the Plancton0618 technical analysis , please comment below if you have any question.
The ENTRY in the market will be taken only if the condition of the Plancton0618 strategy will trigger.
AUDJPY a rise in the exchange price is comingMy Marketmiracle advisor generated a LONG input signal on the AUDJPY cross at price 84.59 with a target of 85.82 for an increase of 1.45%.
The graph seems to confirm when indicated in fact we are close to a support and the upward push on prices by medium large investors is increasing ( yellow wave ) so this should reflect on the value of the cross.
the forecast is compatible with others that preview a rise of the prices of the currencies of australia and new zealand to detriment of the value of the yen
This idea is based on a signal generated by the advisor Marketmiracle, down on this page you will find the link to the page of signals of the advisor that you can see for free without any cost or registration

AUDJPY - Shorts READY 💪From our previous analysis of AUDJPY, we were shorting from the top (See linked charts below)
All we have to do now is look for solid bear flags and keep entering and work our way down. Look for retest areas too as they provide us with clear stop loss placements and are high probability.
Goodluck and trade safe

AUDJPY - Shorts READY 💪 From our previous analysis of AUDJPY, we were shorting from the top (See linked charts below)
All we have to do now is look for solid bear flags and keep entering and work our way down. Look for retest areas too as they provide us with clear stop loss placements and are high probability.
Goodluck and trade safe!

AUD/JPY, will we keep going up?🚀As it can be inferred from our chart, we are expecting the price to keep rising and generate around +100 pips🙌🏻

AUDJPY a huge ascending triangle? 🦐AUDJPY on the daily chart is moving between an ascending trendline and a daily resistance.
The price close the Friday candle pushing up and according to Plancton's strategy if the market will break above we will set a nice long order.
–––––
Follow the Shrimp 🦐
Keep in mind.
🟣 Purple structure -> Monthly structure.
🔴 Red structure -> Weekly structure.
🔵 Blue structure -> Daily structure.
🟡 Yellow structure -> 4h structure.
⚫️ Black structure -> >4h structure.
Here is the Plancton0618 technical analysis , please comment below if you have any question.
The ENTRY in the market will be taken only if the condition of the Plancton0618 strategy will trigger.

AUDJPY tested the 0.5 Fib 🦐AUDJPY on the 4 h chart tested the 0.5 Fibonacci level below a daily resistance.
According to Plancton's strategy if the price will break above we will set a nice long order.
–––––
Follow the Shrimp 🦐
Keep in mind.
🟣 Purple structure -> Monthly structure.
🔴 Red structure -> Weekly structure.
🔵 Blue structure -> Daily structure.
🟡 Yellow structure -> 4h structure.
⚫️ Black structure -> >4h structure.
Here is the Plancton0618 technical analysis , please comment below if you have any question.
The ENTRY in the market will be taken only if the condition of the Plancton0618 strategy will trigger.

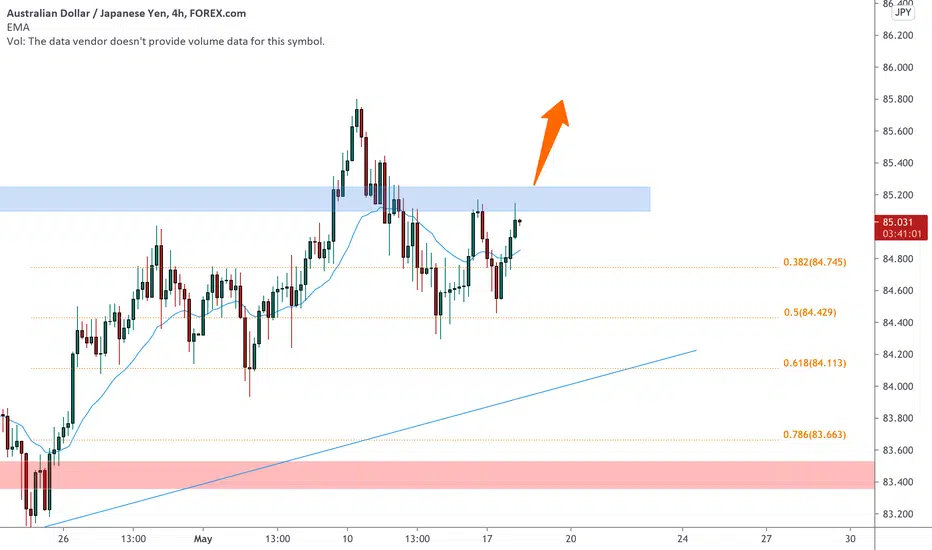
AUDJPY facing bullish pressure, potential for further upside!Prices are facing bullish pressure as prices break out of descending trendline resistance in line with horizontal swing low support, 50% Fibonacci retracement and 50% Fibonacci extension. Prices might push up towards horizontal swing high resistance in line with 61.8% Fibonacci retracement and 78.6% Fibonacci extension. If prices push down further, prices might take support from horizontal swing low support in line with 78.6% Fibonacci retracement and 78.6% Fibonacci extension. EMA is also below prices, showing a bullish pressure on prices.

AUD JPY LONG AUD JPY has broken the resistance.
Next we see a retest of the support range.
Now we overcome support to push up to the next resistance range on the lower time frame.
We may take a long trade setup from here with potential to rise for profit.
This is a lower time frame setup.

AUDJPY - FOREX - 13. MAY. 2021Welcome to our weekly trade setup ( AUDJPY )!
-
1 HOUR
Bearish break below main sr level.
4 HOUR
Expecting more price action towards previous support zone.
DAILY
Overall bearish pressure.
-
FOREX SETUP
SELL AUDJPY
ENTRY LEVEL @ 84.750
SL @ 85.240
TP @ 84.090
Max Risk: 0.5% - 1%!
(Remember to add a few pips to all levels - different Brokers!)
Leave us a comment or like to keep our content for free and alive.
Have a great week everyone!
ALAN

AUDJPY- Looking to go higherAUDJPY appears to have broke above resistance and is now sitting on support. Could be quite a a bit higher from this point. Check out chart.
