AUDUSD Potential for Bearish Momentum | 16th November 2022On the H4 chart, the overall bias for AUDUSD is bullish . Furthermore, the price is above the Ichimoku cloud , indicating that the market is bullish . However we are looking to play the pullback sell. Looking for a sell entry at 0.67711, where the 61.8% Fibonacci line is. Stop loss will be at 0.69161, where the previous swing high is located. Take profit will be at 0.65398, where the 50% Fibonacci line is.
Any opinions, news, research, analyses, prices, other information, or links to third-party sites contained on this website are provided on an "as-is" basis, as general market commentary, and do not constitute investment advice. The market commentary has not been prepared in accordance with legal requirements designed to promote the independence of investment research, and it is therefore not subject to any prohibition on dealing ahead of dissemination. Although this commentary is not produced by an independent source, FXCM takes all sufficient steps to eliminate or prevent any conflicts of interest arising out of the production and dissemination of this communication. The employees of FXCM commit to acting in the clients' best interests and represent their views without misleading, deceiving, or otherwise impairing the clients' ability to make informed investment decisions. For more information about the FXCM's internal organizational and administrative arrangements for the prevention of conflicts, please refer to the Firms' Managing Conflicts Policy. Please ensure that you read and understand our Full Disclaimer and Liability provision concerning the foregoing Information, which can be accessed on the website.
Aud-usd

AUDUSD Potential For Bullish ContinuationThe overall bias for AUDUSD on the H4 chart is bullish. In addition, price has broken out of the descending trend line and is now above the Ichimoku cloud, indicating a bullish market. Look for a pullback buy entry at 0.65473, which is the 38.2% Fibonacci line. The take profit point will be at 0.68842, which is the 78.6% Fibonacci line. The stop loss will be set at 0.63864, which is the previous swing low and the 61.8% Fibonacci line.
Please be advised that the information presented on TradingView is provided to Vantage (‘Vantage Global Limited’, ‘we’) by a third-party provider (‘Everest Fortune Group’). Please be reminded that you are solely responsible for the trading decisions on your account. There is a very high degree of risk involved in trading. Any information and/or content is intended entirely for research, educational and informational purposes only and does not constitute investment or consultation advice or investment strategy. The information is not tailored to the investment needs of any specific person and therefore does not involve a consideration of any of the investment objectives, financial situation or needs of any viewer that may receive it. Kindly also note that past performance is not a reliable indicator of future results. Actual results may differ materially from those anticipated in forward-looking or past performance statements. We assume no liability as to the accuracy or completeness of any of the information and/or content provided herein and the Company cannot be held responsible for any omission, mistake nor for any loss or damage including without limitation to any loss of profit which may arise from reliance on any information supplied by Everest Fortune Group.

AUDUSD Potential for Bullish Continuation | 15th November 2022On the H4 chart, the overall bias for AUDUSD is bullish. Furthermore, the price is above the Ichimoku cloud, indicating that the market is bullish. Look for a pullback buy entry at 0.65398, which is the 38.2% Fibonacci line. Stop loss will be set at 0.64076, just below the 61.8% Fibonacci line. Take profit will be at 0.67711, where the 61.8% Fibonacci line is.
Any opinions, news, research, analyses, prices, other information, or links to third-party sites contained on this website are provided on an "as-is" basis, as general market commentary, and do not constitute investment advice. The market commentary has not been prepared in accordance with legal requirements designed to promote the independence of investment research, and it is therefore not subject to any prohibition on dealing ahead of dissemination. Although this commentary is not produced by an independent source, FXCM takes all sufficient steps to eliminate or prevent any conflicts of interest arising out of the production and dissemination of this communication. The employees of FXCM commit to acting in the clients' best interests and represent their views without misleading, deceiving, or otherwise impairing the clients' ability to make informed investment decisions. For more information about the FXCM's internal organizational and administrative arrangements for the prevention of conflicts, please refer to the Firms' Managing Conflicts Policy. Please ensure that you read and understand our Full Disclaimer and Liability provision concerning the foregoing Information, which can be accessed on the website.

AUDUSD M30: Bearish outlook seen, further downside below 0.67150On the M30 time frame, prices are showing bearish order flow and facing bearish pressure from the resistance at 0.67150, in line with the graphical resistance zone and 61.8% Fibonacci extension. A pullback to the resistance zone at 0.67150 presents an opportunity to play the drop, with further downside seen to the support zone at 0.6630, which is the H4 demand zone. This 0.6630 support zone lines up with the graphical support and 61.8% Fibonacci retracement. Stochastic is testing resistance at 96.33 as well where we could see a reversal below this level, in line with prices.

AUDUSD Potential For Bullish ContinuationOn the H4 chart, the overall bias for AUDUSD is bullish. To add confluence to this, price has broken out of the descending trend line and is above the Ichimoku cloud which indicates a bullish market. Looking for a pullback buy entry at 0.65473, where the 38.2% Fibonacci line is located. Take profit will be at 0.68842, where the 78.6% Fibonacci line is located. Stop loss will be set at 0.63864, where the previous swing low and 61.8% Fibonacci line is located.
Please be advised that the information presented on TradingView is provided to Vantage (‘Vantage Global Limited’, ‘we’) by a third-party provider (‘Everest Fortune Group’). Please be reminded that you are solely responsible for the trading decisions on your account. There is a very high degree of risk involved in trading. Any information and/or content is intended entirely for research, educational and informational purposes only and does not constitute investment or consultation advice or investment strategy. The information is not tailored to the investment needs of any specific person and therefore does not involve a consideration of any of the investment objectives, financial situation or needs of any viewer that may receive it. Kindly also note that past performance is not a reliable indicator of future results. Actual results may differ materially from those anticipated in forward-looking or past performance statements. We assume no liability as to the accuracy or completeness of any of the information and/or content provided herein and the Company cannot be held responsible for any omission, mistake nor for any loss or damage including without limitation to any loss of profit which may arise from reliance on any information supplied by Everest Fortune Group.

AUDUSD Potential for Bullish Continuation | 14th November 2022The overall bias for AUDUSD on the H4 chart is bullish . In addition, price is above the Ichimoku cloud , indicating a bullish market. Looking for a pullback buy entry at 0.65398, where the 38.2% Fibonacci line is located. Stop loss will be at 0.64076, slightly below where the 61.8% Fibonacci line is located. Take profit will be at 0.69161, where the previous swing high and 78.6% Fibonacci line is located.
Any opinions, news, research, analyses, prices, other information, or links to third-party sites contained on this website are provided on an "as-is" basis, as general market commentary, and do not constitute investment advice. The market commentary has not been prepared in accordance with legal requirements designed to promote the independence of investment research, and it is therefore not subject to any prohibition on dealing ahead of dissemination. Although this commentary is not produced by an independent source, FXCM takes all sufficient steps to eliminate or prevent any conflicts of interest arising out of the production and dissemination of this communication. The employees of FXCM commit to acting in the clients' best interests and represent their views without misleading, deceiving, or otherwise impairing the clients' ability to make informed investment decisions. For more information about the FXCM's internal organizational and administrative arrangements for the prevention of conflicts, please refer to the Firms' Managing Conflicts Policy. Please ensure that you read and understand our Full Disclaimer and Liability provision concerning the foregoing Information, which can be accessed on the website.

Wouldn't it be nice if....As the DXY fell through the week, the AUDUSD continued to rise to reach the round number and key resistance of 0.67 on Friday.
With no major news events on the horizon for the AUD, the price is likely to continue trading higher, especially if the DXY continues to weaken.
It is most likely that the price could trade beyond the 0.67 resistance level to signal a continuation of the uptrend, with the next key resistance level at 0.69.
However, wouldn't it be nice if the AUDUSD could retrace from here?
If the DXY recovers, the AUDUSD turning from the 0.67 resistance level toward the support level of 0.6540 could be a great R:R and countertrend trade.

AUDUSD 4hour Analysis November 13th, 2022AUDUSD Bullish Idea
Weekly Trend: Bearish
Daily Trend: Bullish
4Hour Trend: Bullish
Trade scenario 1: We are now looking bullish on AU as we surged through our 0.65500 zone and now price action is now resting near our 0.67000 zone.
Going into this week we’re looking for reactions and the most likely scenario would be a retrace to 0.65500.
Ideally, we can spot a clear higher low with bullish variations to enter long on.
Trade scenario 2: For us to consider AU bearish again we would need to see a break below our 0.65500 zone with a lower high below.

InvestMate|AUD/USD No time for growth to continue🦘🦘AUD/USD No time for growth to continue.
🦘 Once again I have to write this. After I predicted rises on AUD/USD with a slight slip the link to the post below, all based on the fundamentals I wrote about in my previous post on the dollar:
🦘This time it was time for a corrective scenario.
🦘I will describe each technical tool I used in turn.
🦘1. I determined an uptrend channel from the bottom
We can see that it was respected with scalpel precision.
🦘2. I then measured the fibo waves from the bottom to the current peak, these were also clearly respected, will they also be so respected on correction?
🦘3. I measured the largest downward correction and determined the 1:1 level of equality of this correction.
🦘4. I determined a support zone based on the cluster of the 0.5 level of the upward wave and the 1:1 correction.
🦘5. I determined a resistance zone at current levels based on previous support and the fact that we have broken out of the upward channel.
🦘The scenario I am playing out is a correction to the area of support after which I expect the upside to continue, I don't think we could continue the current upside with bearish sentiment still prevailing.
🦘*Please do not suggest the path I have drawn with the lines this is only a hypothetical scenario for further increases.
🚀If you appreciate my work and effort put into this post I encourage you to leave a like and give a follow on my profile.🚀

AUDUSD SELL RETRACEMENT/PULLBACKI am expecting some bullish pressure from the USD this week.
-Therefore AUDUSD should make a bearish move
-I am looking for a final bullish push that will ultimately respect the above level of resistance
-Once price meet resistance, I am expecting a bearish move that will test the previous level of support which will test the previous high.
- I think price will test the .65 area
-Please, like or comment your idea !

AUDUSD - Trend-Following Sell Setup!Hello TradingView Family / Fellow Traders. This is Richard, as known as theSignalyst.
AUDUSD is still overall bearish from a long-term perspective trading inside the brown channel, and it is currently retesting the upper brown trendline.
Moreover, the zone 0.675 - 0.685 is a strong resistance zone .
So the highlighted purple circle is a strong area to look for sell setups as it is the intersection of the green resistance zone and upper brown trendline. (acting as non-horizontal resistance)
As per my trading style:
Since AUDUSD is approaching the purple circle zone, I will be looking for bearish reversal setups (like a double top pattern, trendline break , and so on...)
and of course, as it retests the blue support, I will be looking for buy setups.
Always follow your trading plan regarding entry, risk management, and trade management.
Good luck!
All Strategies Are Good; If Managed Properly!
~Rich


AUDUSD: A potential breakout as market calls for a pivotHey traders, in the coming week we are monitoring AUDUSD for a buying opportunity around 0.67 zone, once we will receive any bullish confirmation the trade will be executed.
Trade safe, Joe.

AudUsd LongI am looking to long AudUsd as it broke the trendline but it might retest the previous resistance before actually going long. I will wait for confirmation but if it fails to & actually continues to break the bottom support, I will look for short opportunities.
AUDUSD Potential for Bullish Continuation | 11th November 2022The overall bias for AUDUSD on the H4 chart is bullish . In addition, price is above the Ichimoku cloud , indicating a bullish market. Looking for a pullback buy entry at 0.64893, which is where the 23.6% Fibonacci line and 61.8% Fibonacci projection line intersect. The stop loss will be set at 0.63864, where the previous low and 61.8% Fibonacci line are located. The take profit will be set at 0.67249 where the -61.8% fibonacci expansion line is located.
Any opinions, news, research, analyses, prices, other information, or links to third-party sites contained on this website are provided on an "as-is" basis, as general market commentary, and do not constitute investment advice. The market commentary has not been prepared in accordance with legal requirements designed to promote the independence of investment research, and it is therefore not subject to any prohibition on dealing ahead of dissemination. Although this commentary is not produced by an independent source, FXCM takes all sufficient steps to eliminate or prevent any conflicts of interest arising out of the production and dissemination of this communication. The employees of FXCM commit to acting in the clients' best interests and represent their views without misleading, deceiving, or otherwise impairing the clients' ability to make informed investment decisions. For more information about the FXCM's internal organizational and administrative arrangements for the prevention of conflicts, please refer to the Firms' Managing Conflicts Policy. Please ensure that you read and understand our Full Disclaimer and Liability provision concerning the foregoing Information, which can be accessed on the website.

The bears are on the move on AUDUSDI am positive we are going to hit the year-low on audusd pretty soon. A pretty late entry one could say, but there is no need to enter with a large one. :)

Risk Off Dominates as concerns over China’s latest outbreak riseThe risk off tone dominated price action as growing concerns over China’s latest coronavirus outbreak remained in focus, keeping the antipodeans pressured while supporting safe havens.
Alongside the risk off tone, AUD was further pressured by comments from RBA Deputy Governor Bullock, who stated that although rates would rise further, they are nearing the point where they could “sit and wait” for a while.
Given the above, AUDUSD briefly slipped below the 0.64 handle, while AUDJPY fell below the 94.00 handle, and EURAUD reclaimed the 1.56 handle.
Looking ahead, today’s main event will be US CPI in the upcoming US session. However, there are also central bank speakers scheduled throughout the day, including BoE’s Ramsden and Tenreyro, Fed’s Mester and George, and BoC Governor Macklem.

AUDUSD Potential for Bullish Continuation | 10th November 2022The overall bias for AUDUSD on the H4 chart is bullish. In addition, price is above the Ichimoku cloud, indicating a bullish market. Look for a pullback buy entry at 0.63869, which is where the 61.8% and 38.2% Fibonacci lines intersect. The stop loss will be set at 0.63310, just below the 78.6% and 50% Fibonacci lines. The take profit will be set at 0.65225 where the previous high is.
Any opinions, news, research, analyses, prices, other information, or links to third-party sites contained on this website are provided on an "as-is" basis, as general market commentary, and do not constitute investment advice. The market commentary has not been prepared in accordance with legal requirements designed to promote the independence of investment research, and it is therefore not subject to any prohibition on dealing ahead of dissemination. Although this commentary is not produced by an independent source, FXCM takes all sufficient steps to eliminate or prevent any conflicts of interest arising out of the production and dissemination of this communication. The employees of FXCM commit to acting in the clients' best interests and represent their views without misleading, deceiving, or otherwise impairing the clients' ability to make informed investment decisions. For more information about the FXCM's internal organizational and administrative arrangements for the prevention of conflicts, please refer to the Firms' Managing Conflicts Policy. Please ensure that you read and understand our Full Disclaimer and Liability provision concerning the foregoing Information, which can be accessed on the website.

AUDUSD M30: Bearish outlook seen, further downside below 0.6450On the M30 time frame, prices are facing bearish pressure from the resistance zone at 0.6450, in line with the graphical resistance and 23.6% Fibonacci retracement. A pullback to the 0.6450 resistance zone could see a reversal below this area to the support zone at 0.6380 which coincides with the 61.8% Fibonacci retracement. Prices are holding below the Ichimoku cloud as well, supporting the bearish bias.

AUD USD - FUNDAMENTAL DRIVERSAUD
FUNDAMENTAL OUTLOOK: NEUTRAL
BASELINE
Ongoing issues with China’s economy remain a question mark for the AUD. As long as China’s potential for recovery remains uncertain, the path for the AUD remains the same. The RBA took another 25bsp hike at their previous meeting, sparking some speculation that the bank could be finalizing their hiking cycle sooner than expected. But with Core Trimmed CPI >6.0% the hiking cycle is arguable not close to over just yet. For the week ahead, overall risk sensitivity needs to be kept in mind for the AUD, as well as any further developments regarding the recent rumours and speculation of a potential China reopening.
POSSIBLE BULLISH SURPRISES
Data showing China’s growth outlook is improving or surprise announcement at the CCP congress that Covid-zero will end could provide upside for the AUD. As a risk sensitive currency, catalysts that causes big bouts of risk on sentiment could trigger bullish reactions in the AUD. Catalyst that triggers recovery in key export commodities (China stimulus, lifting covid restrictions, new infrastructure projects in China) should be supportive for the AUD.
POSSIBLE BEARISH SURPRISES
Data showing China’s growth outlook is deteriorating or strong affirmation that the covid-zero policy is here to stay could add additional pressure on the AUD. As a risk sensitive currency, catalysts that causes big bouts of risk off sentiment could trigger bearish reactions in the AUD. Catalyst that triggers further weakness in key export commodities (additional China restrictions, demand destruction) could be negative for the AUD.
BIGGER PICTURE
The AUD’s outlook remains neutral but is largely dependent on China and whether key commodities like Iron Ore and Coal can stop their bleeding. Until the covid situation and property issues in China improves materially, and until commodities and China’s growth stabilizes, the AUD is best suited for short-term trades in line with strong short-term sentiment. For the week ahead the main highlight will be the US CPI report which can have a big impact across major asset classes. Apart from that, overall risk sentiment and any additional developments on China’s side with regards to potential reopening will be important to watch.
USD
FUNDAMENTAL OUTLOOK: BULLISH
BASELINE
With headline CPI above 8% and Core CPI seeing another acceleration in the SEP CPI data, the Fed is under pressure to continue hiking rates and ramping up QT. At the NOV FOMC presser, Fed Chair Powell shattered any big hopes of a pivot and warned that their SEP expectations for the terminal rate will have to be revised higher. The Fed is on a data-dependent (meeting-by-meeting) policy stance, meaning incoming growth, inflation and jobs data remains a key driver for short-term USD volatility where we expect a cyclical reaction for both the USD and US10Y (good data expected to be supportive for the USD and US yields while bad data is expected to pressure the USD and US yields). The past week was a choppy one for the USD, with upside seen after the more hawkish Fed presser, but a unexpected and punchy move lower after Friday’s mixed NFP jobs report.
POSSIBLE BULLISH SURPRISES
With the Fed signalling a data dependent policy stance, we expect a cyclical reaction from the USD with incoming US data. Thus, extremely good growth, inflation or jobs data is expected to trigger short-term bullish reactions in the USD. If the cyclical outlook continues to weaken, the USD’s safe haven status still matters. Any incoming catalysts that increase deep recession fears and triggers strong moves lower in risk assets & bonds can trigger safe haven flows into the USD. With a lot priced for the Fed and USD, the bar is high for hawkish Fed surprises, but any aggressive Fed speak talking up a >5.5% terminal rate can trigger further USD upside.
POSSIBLE BEARISH SURPRISES
With the Fed signalling a data dependent policy stance, we expect a cyclical reaction from the USD with incoming US data. Thus, extremely bad growth, inflation or jobs data is expected to trigger short-term bearish reactions in the USD. If the cyclical outlook starts to improve, the USD’s safe haven status still matters. Any incoming catalysts that decrease deep recession fears and triggers strong moves higher in risk assets & bonds can trigger safe haven outflows out of the USD. With a lot priced in for the Fed and the USD, it won’t take much to disappoint on the dovish side. Any big concerns about growth from Fed speakers could trigger outflows.
BIGGER PICTURE
The fundamental outlook for the USD remains bullish as long as the Fed stays aggressively hawkish and cyclical concerns put pressure on risk sentiment. The data dependent stance from the Fed means that short-term data surprises can pull the USD either way and would be our preferred way of trading the Dollar right now. The week ahead will give us the most recent US CPI data which will be the biggest focus for markets, and we also have UoM Consumer Sentiment to watch. The price action in the USD following Friday’s NFP was interesting, but not something to use with any real conviction to trade into the week ahead. Waiting for CPI and UoM Consumer Sentiment seems like the safest way to approach the USD in the week ahead.

AUDUSD Potential for Bullish Continuation | 9th November 2022On the H4 chart, the overall bias for AUDUSD is bullish . To add confluence to this, price is above the Ichimoku cloud which indicates a bullish market. Looking for a pullback buy entry at 0.63869, where the 61.8% and 38.2% Fibonacci lines are located. Stop loss will be set at 0.63310, slightly below where the 78.6% and 50% Fibonacci lines are located. Take profit will be set at 0.65225, where the previous high is.
Any opinions, news, research, analyses, prices, other information, or links to third-party sites contained on this website are provided on an "as-is" basis, as general market commentary, and do not constitute investment advice. The market commentary has not been prepared in accordance with legal requirements designed to promote the independence of investment research, and it is therefore not subject to any prohibition on dealing ahead of dissemination. Although this commentary is not produced by an independent source, FXCM takes all sufficient steps to eliminate or prevent any conflicts of interest arising out of the production and dissemination of this communication. The employees of FXCM commit to acting in the clients' best interests and represent their views without misleading, deceiving, or otherwise impairing the clients' ability to make informed investment decisions. For more information about the FXCM's internal organizational and administrative arrangements for the prevention of conflicts, please refer to the Firms' Managing Conflicts Policy. Please ensure that you read and understand our Full Disclaimer and Liability provision concerning the foregoing Information, which can be accessed on the website.

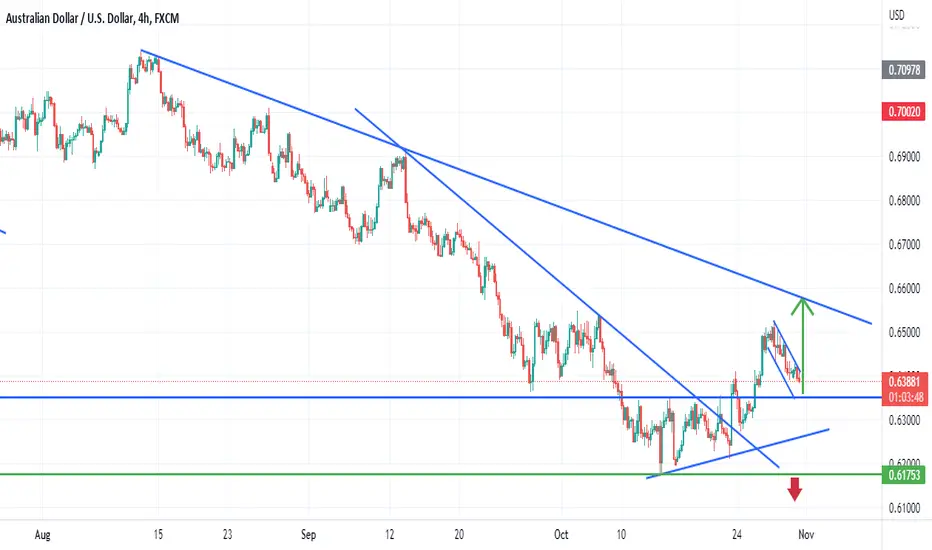
AUDUSDaudusd breaking out of the descending b wedge
incase of successful breakout expecting 300 to 400 pips bulish wave

AUDUSD Potential downsidesHey traders, in today's trading session we are monitoring AUDUSD for a selling opportunity around 0.65 zone, once we will receive any bearish confirmation the trade will be executed.
Trade safe, Joe.
