SHORT ON AUD/NZDAUD/NZD has given a perfect setup for a sell.
I has bearish divergence as well as a rising channel/wedge into a Major Supply Area from the Higher TF.
We have also change structure from Up to Down on the Lower Timeframe.
I will be selling AUD/NZD to the pervious swing low / demand area for about 100 pips. OANDA:AUDNZD
Aud

Potential bullish rise?The Aussie (AUD/USD) has bounced off the pivot and could rise to the 1st resistance.
Pivot: 0.6261
1st Support: 0.6229
1st Resistance: 0.6322
Risk Warning:
Trading Forex and CFDs carries a high level of risk to your capital and you should only trade with money you can afford to lose. Trading Forex and CFDs may not be suitable for all investors, so please ensure that you fully understand the risks involved and seek independent advice if necessary.
Disclaimer:
The above opinions given constitute general market commentary, and do not constitute the opinion or advice of IC Markets or any form of personal or investment advice.
Any opinions, news, research, analyses, prices, other information, or links to third-party sites contained on this website are provided on an "as-is" basis, are intended only to be informative, is not an advice nor a recommendation, nor research, or a record of our trading prices, or an offer of, or solicitation for a transaction in any financial instrument and thus should not be treated as such. The information provided does not involve any specific investment objectives, financial situation and needs of any specific person who may receive it. Please be aware, that past performance is not a reliable indicator of future performance and/or results. Past Performance or Forward-looking scenarios based upon the reasonable beliefs of the third-party provider are not a guarantee of future performance. Actual results may differ materially from those anticipated in forward-looking or past performance statements. IC Markets makes no representation or warranty and assumes no liability as to the accuracy or completeness of the information provided, nor any loss arising from any investment based on a recommendation, forecast or any information supplied by any third-party.

ASX200 to find buyers at market price?AU200AUD - 24h expiry
Risk/reward is ample to call a sell trade.
Offers ample risk/reward to sell at the market.
Daily signals are bearish.
We are trading at oversold extremes.
20 1day EMA is at 7976.
We look to Sell at 7975 (stop at 8031)
Our profit targets will be 7815 and 7765
Resistance: 7981 / 8003 / 8028
Support: 7894 / 7860 / 7807
Risk Disclaimer
The trade ideas beyond this page are for informational purposes only and do not constitute investment advice or a solicitation to trade. This information is provided by Signal Centre, a third-party unaffiliated with OANDA, and is intended for general circulation only. OANDA does not guarantee the accuracy of this information and assumes no responsibilities for the information provided by the third party. The information does not take into account the specific investment objectives, financial situation, or particular needs of any particular person. You should take into account your specific investment objectives, financial situation, and particular needs before making a commitment to trade, including seeking advice from an independent financial adviser regarding the suitability of the investment, under a separate engagement, as you deem fit.
You accept that you assume all risks in independently viewing the contents and selecting a chosen strategy.
Where the research is distributed in Singapore to a person who is not an Accredited Investor, Expert Investor or an Institutional Investor, Oanda Asia Pacific Pte Ltd (“OAP“) accepts legal responsibility for the contents of the report to such persons only to the extent required by law. Singapore customers should contact OAP at 6579 8289 for matters arising from, or in connection with, the information/research distributed.

Bullish bounce?AUD/JPY has bounced of the pivot and could potentialy rise to the 1st resistance.
Pivot: 92.28
1st Support: 92.68
1st Resistance: 94.19
Risk Warning:
Trading Forex and CFDs carries a high level of risk to your capital and you should only trade with money you can afford to lose. Trading Forex and CFDs may not be suitable for all investors, so please ensure that you fully understand the risks involved and seek independent advice if necessary.
Disclaimer:
The above opinions given constitute general market commentary, and do not constitute the opinion or advice of IC Markets or any form of personal or investment advice.
Any opinions, news, research, analyses, prices, other information, or links to third-party sites contained on this website are provided on an "as-is" basis, are intended only to be informative, is not an advice nor a recommendation, nor research, or a record of our trading prices, or an offer of, or solicitation for a transaction in any financial instrument and thus should not be treated as such. The information provided does not involve any specific investment objectives, financial situation and needs of any specific person who may receive it. Please be aware, that past performance is not a reliable indicator of future performance and/or results. Past Performance or Forward-looking scenarios based upon the reasonable beliefs of the third-party provider are not a guarantee of future performance. Actual results may differ materially from those anticipated in forward-looking or past performance statements. IC Markets makes no representation or warranty and assumes no liability as to the accuracy or completeness of the information provided, nor any loss arising from any investment based on a recommendation, forecast or any information supplied by any third-party.

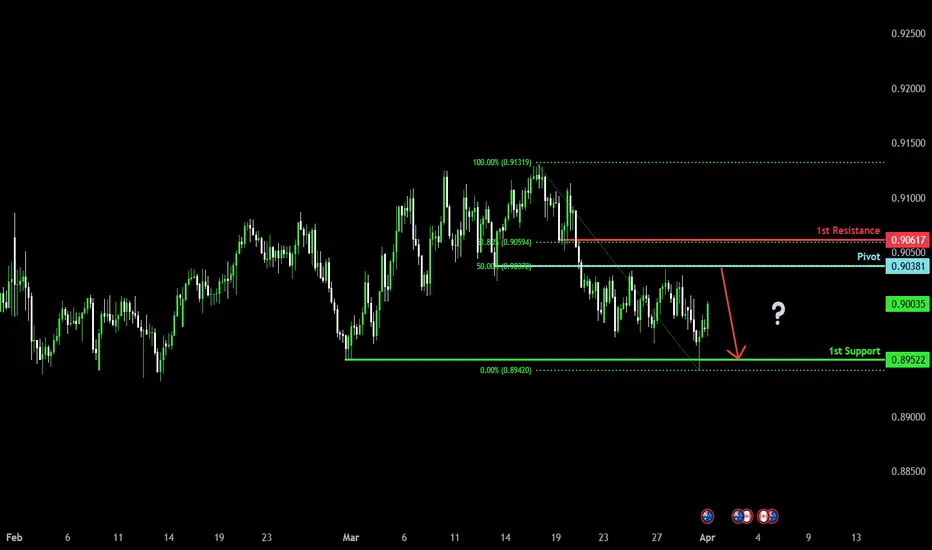
Bearish reversal?AUD/CAD is rising towards pivot and could reverse to the 1st support.
Pivot: 0.90381
1st Support: 0.89522
1st Resistance: 0.90617
Risk Warning:
Trading Forex and CFDs carries a high level of risk to your capital and you should only trade with money you can afford to lose. Trading Forex and CFDs may not be suitable for all investors, so please ensure that you fully understand the risks involved and seek independent advice if necessary.
Disclaimer:
The above opinions given constitute general market commentary, and do not constitute the opinion or advice of IC Markets or any form of personal or investment advice.
Any opinions, news, research, analyses, prices, other information, or links to third-party sites contained on this website are provided on an "as-is" basis, are intended only to be informative, is not an advice nor a recommendation, nor research, or a record of our trading prices, or an offer of, or solicitation for a transaction in any financial instrument and thus should not be treated as such. The information provided does not involve any specific investment objectives, financial situation and needs of any specific person who may receive it. Please be aware, that past performance is not a reliable indicator of future performance and/or results. Past Performance or Forward-looking scenarios based upon the reasonable beliefs of the third-party provider are not a guarantee of future performance. Actual results may differ materially from those anticipated in forward-looking or past performance statements. IC Markets makes no representation or warranty and assumes no liability as to the accuracy or completeness of the information provided, nor any loss arising from any investment based on a recommendation, forecast or any information supplied by any third-party.
EURAUD forming a top?EURAUD - 24h expiry
Trading has been mixed and volatile.
We look for a temporary move higher.
Preferred trade is to sell into rallies.
Bearish divergence is expected to cap gains.
Bespoke resistance is located at 1.7360.
We look to Sell at 1.7360 (stop at 1.7420)
Our profit targets will be 1.7120 and 1.7080
Resistance: 1.7360 / 1.7420 / 1.7470
Support: 1.7275 / 1.7185 / 1.7090
Risk Disclaimer
The trade ideas beyond this page are for informational purposes only and do not constitute investment advice or a solicitation to trade. This information is provided by Signal Centre, a third-party unaffiliated with OANDA, and is intended for general circulation only. OANDA does not guarantee the accuracy of this information and assumes no responsibilities for the information provided by the third party. The information does not take into account the specific investment objectives, financial situation, or particular needs of any particular person. You should take into account your specific investment objectives, financial situation, and particular needs before making a commitment to trade, including seeking advice from an independent financial adviser regarding the suitability of the investment, under a separate engagement, as you deem fit.
You accept that you assume all risks in independently viewing the contents and selecting a chosen strategy.
Where the research is distributed in Singapore to a person who is not an Accredited Investor, Expert Investor or an Institutional Investor, Oanda Asia Pacific Pte Ltd (“OAP“) accepts legal responsibility for the contents of the report to such persons only to the extent required by law. Singapore customers should contact OAP at 6579 8289 for matters arising from, or in connection with, the information/research distributed.

Heading into pullback resistance?AUD/USD is rising towards the resistance level which is a pullback resistance that aligns with the 50% Fibonacci retracement and could reverse from this level to our take profit.
Entry: 0.6276
Why we like it:
There is a pullback resistance level that aligns with the 50% Fibonacci retracement.
Stop loss: 0.6321
Why we like it:
There is an overlap resistance that line sup with the 61.8% Fibonacci retracement.
Take profit: 0.6214
Why we like it:
There is a pullback support level.
Enjoying your TradingView experience? Review us!
Please be advised that the information presented on TradingView is provided to Vantage (‘Vantage Global Limited’, ‘we’) by a third-party provider (‘Everest Fortune Group’). Please be reminded that you are solely responsible for the trading decisions on your account. There is a very high degree of risk involved in trading. Any information and/or content is intended entirely for research, educational and informational purposes only and does not constitute investment or consultation advice or investment strategy. The information is not tailored to the investment needs of any specific person and therefore does not involve a consideration of any of the investment objectives, financial situation or needs of any viewer that may receive it. Kindly also note that past performance is not a reliable indicator of future results. Actual results may differ materially from those anticipated in forward-looking or past performance statements. We assume no liability as to the accuracy or completeness of any of the information and/or content provided herein and the Company cannot be held responsible for any omission, mistake nor for any loss or damage including without limitation to any loss of profit which may arise from reliance on any information supplied by Everest Fortune Group.

AUDJPY This Golden Cross is the signal for selling.The AUDJPY pair gave us last time (February 19, see chart below) an excellent sell signal that easily hit our 93.750 Target and bottom of the Bearish Megaphone:
The market is about to complete a 4H Golden Cross and last time it did (January 07 2025), it formed a Top. That was also after a Channel Up that started following an almost -6% decline. Notice how the 1D RSI patterns among the two fractals are similar.
The bearish sequence that followed the previous 4H Golden Cross hit the 1.236 Fibonacci extension. As a result, we expect to see 91.000 by May.
-------------------------------------------------------------------------------
** Please LIKE 👍, FOLLOW ✅, SHARE 🙌 and COMMENT ✍ if you enjoy this idea! Also share your ideas and charts in the comments section below! This is best way to keep it relevant, support us, keep the content here free and allow the idea to reach as many people as possible. **
-------------------------------------------------------------------------------
Disclosure: I am part of Trade Nation's Influencer program and receive a monthly fee for using their TradingView charts in my analysis.
💸💸💸💸💸💸
👇 👇 👇 👇 👇 👇

Bullish bounce?AUD/JPY is falling towards the pivot which acts as a pullback support and could bounce to the 1st resistance.
Pivot: 94.04
1st Support: 93.18
1st Resistance: 95.54
Risk Warning:
Trading Forex and CFDs carries a high level of risk to your capital and you should only trade with money you can afford to lose. Trading Forex and CFDs may not be suitable for all investors, so please ensure that you fully understand the risks involved and seek independent advice if necessary.
Disclaimer:
The above opinions given constitute general market commentary, and do not constitute the opinion or advice of IC Markets or any form of personal or investment advice.
Any opinions, news, research, analyses, prices, other information, or links to third-party sites contained on this website are provided on an "as-is" basis, are intended only to be informative, is not an advice nor a recommendation, nor research, or a record of our trading prices, or an offer of, or solicitation for a transaction in any financial instrument and thus should not be treated as such. The information provided does not involve any specific investment objectives, financial situation and needs of any specific person who may receive it. Please be aware, that past performance is not a reliable indicator of future performance and/or results. Past Performance or Forward-looking scenarios based upon the reasonable beliefs of the third-party provider are not a guarantee of future performance. Actual results may differ materially from those anticipated in forward-looking or past performance statements. IC Markets makes no representation or warranty and assumes no liability as to the accuracy or completeness of the information provided, nor any loss arising from any investment based on a recommendation, forecast or any information supplied by any third-party.

GBP/AUD Breakout (25.3.25)The GBP/AUD Pair on the M30 timeframe presents a Potential Selling Opportunity due to a recent Formation of a Trendline Breakout Pattern. This suggests a shift in momentum towards the downside in the coming hours.
Possible Short Trade:
Entry: Consider Entering A Short Position around Trendline Of The Pattern.
Target Levels:
1st Support – 2.0448
2nd Support – 2.0400
🎁 Please hit the like button and
🎁 Leave a comment to support for My Post !
Your likes and comments are incredibly motivating and will encourage me to share more analysis with you.
Best Regards, KABHI_TA_TRADING
Thank you.

Bearish drop off 61.8% Fibonacci resistance?AUD/USD has rejected off the resistance level which is a pullback resistance that aligns with the 61.8% Fibonacci retracement and could potentially drop from this level to our take profit.
Entry: 0.6319
Why we like it:
There is a pullback resistance that aligns with the 61.8% Fibonacci retracement.
Stop loss: 0.6345
Why we like it:
There is a pullback resistance that is slightly above the 78.6% Fibonacci retracement.
Take profit: 0.6281
Why we like it:
There is a pullback support that line sup with the 78.6% Fibonacci retracement.
Enjoying your TradingView experience? Review us!
Please be advised that the information presented on TradingView is provided to Vantage (‘Vantage Global Limited’, ‘we’) by a third-party provider (‘Everest Fortune Group’). Please be reminded that you are solely responsible for the trading decisions on your account. There is a very high degree of risk involved in trading. Any information and/or content is intended entirely for research, educational and informational purposes only and does not constitute investment or consultation advice or investment strategy. The information is not tailored to the investment needs of any specific person and therefore does not involve a consideration of any of the investment objectives, financial situation or needs of any viewer that may receive it. Kindly also note that past performance is not a reliable indicator of future results. Actual results may differ materially from those anticipated in forward-looking or past performance statements. We assume no liability as to the accuracy or completeness of any of the information and/or content provided herein and the Company cannot be held responsible for any omission, mistake nor for any loss or damage including without limitation to any loss of profit which may arise from reliance on any information supplied by Everest Fortune Group.

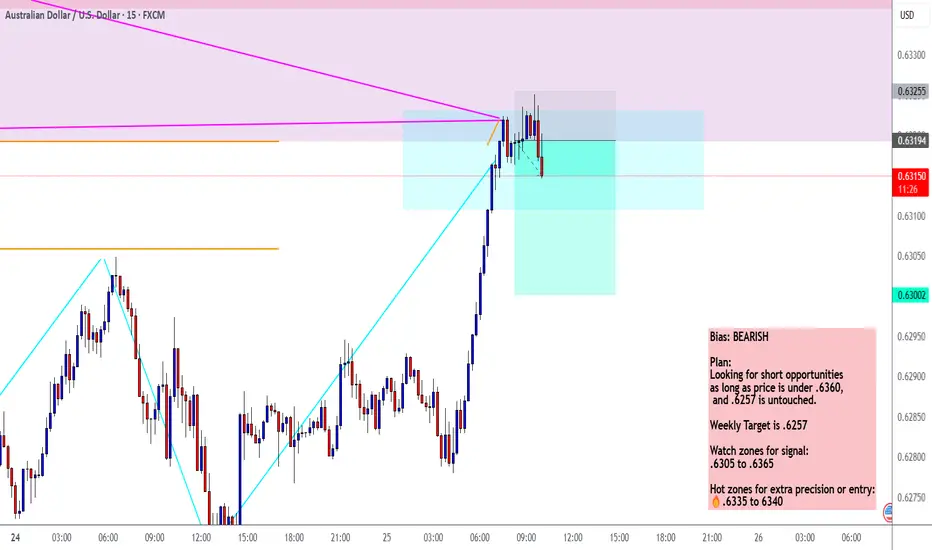
Short Idea - AUDUSDTrade entered. Entry rules met.
Confluences:
✅ Bearish overall bias
✅ Bearish demand zone
✅ Bearish ABCD extension pattern
✅ Bearish divergence
✅ Bearish break of structure
✅ Entering London close zone
✅ Price is in entry zone
✅ Required risk:reward met
⭐ I shared this watch zone in my weekly forex outlook this week, you can subscribe by clicking the link in my bio.
SHORT ON GBP/AUDGBP/AUD has the same setup as EUR/AUD from my post yesterday.
I am selling GBP/AUD for the same exact reasons.
Looking to catch 600 pips long term but over 200 pips easily this week!

AUDNZD - Bearish Double TOPHello Traders !
The AUDNZD failed to create a new higher high !
The price formed a double TOP pattern.
Currently, The neckline is broken !
So, I predict a bearish move📉
_____________
TARGET: 1.08970🎯

AUDUSD BUYWe have a specific type of divergence on the 1-hour timeframe ⏳, indicating a potential drop 📉 in the higher timeframe. On the other hand, the lower 15-minute timeframe 🕒 gives us a buying perspective 📈. So, the analysis will be as shown in the image.
#audusd #ForexTrading #PriceAction #ForexSignals #TradingAnalysis 💹

Bullish bounce?AUD/USD is falling towards the support level which is an overlap support that line sup with the 71% Fibonacci retracement and could bounce from this level to our take profit.
Entry: 0.6248
Why we like it:
There is an overlap support level that lines up with the 71% Fibonacci retracement.
Stop loss: 0.6203
Why we like it:
There is a pullback support level.
Take profit: 0.6305
Why we like it:
There is a pullback resistance level.
Enjoying your TradingView experience? Review us!
Please be advised that the information presented on TradingView is provided to Vantage (‘Vantage Global Limited’, ‘we’) by a third-party provider (‘Everest Fortune Group’). Please be reminded that you are solely responsible for the trading decisions on your account. There is a very high degree of risk involved in trading. Any information and/or content is intended entirely for research, educational and informational purposes only and does not constitute investment or consultation advice or investment strategy. The information is not tailored to the investment needs of any specific person and therefore does not involve a consideration of any of the investment objectives, financial situation or needs of any viewer that may receive it. Kindly also note that past performance is not a reliable indicator of future results. Actual results may differ materially from those anticipated in forward-looking or past performance statements. We assume no liability as to the accuracy or completeness of any of the information and/or content provided herein and the Company cannot be held responsible for any omission, mistake nor for any loss or damage including without limitation to any loss of profit which may arise from reliance on any information supplied by Everest Fortune Group.

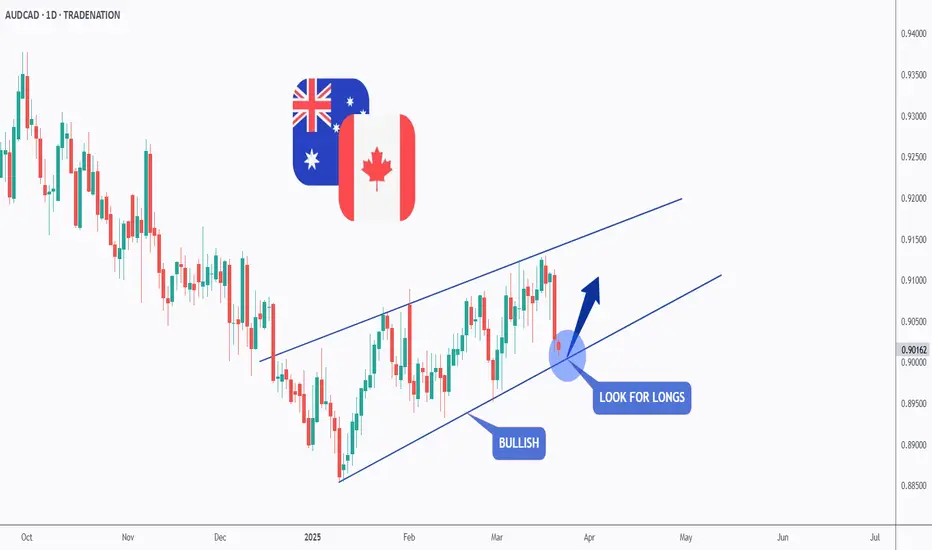
AUDCAD - Bulls Steppin in!Hello TradingView Family / Fellow Traders. This is Richard, also known as theSignalyst.
📈AUDCAD has been overall bullish trading within the rising wedge pattern marked in blue.
Today, AUDCAD is retesting the lower bound of the wedge.
Moreover, it is approaching its previous weekly low.
🏹 Thus, the highlighted blue circle is a strong area to look for buy setups as it is the intersection of weekly low and lower blue trendline acting as a non-horizontal support.
📚 As per my trading style:
As #AUDCAD approaches the blue circle zone, I will be looking for bullish reversal setups (like a double bottom pattern, trendline break , and so on...)
📚 Always follow your trading plan regarding entry, risk management, and trade management.
Good luck!
All Strategies Are Good; If Managed Properly!
~Rich
Disclosure: I am part of Trade Nation's Influencer program and receive a monthly fee for using their TradingView charts in my analysis.
Potential bullish rebound?AUD/USD has bounced off the support level which is a pullback support and could rise from this level to our take profit.
Entry: 0.6276
Why we like it:
There is a pullback support level.
Stop loss: 0.6248
Why we like it:
There is a pullback support level.
Take profit: 0.6325
Why we like it:
There is an overlap resistance level that is slightly below the 50% Fibonacci retracement.
Enjoying your TradingView experience? Review us!
Please be advised that the information presented on TradingView is provided to Vantage (‘Vantage Global Limited’, ‘we’) by a third-party provider (‘Everest Fortune Group’). Please be reminded that you are solely responsible for the trading decisions on your account. There is a very high degree of risk involved in trading. Any information and/or content is intended entirely for research, educational and informational purposes only and does not constitute investment or consultation advice or investment strategy. The information is not tailored to the investment needs of any specific person and therefore does not involve a consideration of any of the investment objectives, financial situation or needs of any viewer that may receive it. Kindly also note that past performance is not a reliable indicator of future results. Actual results may differ materially from those anticipated in forward-looking or past performance statements. We assume no liability as to the accuracy or completeness of any of the information and/or content provided herein and the Company cannot be held responsible for any omission, mistake nor for any loss or damage including without limitation to any loss of profit which may arise from reliance on any information supplied by Everest Fortune Group.

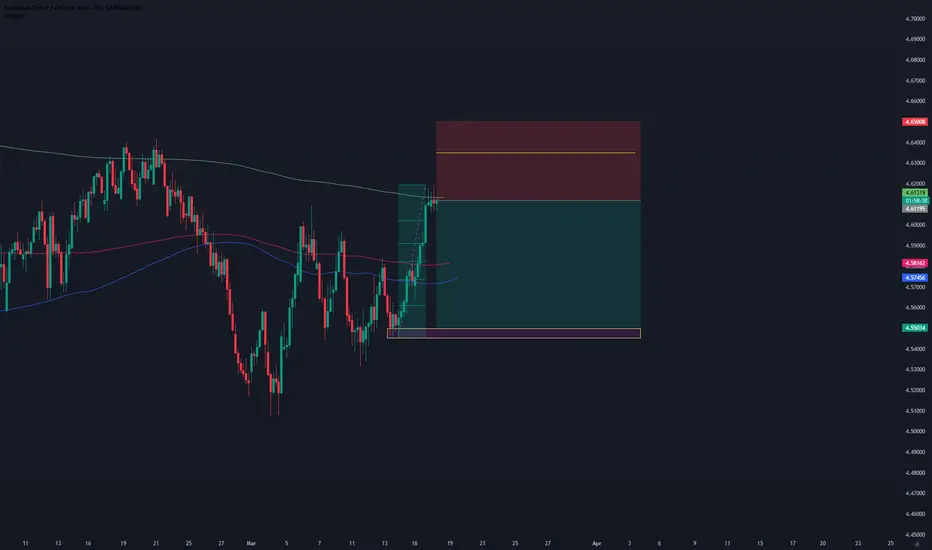
AUDCNH SELL 4H
Hello, I am Forex Trader Andrea Russo and today I want to talk to you about an interesting strategy for the AUDCNH currency cross.
Currently, the AUDCNH exchange rate is at a value of 4.61195, and I have identified a selling opportunity based on technical and fundamental analysis. My strategy involves a short entry at this level, with a stop loss (SL) placed at 4.63500, which represents a potential loss of 0.50%. My profit target (TP) is set around 4.55, aiming for a significant bearish movement.
Technical Analysis
The AUDCNH is showing signs of weakness, with a key resistance that has formed near the 4.63500 level. Technical indicators, such as the RSI and the MACD, suggest a possible bearish reversal. Furthermore, the price is below the major moving averages, confirming a bearish trend.
Fundamental Analysis
From a fundamental perspective, the Australian dollar may be under pressure due to weak economic data and a less hawkish monetary policy by the Reserve Bank of Australia (RBA). On the other hand, the Chinese renminbi is benefiting from relative economic stability and targeted stimulus policies.
Trading Strategy
Entry: 4.61195
Stop Loss: 4.63500 (-0.50%)
Take Profit: 4.55 (approximately)
This setup offers an attractive risk/reward ratio, making it a potentially profitable strategy for traders looking for opportunities in the Forex market.
Why the Weak AU Jobs Report Might Not Force the RBA's HandAustralia's employment report for February delivered a surprising set of weak figures. Understandably, markets reacted by pricing in another RBA cut to arrive sooner than later. But if we dig a little deeper, an April or May cut may still not be a given.
Matt Simpson, Market Analyst at City Index and Forex.com

Setup #006 - AUDUSD - Long (Not the cleanest)Trade entered. I used the 5 min for entry but Tradingview doesn't let me post it on a small time frame.
We should find out if this is a winner or loser during the rest of US/UK overlap. I personally think price wants to drop more, but my strategy says to buy, so I'm listening to the strategy, plus there is a nice risk to reward for this trade.
Confluences:
✅ Bullish overall bias
✅ Bulllish demand zone
✅ Bullish ABCD on 15 min chart, bullish impulse crab on H4
✅ Bullish divergence in price reversal zone
✅ Buillish break of structure
✅ Entering NY open
✅ Break of structure confirmed
✅ Required risk:reward met

Bullish bounce off 50% Fibonacci support?AUD/USD is reacting off the support level which is a pullback support that aligns with the 50% Fibonacci retracement and could bounce from this level to our take profit.
Entry: 0.6333
Why we like it:
There is a pullback support level that aligns with he 50% Fibonacci retracement.
Stop loss: 0.6298
Why we like it:
There is a pullback support level that line sup with the 78.6% Fibonacci retracement.
Take profit: 0.6387
Why we like it:
There is a pullback resistance level.
Enjoying your TradingView experience? Review us!
Please be advised that the information presented on TradingView is provided to Vantage (‘Vantage Global Limited’, ‘we’) by a third-party provider (‘Everest Fortune Group’). Please be reminded that you are solely responsible for the trading decisions on your account. There is a very high degree of risk involved in trading. Any information and/or content is intended entirely for research, educational and informational purposes only and does not constitute investment or consultation advice or investment strategy. The information is not tailored to the investment needs of any specific person and therefore does not involve a consideration of any of the investment objectives, financial situation or needs of any viewer that may receive it. Kindly also note that past performance is not a reliable indicator of future results. Actual results may differ materially from those anticipated in forward-looking or past performance statements. We assume no liability as to the accuracy or completeness of any of the information and/or content provided herein and the Company cannot be held responsible for any omission, mistake nor for any loss or damage including without limitation to any loss of profit which may arise from reliance on any information supplied by Everest Fortune Group.

Bearish reversal?AUD/CHF is rising towards the resistance level which is a pullback resistance that aligns with the 61.8% Fibonacci retracement and could reverse from this level to our take profit.
Entry: 0.5602
Why we like it:
There is a pullback resistance level that aligns with the 61.8% Fibonacci retracement.
Stop loss: 0.5626
Why we like it:
There is a pullback resistance level.
Take profit: 0.5545
Why we like it:
There is a pullback support level.
Enjoying your TradingView experience? Review us!
Please be advised that the information presented on TradingView is provided to Vantage (‘Vantage Global Limited’, ‘we’) by a third-party provider (‘Everest Fortune Group’). Please be reminded that you are solely responsible for the trading decisions on your account. There is a very high degree of risk involved in trading. Any information and/or content is intended entirely for research, educational and informational purposes only and does not constitute investment or consultation advice or investment strategy. The information is not tailored to the investment needs of any specific person and therefore does not involve a consideration of any of the investment objectives, financial situation or needs of any viewer that may receive it. Kindly also note that past performance is not a reliable indicator of future results. Actual results may differ materially from those anticipated in forward-looking or past performance statements. We assume no liability as to the accuracy or completeness of any of the information and/or content provided herein and the Company cannot be held responsible for any omission, mistake nor for any loss or damage including without limitation to any loss of profit which may arise from reliance on any information supplied by Everest Fortune Group.
