AUDCAD


📈 AUDCAD Long Opportunity: Waiting for ConfirmationHello fellow traders,
Today, we're keeping a close eye on a potential long opportunity in the FX:AUDCAD currency pair. Let's dive into the analysis:
📈 Upward Trend: The overall trend for this pair is in an upward direction, and it has been moving within an ascending parallel channel.
🛠️ Support Break: However, a noteworthy event has occurred - the support within the parallel channel has been breached.
📉 Lower Lows: Prior to the support break, AUDCAD was forming lower lows, signaling a potential shift.
🤔 Assessing the Situation: Now, there's a support level beneath the ascending channel, creating a possibility for a fakeout before a potential upward move.
❗ Caution: It's essential to acknowledge the risk involved. There's only a limited chance of success as this level has been previously tested.
💡 Wait for Confirmation: We should exercise patience and await a confirmation candle before making a decision. This is a critical step in risk management.
📌 Stay Informed: I'll keep you posted on whether it's a viable entry or not once we have the confirmation candle. Stay tuned!
Until we meet again, trade wisely.
Thanks & regards,
Alpha Trading Station 🌟

AUDCAD - Expect retracement ✅Hello traders!
‼️ This is my perspective on AUDCAD.
Technical analysis: As I expected in my last analysis price rallied up, now I wait price to take liquidity above equal highs and then we could see a retracement to fill that huge imbalance lower.
Fundamental news: This week on Friday will be released Unemployment Rate on AUD. If the result is negative, it will support our idea.
Like, comment and subscribe to be in touch with my content!

AUDCADAUDCAD is trading in descending channel and printing consistent LLs LHs. Recently the price is broken the important support zone and now retesting the broken level, which is also the 50% Fib retracement level.
If the sell momentum continues the next target could be 0.87400 followed by 0.8700 region.
What you guys think of this idea?

AUDCAD BULLISH FORECASTAUDCAD has recently experienced a bullish surge, confirming a breakout on the daily timeframe. Currently, the price is poised to retest a previously identified support level before potentially resuming its upward momentum. Should the ensuing pullback exhibit healthy price action in line with the bullish forecast, there is anticipation of a reversal near the highlighted support zone.

Entering a new long on AUDCAD.We're hitting the same support zone as the previous week on the AUDCAD timeframe, we're entering a long position.

AUDCAD: Awesome breakout, time to fall back?Had a great breakout of the falling wedge that I called out in an earlier idea (I missed the trade as it happened sooner than I expected), but now I believe we'll fall back from resistance (we can see some rejection on the daily) before confirming the trend change higher.
No real fundamentals for this, pure price action.

AUDCAD Long Term BUYING Trading IdeaHello Traders
In This Chart AUDCAD DAILY Forex Forecast By FOREX PLANET
today AUDCAD analysis 👆
🟢This Chart includes_ (AUDCAD market update)
🟢What is The Next Opportunity on AUDCAD Market
🟢how to Enter to the Valid Entry With Assurance Profit
This CHART is For Trader's that Want to Improve Their Technical Analysis Skills and Their Trading By Understanding How To Analyze The Market Using Multiple Timeframes and Understanding The Bigger Picture on the Charts

Optimize Your Trades with In-Depth Analysis!AUDCAD has unfolded a compelling Bullish Shark Pattern trading setup on its weekly chart, offering amazing opportunities for those who engaged in the trade three weeks ago.
For those who missed the initial move, a strategic move would be to await the market's respect of the Support Level on the 4-hourly chart. To identify this respect, one approach is to watch for a double bottom formation with RSI Divergence, ideally aligning with the support line.
Now, I'm curious about your trade plan for AUDCAD. What strategy are you employing? Feel free to share your insights below!

AUDCAD is approaching midpoint bullish run expectedAUDCAD is falling towards midlevel 50% Fibonacci level, AUD weakness after the RBA interest rate hike with dovish statement which led to the downfall in AUDCAD and yesterday USD strength is also a another factor for the downward correction in AUDCAD. If risk trades getting traction this pair will bounce from .87450 level the possible upper side target will be .89000. Stop lose may set below the .87000 level will give us 3.88 Risk reward ratio. Happy trading

AUDCAD - SELL - BEARISHSelling only after the retest of the HMA
**This is just my trading thought process and does not constitute as financial advice.
**Please trade with proper risk management**

AUDCAD is hitting a support zone on the 4H timeframeI think that AUDCAD's price is currently on a support zone on the 4H timeframe.
I am entering a long with a tight stop loss (just above the latest low candle).
I am avoiding an EUR or USD pairs as we have some news today.

AUDCAD Rejection on the 1D MA200. Sell.Our last signal on the AUDCAD pair (see chart below) was a dip buy within the width of the multi-month Channel Down:
The Channel Up is adjusted as on Tuesday, the pair got rejected on the 1D MA200 (orange trend-line) forming the new Lower High. As the same time, the 1D RSI got rejected on its 5-month Resistance Zone and today the sell signal is confirmed by the formation of the 1D MACD Bearish Cross. Sell and aim for a -4.14% (previous Lower High rejection decline) drop at 0.854500.
-------------------------------------------------------------------------------
** Please LIKE 👍, FOLLOW ✅, SHARE 🙌 and COMMENT ✍ if you enjoy this idea! Also share your ideas and charts in the comments section below! This is best way to keep it relevant, support us, keep the content here free and allow the idea to reach as many people as possible. **
-------------------------------------------------------------------------------
💸💸💸💸💸💸
👇 👇 👇 👇 👇 👇


AUDCAD - Look for a long ✅Hello traders!
‼️ This is my perspective on AUDCAD.
Technical analysis: Here we are in a bullish market structure from 4H timeframe perspective with clear higher highs and higher lows. I want price to go a little bit lower and then to reject from bullish order block + institutional big figure 0.88000.
Like, comment and subscribe to be in touch with my content

AUDCAD, Breakout from a range?! AUDCAD / 1D
Hello Traders, welcome back to another market breakdown.
AUDCAD has broken the structure from bearish to bullish. And broke above the range which suggets more higher prices to see.
Checkout the chart for what kind of setup I would look to take.
Trade safely,
Trader leo.

AUDCAD Technical Analysis And Trade Idea Asian OpenIn this video, we embark on an in-depth analysis of the AUDCAD currency pair, with a primary focus on the existing bullish price momentum witnessed in both the 1-day (1D) timeframe. It is worth noting that the currency pair is approaching a critical support level, hinting at the potential for a forthcoming upswing. Throughout our discussion, we will delve deeply into the intricate aspects of technical analysis, encompassing the current market trend, price dynamics, market structure, and other essential components of technical analysis. As we progress through this video, we will explore a potential trading opportunity.
It is crucial to emphasize that the information presented in this video is intended solely for educational purposes and should not be considered as financial advice. It is essential to understand that participation in the foreign exchange market involves a significant level of risk. Consequently, it is imperative to prudently incorporate robust risk management strategies into your trading plan.

AUDCAD Shorting SetupYellow: Open Position
Red: Stop Loss
Green: Take Profit
I am not responsible for your loss!
Thanks for visiting.
Happy Trading!

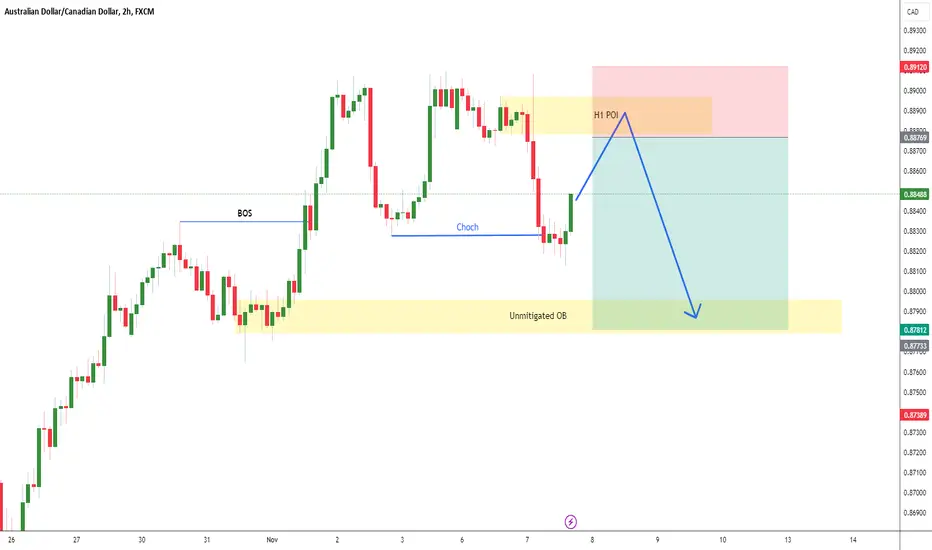
AUDCAD, Expecting down H1AUDCAD, i am Expecting down in H1 soon but it will go a little bit up to take the POI then it will fall directly down to unmitted OB.
AUDCAD Long IdeaLooking to get into buys from the demand level which aligns perfectly with daily and weekly support level.

AUDCAD Analysis H4Here is my analysis for AUDCAD on H4 using Order Block. The price could go bullish, you can put a pending order on the Order block or find an entry on LTF within OB Zone. Trade Safe!

Potential Bearish Setup on Weekly ChartAs anticipated, the Bullish Shark Pattern has initiated its move on the Weekly Chart—a prediction I shared as early as October 8, 2023. For visual confirmation, refer to the chart within this Trading View post.
Now, attention shifts towards the potential emergence of the bearish 5-0 pattern on the Weekly Chart.
On the Daily Chart, there's a convergence of Bearish Shark and Bearish Crab Patterns, both culminating at the same completion level, 0.9015. This sets the stage for a potential shorting opportunity upon market retest at these levels.
Alternatively, consider a shorting opportunity on the 1-hourly chart, targeting the retest of the resistance level at 0.8908.
The pivotal question arises: What's your trade plan? Your insights carry weight. Please share your perspective below!
