Bullish rise?AUD/CAD is reacting off the pivot and could rise to the 1st resistance.
Pivot: 0.88549
1st Support: 0.87948
1st Resistance: 0.89499
Risk Warning:
Trading Forex and CFDs carries a high level of risk to your capital and you should only trade with money you can afford to lose. Trading Forex and CFDs may not be suitable for all investors, so please ensure that you fully understand the risks involved and seek independent advice if necessary.
Disclaimer:
The above opinions given constitute general market commentary, and do not constitute the opinion or advice of IC Markets or any form of personal or investment advice.
Any opinions, news, research, analyses, prices, other information, or links to third-party sites contained on this website are provided on an "as-is" basis, are intended only to be informative, is not an advice nor a recommendation, nor research, or a record of our trading prices, or an offer of, or solicitation for a transaction in any financial instrument and thus should not be treated as such. The information provided does not involve any specific investment objectives, financial situation and needs of any specific person who may receive it. Please be aware, that past performance is not a reliable indicator of future performance and/or results. Past Performance or Forward-looking scenarios based upon the reasonable beliefs of the third-party provider are not a guarantee of future performance. Actual results may differ materially from those anticipated in forward-looking or past performance statements. IC Markets makes no representation or warranty and assumes no liability as to the accuracy or completeness of the information provided, nor any loss arising from any investment based on a recommendation, forecast or any information supplied by any third-party.
AUDCAD

Bullish momentum to extend?AUD/CAD has bounced off the support level which is a pullback support and could potentially rise from this level to our take profit.
Entry: 0.88518
Why we like it:
There is a pullback support level.
Stop loss: 0.87962
Why we like it:
There is a pullback support level.
Take profit: 0.89544
Why we like it:
There is an overlap resistance level that lines up with the 61.8% Fibonacci projection.
Enjoying your TradingView experience? Review us!
Please be advised that the information presented on TradingView is provided to Vantage (‘Vantage Global Limited’, ‘we’) by a third-party provider (‘Everest Fortune Group’). Please be reminded that you are solely responsible for the trading decisions on your account. There is a very high degree of risk involved in trading. Any information and/or content is intended entirely for research, educational and informational purposes only and does not constitute investment or consultation advice or investment strategy. The information is not tailored to the investment needs of any specific person and therefore does not involve a consideration of any of the investment objectives, financial situation or needs of any viewer that may receive it. Kindly also note that past performance is not a reliable indicator of future results. Actual results may differ materially from those anticipated in forward-looking or past performance statements. We assume no liability as to the accuracy or completeness of any of the information and/or content provided herein and the Company cannot be held responsible for any omission, mistake nor for any loss or damage including without limitation to any loss of profit which may arise from reliance on any information supplied by Everest Fortune Group.

AUD-CAD Free Signal! Sell!
Hello,Traders!
AUD-CAD shot up sharply
But the pair failed to break
A horizontal resistance
Level of 0.8880 and we are
Already seeing a local pullback
Which is likely to turn into a
Local correction on Monday
So we can enter a short trade
With the Take Profit of 0.8779
And the Stop Loss of 0.8887
Sell!
Comment and subscribe to help us grow!
Check out other forecasts below too!
Disclosure: I am part of Trade Nation's Influencer program and receive a monthly fee for using their TradingView charts in my analysis.

#AUDCAD: Following a sell off, we might see price filling FVG. AUDCAD plummeted due to the NFP data, causing a record low price. However, it left a significant void area. The price has changed its behaviour, showing an increasing bullish presence. We only have one target where the price is likely to drop again heavily.
Good luck and trade safely. Like and comment for more!
Team Setupsfx_

AUD/CAD BEARS ARE GAINING STRENGTH|SHORT
Hello, Friends!
AUD/CAD pair is trading in a local uptrend which we know by looking at the previous 1W candle which is green. On the 1H timeframe the pair is going up too. The pair is overbought because the price is close to the upper band of the BB indicator. So we are looking to sell the pair with the upper BB line acting as resistance. The next target is 0.882 area.
Disclosure: I am part of Trade Nation's Influencer program and receive a monthly fee for using their TradingView charts in my analysis.
✅LIKE AND COMMENT MY IDEAS✅

Daily Price Action: AUDCAD Thursday 4/17/2025In this video, we will be looking into the potential price action of AUDCAD.

Bearish drop off pullback resistance?AUD/CAD has rejected off the pivot which is a pullback resistance and could drop to the 1st support which has been identified as a pullback support.
Pivot: 0.88549
1st Support: 0.87205
1st Resistance: 0.89370
Risk Warning:
Trading Forex and CFDs carries a high level of risk to your capital and you should only trade with money you can afford to lose. Trading Forex and CFDs may not be suitable for all investors, so please ensure that you fully understand the risks involved and seek independent advice if necessary.
Disclaimer:
The above opinions given constitute general market commentary, and do not constitute the opinion or advice of IC Markets or any form of personal or investment advice.
Any opinions, news, research, analyses, prices, other information, or links to third-party sites contained on this website are provided on an "as-is" basis, are intended only to be informative, is not an advice nor a recommendation, nor research, or a record of our trading prices, or an offer of, or solicitation for a transaction in any financial instrument and thus should not be treated as such. The information provided does not involve any specific investment objectives, financial situation and needs of any specific person who may receive it. Please be aware, that past performance is not a reliable indicator of future performance and/or results. Past Performance or Forward-looking scenarios based upon the reasonable beliefs of the third-party provider are not a guarantee of future performance. Actual results may differ materially from those anticipated in forward-looking or past performance statements. IC Markets makes no representation or warranty and assumes no liability as to the accuracy or completeness of the information provided, nor any loss arising from any investment based on a recommendation, forecast or any information supplied by any third-party.

AUD-CAD Will Fall! Sell!
Hello,Traders!
AUD-CAD made a retest of
The horizontal resistance
of 0.8880 then established
A double top pattern so we
Bearish biased and we will
Be expecting a furter
Bearish move down
Sell!
Comment and subscribe to help us grow!
Check out other forecasts below too!
Disclosure: I am part of Trade Nation's Influencer program and receive a monthly fee for using their TradingView charts in my analysis.

Daily Price Action: AUDCAD Wednesday 4/16/2025 n this video, we will be looking into the potential price action of AUDCAD.

AUDCAD: Bearish Continuation is Highly Probable! Here is Why:
The charts are full of distraction, disturbance and are a graveyard of fear and greed which shall not cloud our judgement on the current state of affairs in the AUDCAD pair price action which suggests a high likelihood of a coming move down.
Disclosure: I am part of Trade Nation's Influencer program and receive a monthly fee for using their TradingView charts in my analysis.
❤️ Please, support our work with like & comment! ❤️

AUDCAD Is Very Bullish! Long!
Here is our detailed technical review for AUDCAD.
Time Frame: 2h
Current Trend: Bullish
Sentiment: Oversold (based on 7-period RSI)
Forecast: Bullish
The market is approaching a significant support area 0.853.
The underlined horizontal cluster clearly indicates a highly probable bullish movement with target 0.869 level.
P.S
Overbought describes a period of time where there has been a significant and consistent upward move in price over a period of time without much pullback.
Disclosure: I am part of Trade Nation's Influencer program and receive a monthly fee for using their TradingView charts in my analysis.
Like and subscribe and comment my ideas if you enjoy them!

Daily Price Action: AUDCAD Tuesday 4/15/2025In this video, we will be looking into the potential price action of AUDCAD.

AUD/CAD "Aussie-Loonie" Forex Market Heist Plan (Scalping/Day)🌟Hi! Hola! Ola! Bonjour! Hallo! Marhaba!🌟
Dear Money Makers & Robbers, 🤑 💰💸✈️
Based on 🔥Thief Trading style technical and fundamental analysis🔥, here is our master plan to heist the AUD/CAD "Aussie-Loonie" Forex Market. Please adhere to the strategy I've outlined in the chart, which emphasizes long entry. Our aim is to escape near the high-risk MA Zone. Risky level, overbought market, consolidation, trend reversal, trap at the level where traders and bearish robbers are stronger. 🏆💸"Take profit and treat yourself, traders. You deserve it!💪🏆🎉
Entry 📈 : "The vault is wide open! Swipe the Bullish loot at any price - the heist is on!
however I advise to Place buy limit orders within a 15 or 30 minute timeframe nearest or swing low or high level for pullback entries.
Stop Loss 🛑:
📍 Thief SL placed at the recent/swing low level Using the 30mins timeframe (0.86400) Day trade basis.
📍 SL is based on your risk of the trade, lot size and how many multiple orders you have to take.
🏴☠️Target 🎯: 0.89500 (or) Escape Before the Target
🧲Scalpers, take note 👀 : only scalp on the Long side. If you have a lot of money, you can go straight away; if not, you can join Day traders and carry out the robbery plan. Use trailing SL to safeguard your money 💰.
💰💵💸AUD/CAD "Aussie-Loonie" Forex Market Heist Plan (Scalping/Day) is currently experiencing a bullishness,., driven by several key factors. 👇👇👇
📰🗞️Get & Read the Fundamental, Macro, COT Report, Quantitative Analysis, Sentimental Outlook, Intermarket Analysis, Future trend targets and Overall outlook score..., go ahead to check 👉👉👉🔗
⚠️Trading Alert : News Releases and Position Management 📰 🗞️ 🚫🚏
As a reminder, news releases can have a significant impact on market prices and volatility. To minimize potential losses and protect your running positions,
we recommend the following:
Avoid taking new trades during news releases
Use trailing stop-loss orders to protect your running positions and lock in profits
💖Supporting our robbery plan 💥Hit the Boost Button💥 will enable us to effortlessly make and steal money 💰💵. Boost the strength of our robbery team. Every day in this market make money with ease by using the Thief Trading Style.🏆💪🤝❤️🎉🚀
I'll see you soon with another heist plan, so stay tuned 🤑🐱👤🤗🤩

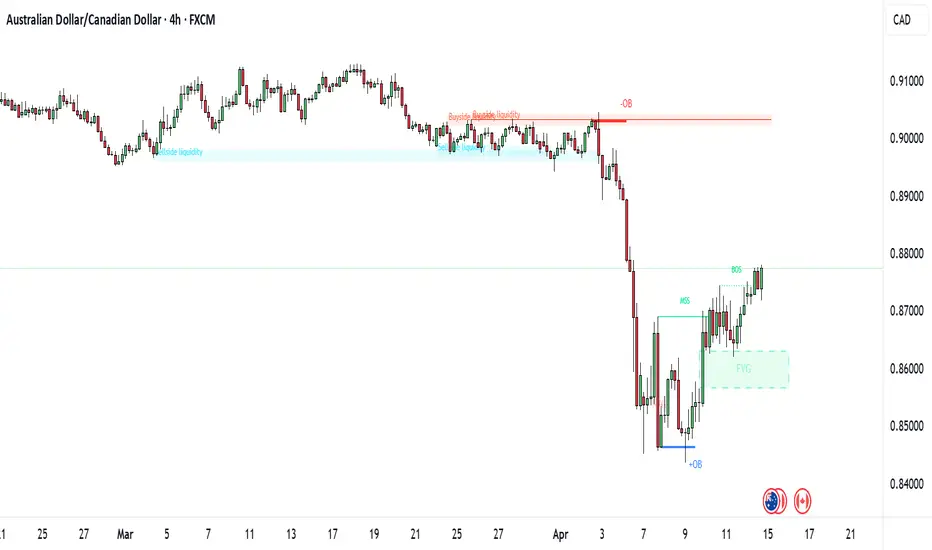
AUD/CAD 4H Analysis – Smart Money Building a CaseStructure: Bullish | Timeframe: 4H | Pair: AUD/CAD
Alright, keeping this clean and honest 👇
Price swept buyside liquidity earlier around 0.90500, tapped into a bearish order block and dumped hard. That entire move was textbook—OB reaction, BOS confirmed, and then a clean drive down.
Fast-forward:
We swept sell-side liquidity at the bottom (~0.84400), tapped into a refined bullish OB and flipped structure with an MSS → then BOS followed. So yes, bulls took control.
After that, price formed an FVG between 0.85700 and 0.86100 — and it filled beautifully. Price respected it, and we pushed up toward 0.87800.
Right now… we’re in premium territory.
Let me say it clearly:
No fresh buys here. Not the place.
We wait for the price to come back to the FVG zone or OB and then look for a lower timeframe CHoCH or bullish candle.
Not guessing.
Not forcing.
Just reacting to the flow.
If price breaks below BOS and closes below FVG → we flip bias. Simple.
Until then:
📌 Patience wins. Revenge trading doesn’t.
💬 Drop a comment if you're watching this level too.
Let’s see if smart money brings it home from the FVG again.
And yeah, follow if you trade based on logic, not hype.
#AUDCAD #SMC #OrderBlock #FairValueGap #SmartMoney #LiquiditySweep #ForexCitySignal #NoRetailNoise
AUD/CAD BUYERS WILL DOMINATE THE MARKET|LONG
Hello, Friends!
AUD/CAD pair is in the uptrend because previous week’s candle is green, while the price is obviously falling on the 1H timeframe. And after the retest of the support line below I believe we will see a move up towards the target above at 0.870 because the pair is oversold due to its proximity to the lower BB band and a bullish correction is likely.
Disclosure: I am part of Trade Nation's Influencer program and receive a monthly fee for using their TradingView charts in my analysis.
✅LIKE AND COMMENT MY IDEAS✅

AUDCAD Excellent Channel Down bottom opportunity.The AUDCAD pair has been trading within a long-term Channel Down since the January 26 2023 High and the recent Trade War fueled sell-off took the price almost on its bottom (Lower Lows trend-line).
The 1D RSI got vastly oversold at 14.00 and a bottom is to be expected within the next 2 weeks. Still, this level is low enough to be considered a solid long-term buy opportunity already. The previous bottom rebound targeted initially the 0.5 Fibonacci retracement level, so our target is 0.88850 on the medium-term.
-------------------------------------------------------------------------------
** Please LIKE 👍, FOLLOW ✅, SHARE 🙌 and COMMENT ✍ if you enjoy this idea! Also share your ideas and charts in the comments section below! This is best way to keep it relevant, support us, keep the content here free and allow the idea to reach as many people as possible. **
-------------------------------------------------------------------------------
Disclosure: I am part of Trade Nation's Influencer program and receive a monthly fee for using their TradingView charts in my analysis.
💸💸💸💸💸💸
👇 👇 👇 👇 👇 👇

AUDCAD LONG FORECAST Q2 W15 D9 Y25AUDCAD LONG FORECAST Q2 W15 D9 Y25
Welcome back traders!
Here's a setup for us to wait upon and ponder.

AUDCAD Discretionary Analysis: Next stop? Rock bottomIt’s more of a sixth sense (like when you just know your girlfriend's about to cancel plans). AUDCAD’s giving off that "Next stop? Rock bottom" kind of energy. I see it dropping hard, like it missed the elevator and took the shaft instead. If I’m right, I’ll be looking at some solid trades to take. If I’m wrong, well, I’ll just grab a coffee and wait for the next pair to make its move.
Just my opinion, not financial advice.

#AUDCAD: Using 1-Day Time Frame For Intraday Entry! We have been closely monitoring the AUDCAD currency pair for an extended period and believe that selling AUDCAD at the current market conditions presents a more favourable opportunity with a sufficient number of sellers. However, we must acknowledge that we need to wait for the price to approach our entry zone, which will allow us to execute a sell entry with strict risk management. This analysis has identified a single target.
We extend our best wishes for your success and encourage you to provide support by liking and commenting on the idea.
Team Setupsfx_

AUD/CAD BUYERS WILL DOMINATE THE MARKET|LONG
AUD/CAD SIGNAL
Trade Direction: long
Entry Level: 0.880
Target Level: 0.889
Stop Loss: 0.874
RISK PROFILE
Risk level: medium
Suggested risk: 1%
Timeframe: 1h
Disclosure: I am part of Trade Nation's Influencer program and receive a monthly fee for using their TradingView charts in my analysis.
✅LIKE AND COMMENT MY IDEAS✅

AUDCAD Discretionary Analysis: Taking the Elevator DownIt’s more of a sixth sense(like when you just know the milk is bad before you smell it). I think it’s headed down, like an elevator with a broken cable . If I’m right, I’ll make some money. If I’m wrong, well… guess I’ll take the stairs next time.
Just my opinion, not financial advice.

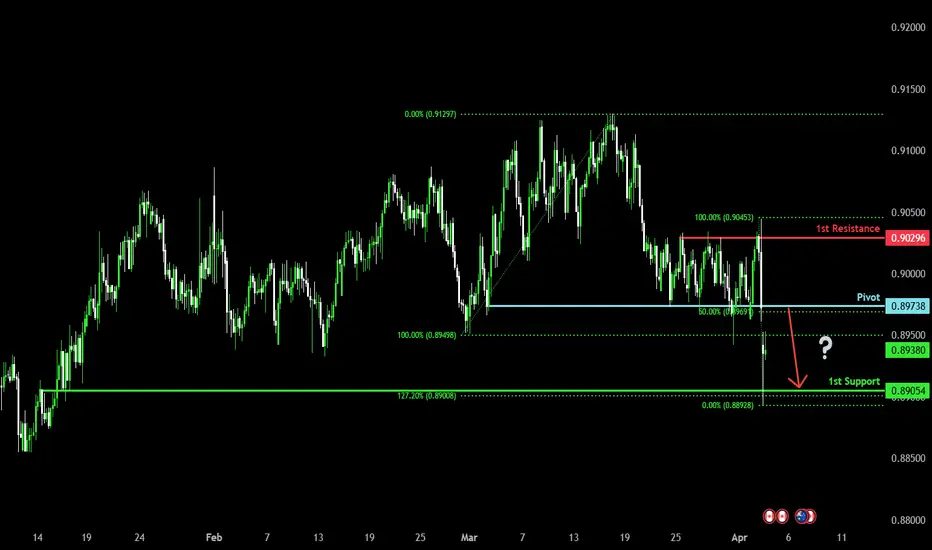
Bearish reversalAUD/CAD is rising towards the pivot which is a pullback resistance and could reverse to the 1st support which line sup with the 127.2% Fibonacci extension.
Pivot: 0.89738
1st Support: 0.89054
1st Resistance: 0.90296
Risk Warning:
Trading Forex and CFDs carries a high level of risk to your capital and you should only trade with money you can afford to lose. Trading Forex and CFDs may not be suitable for all investors, so please ensure that you fully understand the risks involved and seek independent advice if necessary.
Disclaimer:
The above opinions given constitute general market commentary, and do not constitute the opinion or advice of IC Markets or any form of personal or investment advice.
Any opinions, news, research, analyses, prices, other information, or links to third-party sites contained on this website are provided on an "as-is" basis, are intended only to be informative, is not an advice nor a recommendation, nor research, or a record of our trading prices, or an offer of, or solicitation for a transaction in any financial instrument and thus should not be treated as such. The information provided does not involve any specific investment objectives, financial situation and needs of any specific person who may receive it. Please be aware, that past performance is not a reliable indicator of future performance and/or results. Past Performance or Forward-looking scenarios based upon the reasonable beliefs of the third-party provider are not a guarantee of future performance. Actual results may differ materially from those anticipated in forward-looking or past performance statements. IC Markets makes no representation or warranty and assumes no liability as to the accuracy or completeness of the information provided, nor any loss arising from any investment based on a recommendation, forecast or any information supplied by any third-party.
AUDCAD LONG/BUYBy utilizing Fibonacci retracement levels, historical patterns, , we can formulate a hypothesis that the market might follow a similar trajectory if bearish sentiment prevails.
