Audcadanalysis

Potential Bullish Signal: Why I'm Watching the 0.875 Level?In the Daily charts, we've now retraced 100% of our last leg up . You can see right below the starting point of the leg up, we have a Weekly Demand/Buy zone beginning around the 0.875 level. Bulls might find this an enticing target for market entry, on a bullish signal.
This area could potentially be a 'STOP HUNT' zone. As we all know how retail traders often set their stops under swing lows, as taught in many trading books.
My buy strategy involves seeking buy signals as we approach the 0.875 level. There might be a brief plunge to this level, followed by a sharp upward move.
This is a short term trade idea , my target will be aiming for the 0.90 area with a stop loss set below 0.863. I will be looking for bullish signals on the lower timeframes using my TRFX indicator.
I hope you find this analysis helpful. Happy trading!

sell setup for audcad the price now is trading out the up-channel
and also below the support level now turned into resistance
so we expect more continuation to the downside
_____________________________________________________________
don't forget your risk management
follow for more :))

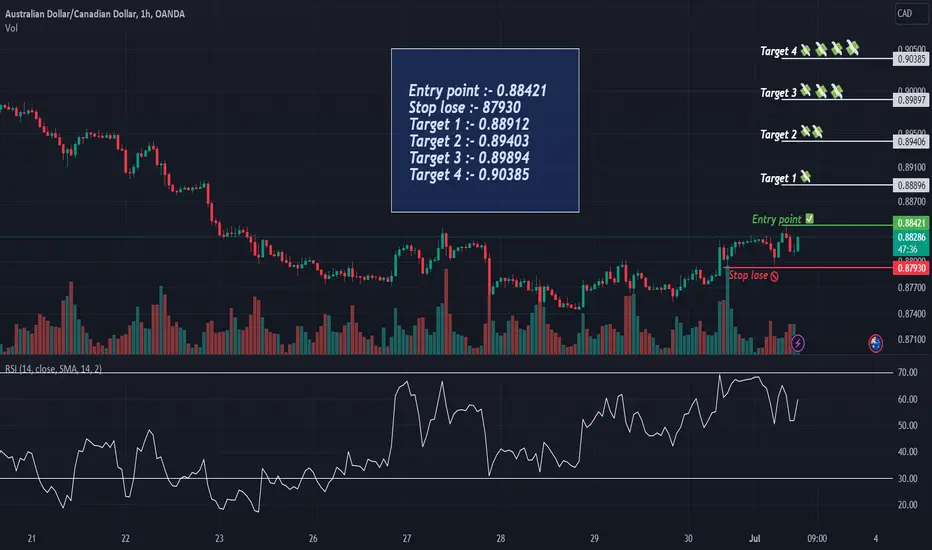
AUDCAD Bullish viewEntry point :- 0.88421
Stop lose :- 87930
Target 1 :- 0.88912
Target 2 :- 0.89403
Target 3 :- 0.89894
Target 4 :- 0.90385
AUDCAD BuyAUD is much stronger than CAD. I believe that AUDCAD pair will rise same as it was fall. Better to look buying opportunities on it.

AUDCAD Idea H1Here is my analysis for AUDCAD on H1 using Order Block. The price could go bearish, you can put a pending order on the Order block or find an entry on LTF within OB Zone. Trade Safe!

AUDCAD LongOANDA:AUDCAD
RSI was in a long oversold and it has ended. The price has also reached a very important support level. The key points for the target are the 38%, 50%, 61.8% and 88% Fibonacci percentages. what's your opinion?

AUD/CAD Giving Good Bullish P.A , Can We Buy It Now ?This Is An Educational + Analytic Content That Will Teach Why And How To Enter A Trade
Make Sure You Watch The Price Action Closely In Each Analysis As This Is A Very Important Part Of Our Method
Disclaimer : This Analysis Can Change At Anytime Without Notice And It Is Only For The Purpose Of Assisting Traders To Make Independent Investments Decisions.

#AUDCAD - Long 1H☑️Broke the structure on the 1H timeframe
☑️Lots of liquidity on the left side
If we break down the red level on the 1H timeframe, the analysis becomes invalid🙅♂️
Good luck 🙌💪

AUDCAD Long Term Trading IdeaHello Traders
In This Chart AUDCAD HOURLY Forex Forecast By FOREX PLANET
today AUDCAD analysis 👆
🟢This Chart includes_ (AUDCAD market update)
🟢What is The Next Opportunity on AUDCAD Market
🟢how to Enter to the Valid Entry With Assurance Profit
This CHART is For Trader's that Want to Improve Their Technical Analysis Skills and Their Trading By Understanding How To Analyze The Market Using Multiple Timeframes and Understanding The Bigger Picture on the Charts.

AUD/CAD - Short; Decisive break, SELL this this for good.Lock and load (Short) and forget it. The Chinese collapse will take down the Aussies, right along with them. 'nough said.
(Might wanna amuse yourself with the Aussie real estate bubble! They have built enough - empty, ridiculously overpriced - stuff to house half of China. - Perhaps the half that is about to lay down and die, due to old age?! ...) Pahleeeease ...

AUDCAD Analysis H1Here is my analysis for AUDCAD on H1 by using Order Block. The price could go bearish, you can put a pending order on the Order block or find an entry on LTF within OB Zone. Trade Safe!

DeGRAM | AUDCAD broke out of the ascending channelAUDCAD is testing the support level as well as the psychological level of 0.89000 .
The market pulled back to the support level, which is the kill zone: support + 61.8% fibo.
If price action creates a double bottom, it is going to be double confirmation.
Price action is likely to retest the resistance level.
-------------------
Share your opinion in the comments and support the idea with like. Thanks for your support!

AUDCAD Looking to go shortThis pair broke below the significant s/r zone around 0.9000 and is now pulling back towards it.
I am looking for signs of a bearish continuation in that area.
Nothing is 100% in trading, so as always, use sound money and risk management and stay patient in all your trades. If you like my analysis, please give it a “thumbs up” and follow me to get even more awesome content.
What do you think about this trade idea? Please comment and share your thoughts!!

AUDCAD forecast 19June2023The bullish channel formed has now been broken with a series of bearish candles, this is a sign of a reversal even though it is minor. There is a high probability that the bearish will continue if the price can touch the 0.618 fibo retracement area.

AUDCAD Analysis H1Here is my analysis for AUDCAD on H1 with Order Block. The price could go bearish, you can put a pending order on the Order block or find an entry on LTF within OB Zone. Trade Safe!

AUDCAD Long Term Trading IdeaHello Traders
In This Chart AUDCAD HOURLY Forex Forecast By FOREX PLANET
today AUDCAD analysis 👆
🟢This Chart includes_ (AUDCAD market update)
🟢What is The Next Opportunity on AUDCAD Market
🟢how to Enter to the Valid Entry With Assurance Profit
This Video is For Trader's that Want to Improve Their Technical Analysis Skills and Their Trading By Understanding How To Analyze The Market Using Multiple Timeframes and Understanding The Bigger Picture on the Charts.

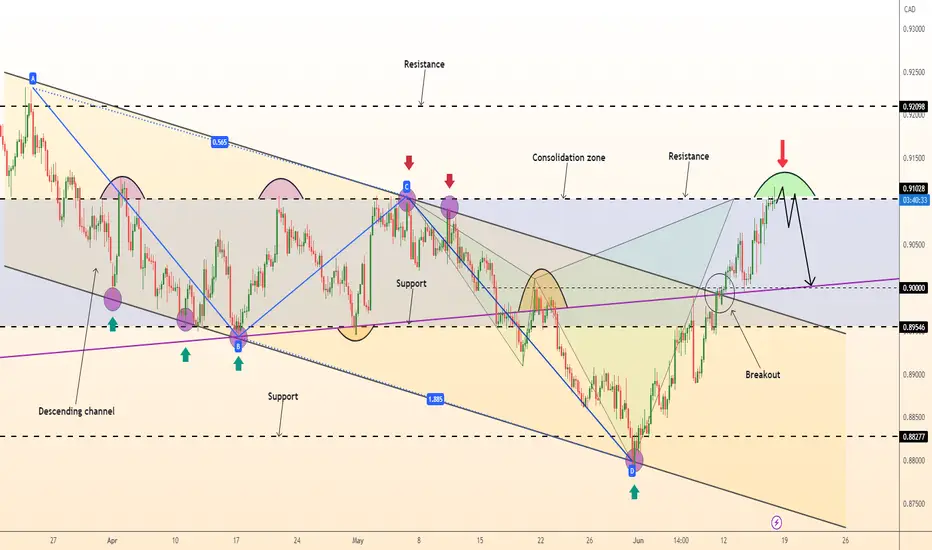
DeGRAM | AUDCAD confluence levelAUDCAD is testing the psychological level 0.91000.
The market made a complex pullback to the resistance level.
Also bearish harmonic pattern as additional confirmation.
We expect a pullback from resistance.
-------------------
Share your opinion in the comments and support the idea with like. Thanks for your support!
AUDCAD Breakout Long! AUD-CAD broke the
Resistance cluster of the
Falling and horizontal level of 0.896
And the breakout is confirmed
Because the 12H candle closed
Above the cluster so now
I am bullish biased
And I think that the pair
Will go higher up!

AUDJPY and AUDCAD Top-down analysis Hello traders, this is a complete multiple timeframe analysis of this pair. We see could find significant trading opportunities as per analysis upon price action confirmation we may take this trade. Smash the like button if you find value in this analysis and drop a comment if you have any questions or let me know which pair to cover in my next analysis.

AUDCAD Resistance Cluster! AUD-CAD is trading in a
Downtrend and the pair
Is now about to retest
A resistance cluster of
The falling and horizontal
Level at around 0.89600
From where a move
Down is likely !

DeGRAM | AUDCAD psychological levelAUDCAD is pulling back to the confluence level: the fibo and psychological level.
The market made a complex pullback to the resistance level. Also bearish harmonic pattern as additional confirmation.
We expect a pullback from resistance.
-------------------
Share your opinion in the comments and support the idea with like. Thanks for your support!

AUDCAD : Short Trade , 4hHello traders, we want to check the AUDCAD chart in the 4-hour time frame. The price is moving in a descending channel and has pulled back to the previous floor that was broken. We expect this level to play the role of a resistance level for us and the trend Keep the price down and cause the price to fall until the specified targets. Good luck.
AUDCAD sell Entry : 0.89660
Stop : 0.90625 , Target1 : 0.88590 , Target2 : 0.87730
Risk/Reward Ratio : 2
