AUD/CAD Full Analysis , Long & Short Setups, Watch Carefully This Is An Educational + Analytic Content That Will Teach Why And How To Enter A Trade
Make Sure You Watch The Price Action Closely In Each Analysis As This Is A Very Important Part Of Our Method
Disclaimer : This Analysis Can Change At Anytime Without Notice And It Is Only For The Purpose Of Assisting Traders To Make Independent Investments Decisions.
Audcadanalysis

DeGRAM | AUDCAD target for short in the range zoneAUDCAD is ranging between 0.93200 and 0.9200 levels.
The market is testing a potential reversal zone.
Price action is likely to move down from the kill zone: the resistance + 61.8% fibo and bearish harmonic pattern.
We expect a pullback from the resistance level .
-------------------
Share your opinion in the comments and support the idea with like. Thanks for your support!

AUDCAD - Short from bearish order block ✅Hello traders!
‼️ This is my perspective on AUDCAD.
After the change of character I started to look for short positions. I expect price to reject from one of the bearish order block.
‼️Attention!!! Due to the fact that we have news on AUD this week, the analysis can be invalidated.
Like, comment and subscribe to be in touch with my content!

DeGRAM | AUDCAD target for shortAUDCAD is currently pulling back to the broken resistance level and dynamic resistance.
The market is testing a swing zone and fibo level.
Price action is likely to move down from the kill zone: the resistance + 50% fibo psychological level of 0.93000.
We expect a pullback from the resistance level .
-------------------
Share your opinion in the comments and support the idea with like. Thanks for your support!

AUD/CAD multiple Set Up's In PlayWhat's Up therealtraders! here i share my analysis with aud/cad looks like we're going to see a reaction incoming for a price reversal potentially back to double top to the upside or even slightly higher to trap Buyers by creating a higher high on the shorter time frames
before entering this set up we would like to see bullish confirmation on the smaller time frames 4 hr-1hr time frame
if we get confirmation we enter and ride the move up with profit taking a must because i do see this coming back down in a big way, and whether we pull up or not it could drop hard so wait for confirmation either for rejection for the buy or breaks for the sells

AUDCAD SHORT - BIG REVERSAL IS HERE!Waiting for a retest of 0.92976 to short AUDCAD back down to key 4H target at 0.90663
If you agree drop a like and if you have any questions leave a comment:)

AUDCAD IDEAi am expecting too see this pair reaching the level of 0.91 but if the trend remains bullish a potential entry is at the level of 0.94422 and profit at the resistance area at the level of 0.93759

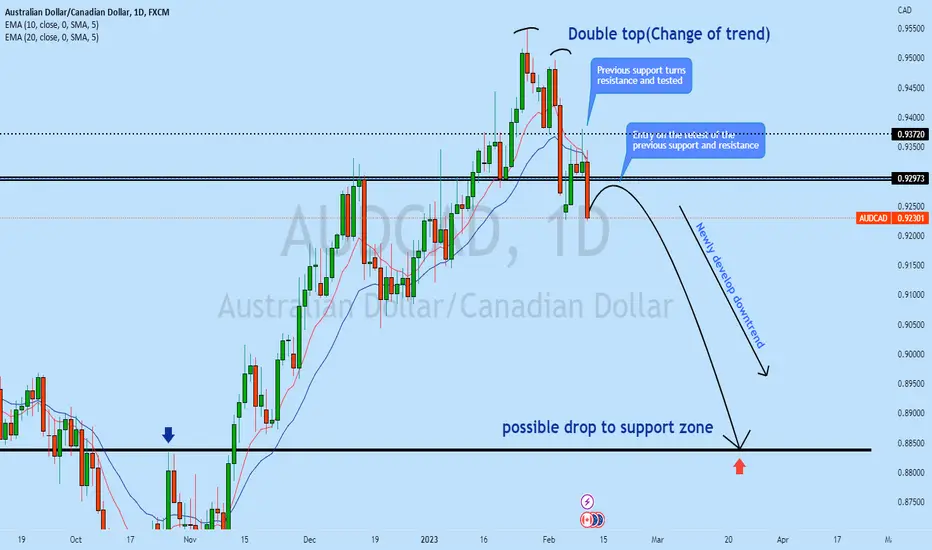
AUDCAD possible drop to support levelCurrency Pair : AUDCAD
Possible direction : Bearish
Technical Analysis : Price has formed a double top on the daily timeframe and broken out of this double top. Tested the previous support as resistance and rejected to the downside signaling possible trend change. As from daily price action, we see possible support turns resistance and highly likely price will continue to drop after testing the previous support as resistance and a sell trade is highly probably from this high area of value.
Possible trade recommendation : Bearish as per chart sketch
Press like button if you enjoy.
Risk Disclaimer: Trading foreign exchange on margin carries a high level of risk, and is not suitable for all investors. Past performance is not indicative of future results. The high degree of leverage is dangerous and can work against you as well as for you. Before deciding to invest in foreign exchange or any market you should carefully consider your investment goals, level of experience, and risk tolerance. It is EXTREMELY LIKELY that you will sustain a loss of some or all of your initial investment and therefore you should not invest money that you cannot afford to lose. No representation is being made that any account will or is likely to achieve profits or losses. Past performance is not indicative of future results. Individual results vary and no representation is made that clients will or are likely to achieve profits or incur losses comparable to those that may be shown. You acknowledge and agree that no promise or guarantee of success or profitability has been made between you, and Forex Trading Wizard. Do your own research and talk to a professional financial planner in order to be aware of all the risks associated with foreign exchange trading and investing and seek advice from an independent financial advisor before risking any capital.
AUD/CAD (11/02/23) Weekly Chart - Bulls controlAt present, the bullish trend in the AUD/CAD currency pair appears to be strong and unrelenting. The market is approaching a supply zone with an inducement, which could potentially provide a good selling opportunity. The presence of gaps in the market supports this possibility. Despite the bullish trend, the I believe that it would be beneficial to wait for a dip in the price before making a purchase. The liquidity at the bottom of the range, combined with the potential for lower prices, suggests that there may be a chance for a more advantageous buying opportunity in the near future.
I wishes everyone good luck and a profitable week ahead in the foreign exchange market.

AUDCAD : Short Trade , 1hAUDCAD sell Entry : 0.93715
Stop : 0.94330 , Target1 : 0.93199 , Target2 : 0.92485
Risk/Reward Ratio : 2

AUDCAD Trading Plan - 7/Feb/2023Hello Traders,
Hope you all are doing good!!
I expect AUDCAD to go Down after finishing this correction.
Look for your SELL setups.
Please follow me and like if you agree or this idea helps you out in your trading plan.
Disclaimer: This is just an idea. Please do your own analysis before opening a position. Always use SL & proper risk management.
Market can evolve anytime, hence, always do your analysis and learn trade management before following any idea.

AUDCAD - Short from bearish order block ✅Hello traders!
‼️ This is my perspective on AUDCAD .
Here we are in a bearish market structure from H4 timeframe perspective, after change of character. I expect price to continue the retracement to fill the imbalance higher and then to reject from bearish order block + institutional big figure 0.94000.
Like, comment and subscribe to be in touch with my content!

AUDCAD : Bull tunnel entry post 9 week breakout up! 30.5Simple technicals combined with a broad perspective.
1) Resistance trend-line ongoing since April 5th was broken 24th may, indicating bull trend initiating.
2) Since breakout, connecting lows and highs are parallels indicating a consistent up-trend in the shape of a tunnel.
The range of the tunnel is 0.980 to 0.916 , current rate is 0.911.
A break below 0.980 with a daily close would confirm downside potential to 0.9000.
So buying now and placing a stop lower than 0.980 is the first option with a TP at 0.916.
Second option is to to wait for a 4h candle close break above 0.916 and TP at 0.9222 with a SL back below at 0.9135.
---------------------------------------------------------------------------------------------------------------------
I hope you this was helpful! If you found that it was, please like and follow! Would truly mean a lot.
Thank you so much for reading - I encourage you to ask questions, make comments.. I promise to reply to each one.
I am not a financial advisor and it's best to make your own research and trade cautiously.
----------------------------------------------------------------------------------------------------------------------

DeGRAM | AUDCAD double bottomAUDCAD is currently near the psychological level of 93.000 .
The market pulled back to the support level, which is the confluence zone .
Price action printed a double bottom, indicating that there's no strength.
Price action is likely to retest the resistance level.
-------------------
Share your opinion in the comments and support the idea with like. Thanks for your support!

AUD/CAD LONG TRADE ...According to SMC , price reached an OB and OTE ...
We have a trade entry for long on AUD/CAD pair as following :
ENTRY @ 0.92798 (Direct entry with market open) ...
SL @ 0.92512
TP @ 0.93675
RRR : 1:3.07
GOOD LUCK GUYS ...

High AUDCAD liquidityExperiencing this drop because the market has made a wipe out to the daily liquidity pool. The 4h breaker block added more liquidity to the fall which broke below the low. This aggressive move was also affected by the NFP event, if price happens to continue dropping and does not make a wipe out, then this potential break of structure is headed to the demand zone for a reversal to occur and for buyers to take over...

#AUDCAD SHORT TIME -TODAY 2023.2.4And in the last stage, we have the 45-minute time check:
We are now on the reciprocal completion area around 0.92559. The ranges between 0.92559 and 0.91923 can be considered as areas for correction, and all the decreasing targets from the return range to 0.93234 can act as resistance areas in correction, generally they cover 50% of their sharp movements.
The major wave in the 45-minute time period is a decrease and any rise is only until the correction is confirmed. If the upward wave is corrected, we can expect a decrease to the range of 0.91512 and then an important static range overlapping with the corrective fibo in the area of 0.90925.

AUDCAD SellGood day everyone! Don't forget to put your thumbs up and write comment if you like the idea.
AUDCAD sell 0.94365 and 0.94837. SL 0.9600. Risk 1%. Sale from monthly and weekly target area. In the week they came for a test of the upper edge of the balance sheet , and in the week for commercial interest for sale. First Target Standard, Global Target Return to Area 0.92710.
DISCLAIMER:
The opinion of the author may not coincide with yours! Keep this in mind and consider in your trading transactions before making a trading decision.

AUDCAD - Selloff continuation ✅Hello traders!
‼️ This is my perspective on AUDCAD .
Here I expect bearish price action to continue as price took out buy stop liquidity and rejected from institutional big figure 0.95000. Also an argument is that price forme a normal divergence on daily timeframe.
‼️Attention!!! Due to the fact that we have a lot of news events upcoming week, the analysis can be invalidated.
Like, comment and subscribe to be in touch with my content!

AUDCAD idea longAUDCAD idea long what do you think about it
4h order block meet with 4h trendline a high opportunity price going up from the zone apear in chart

DeGRAM | AUDCAD target for longAUDCAD is currently trading in an ascending channel.
The market pulled back to the support level, which is the confluence zone .
Notice, price action approached the level by printing small candles with deceleration, indicating that there's no strength.
Price action is likely to pullback to the support level and go up if price makes a false break.
-------------------
Share your opinion in the comments and support the idea with like. Thanks for your support!

AUDCAD is at Support @ 0.94ishAUDCAD is at Support @ 0.94ish from the 4 hour chart as you can see. I expect a little push towards the upside

Three bullish scenariosAfter the 3-bar-pattern fractal high, the price made a shift in market structure and made one impulsive bearish move. Then made a retest to complete the head and shoulders pattern. Currently at this 4h breaker block, should the market respect this area then we go aggressively bullish to the high at 0.95462. If not, then we target the imbalance or 0.93800 demand zone in order to go bullish…
