AUDCAD,🟢Bullish scenarios🟢 (Read the caption)
Well, the price reached the extreme demand zone in the daily chart.
As you can see the price created the liquidity pool above the demand zone and had a bullish reaction after sweeping the liquidity and hitting the demand zone.
Now, we can expect two different scenarios for uptrend.
1. The price can start rising from here because it hit an important level and had a bullish reaction.
2. The price can re-test the lower demand zone that is clear and untouched.
In both scenarios, we can define the previous high as a first target and the liquidity above equal highs as a final target.
💡Wait for the update!
🗓️31/01/2024
🔎 DYOR
💌It is my honor to share your comments with me💌
Audcadanalysis

AUDCAD Trade IdeaThe AUDCAD pair has reached a critical support level, marked by this horizontal line on our chart that corresponds to a previous daily open/close. The price is clearly overextended and we expect a correction soon. A potential trade setup may arise later today when the Canadian GDP data is announced. If the data is positive for the CAD, this could offer a good sell opportunity. We are eagerly awaiting this news release. Please note that this is only a trade idea and not a trade recommendation, the information is for educational purposes only and should not be considered as financial advice.

AUDCAD H1 / Expecting a Strong Bullish Move 💲📈 Hello Traders!
This is my forecast for AUDCAD H1. I expect a bullish move on H1 if the retracement will be valid. I expect a rise until the OB around the price of 0.89700.
Traders, if you liked my idea or if you have a different vision related to this trade, write in the comments. I will be glad to see your perspective.
____________________________________
Follow, like, and comment to see my content:
www.tradingview.com

#AUDCADIn the 4-hour period, it is moving in an ascending channel, which can correct its previous wave up to 61.8 and then enter the correction phase of its previous wave. Therefore, if there is a reaction in the specified limits by forming a negative divergence in the macd oscillator, the return wave can continue up to the green box range. In addition, the return wave should not enter the range of the yellow band, in which case the analysis will be invalidated.

AUDCAD Buying the retracementAUDCAD is on a bearish trend on HTF but currently on a retracment. Giving us HH and HL which makes it bullish on the smaller TF
Price retracing to the LQ found @0.88664.
Im looking at it grabbing that and moving down to the OB below before buying up.
Looking at entry @0.88583
We wait to see market reaction on that block.

DeGRAM | AUDCAD target for short from psychological levelAUDCAD is testing the psychological level at 0.89000 in the ascending channel.
The market is consolidating on the 4-hourly chart, following the bearish move.
Price is likely to move down from the kill zone since the market is consolidating.
We expect a pullback from the resistance level and the continuation of the consolidation.
-------------------
Share your opinion in the comments and support the idea with like. Thanks for your support!

AUDCAD SHORT - FOLLOW THE MOMENTUM!Waiting for an entry pattern at 0.88984 area to short AUDCAD back to key 4H level at 0.87476
If you agree drop a like and if you have any questions leave a comment :)

AUDCAD H4 / PERFECT OB RETRACEMENT / OBBULLISH MOVE ACTIVE✅Hello Traders!
This is My idea related to AUDCAD H4. A very nice retracement from the OB, I expect a strong bullish move until the OB at the price of 0.89600.
Traders, if you liked my idea or if you have a different vision related to this trade, write in the comments. I will be glad to see your perspective.
____________________________________
Follow, like, and comment to see my content:
www.tradingview.com

AUDCAD I Intraday buy from support Welcome back! Let me know your thoughts in the comments!
** AUDCAD Analysis - Listen to video!
We recommend that you keep this pair on your watchlist and enter when the entry criteria of your strategy is met.
Please support this idea with a LIKE and COMMENT if you find it useful and Click "Follow" on our profile if you'd like these trade ideas delivered straight to your email in the future.
Thanks for your continued support!

7 Dimension Analysis for AUDCAD 😇 7 Dimension Analysis
Time Frame: H4
1️⃣ Swing Structure: Bullish
🟢 Structure Behavior: Break of Structure (BoS)
🟢 Swing Move: Impulsive
🟢 Inducement: Done
🟢 Internal Structure: Also bullish
🟢 Decisional FVG liquidity: Mitigated, Making a prebreak out Buildup
🟢 Traps: Fakeout done at the top, grabbed all the swing liquidity from lower side
2️⃣ Pattern
🟢 CHART PATTERNS: Continuation Ascending Triangle
🟢 CANDLE PATTERNS: This is a consolidation area; no valid candle pattern is observed. We will check our candle patterns at the breakout or market opening
3️⃣ Volume
🟢 We need a deep observation of volume on the breakout
🟢 less than the previous move
4️⃣ Momentum RSI
🟢 Zone: Sideways
🟢 Range shift: Bullish to sideways
🟢 Divergence: A bearish divergence is here, but it's weak
5️⃣ Volatility Bollinger Bands
🟢 High level of contraction
🟢 Various Band Punchers on the upper band, but they don't follow up the signal
6️⃣ Strength According to ROC
🟢 Values: AUD is 7.01 vs CAD 3.02
7️⃣ Sentiment
When we mix up all the parameters, there is a high chance the price can go up during the coming sessions, so we need to seek buy entries during the week
✔️ Entry Time Frame: H4
✅ Entry TF Structure: Sideways as internal
☑️ Current move: Impulsive sideways
✔ Support resistance base: Fixed range volume POI
☑️ Candles Behavior: Nothing is clear
💡 Decision: We need to wait for the price to break the upper level or come downside to our POI area, then we can buy this pair
🚀 Entry: 0.8980
✋ Stop Loss: 0.8925
🎯 Take Profit: 0.9150
2nd If Internal Structure changes also Exit 3rd Trendline Breakout, Fomo
😊 Risk to Reward Ratio: 3.1
🕛 Expected Duration: 7 days
SUMMARY: The analysis indicates a bullish stance with a well-defined structure and pattern, though the candle patterns are not clear at the moment. The decision suggests waiting for a breakout or a move to the POI area for a buy entry, considering potential internal structure changes and trendline breakouts.

AUDCAD Short Term Sell IdeaH1 - Bearish trend pattern.
Currently it looks like a pullback is happening.
Until the two strong resistance zones hold my short term view remains bearish here.

AUDCAD UPDATE 1/8/24 2:21AM CENTRAL (LONDON)My analysis of AUDCAD shows that sellers are in control
* AUDCAD is bearish

DeGRAM | AUDCAD trend continuation oppportunityAUDCAD broke and closed below the psychological level at 0.9000 that became resistance.
The market is making low lows and lower closes in the descending channel, an indication of bear dominance.
Price action is likely to move down from the kill zone, psychological level, and 38.2% fibo retracement level.
We expect a trend-continuation trade.
-------------------
Share your opinion in the comments and support the idea with like. Thanks for your support!

AUDCADI am expecting AUDCAD to make a move upward, thereby taking out the previous high before making way to my TP.

AUDCADAUDCAD long term view is bullish where we expect price to grow from the current moment and there are three possible three target, possible of reaching all target duration will be by end of the January. Reason for buying is totally based on technical side of the market and charts does show strong bullish bias. Like and Comment ;)

DeGRAM | AUDCAD target for short from confluenceAUDCAD is moving in the ascending channel. The market is consolidating on the 4 hourly chart.
Price is likely to move down from the confluence zone: the resistance + 88.6% fibo and bearish harmonic pattern.
We expect a pullback from the resistance level and the continuation of the consolidation.
-------------------
Share your opinion in the comments and support the idea with like. Thanks for your support!

AUDCAD possible long for 0.9050demand zone for long 0.8920-8900, one more extreme demand zone 0.8990-80, stop loss: 0.8860, target: 0.9050.

DeGRAM | AUDCAD confluence levelAUDCAD made pullback following the divergence at support.
Price created confluence at resistance level and 50% fibo level.
Price action made lower low and lower close indicating trend shift on the 4h chart.
We expect a retest of the confluence zone and a continuation of the bearish move.
-------------------
Share your opinion in the comments and support the idea with like. Thanks for your support!

AUDCAD SHORT - WAITING FOR BEARISH MOMENTUM!Waiting for a break and retest of 0.88797 to short AUDCAD back to 4H swing low at 0.87728
If you agree drop a like and if you have any questions leave a comment :)

AUDCAD Long Term BUYING Trading IdeaHello Traders
In This Chart AUDCAD DAILY Forex Forecast By FOREX PLANET
today AUDCAD analysis 👆
🟢This Chart includes_ (AUDCAD market update)
🟢What is The Next Opportunity on AUDCAD Market
🟢how to Enter to the Valid Entry With Assurance Profit
This CHART is For Trader's that Want to Improve Their Technical Analysis Skills and Their Trading By Understanding How To Analyze The Market Using Multiple Timeframes and Understanding The Bigger Picture on the Charts

AUDCAD - Long active ✅Hello traders!
‼️ This is my perspective on AUDCAD.
Technical analysis: Here we are in a bullish market structure from 4H timeframe perspective, so I am looking for longs. I expect bullish price action from here as price filled the imbalance and rejected from bullish order block + institutional big figure 0.89000.
Like, comment and subscribe to be in touch with my content!

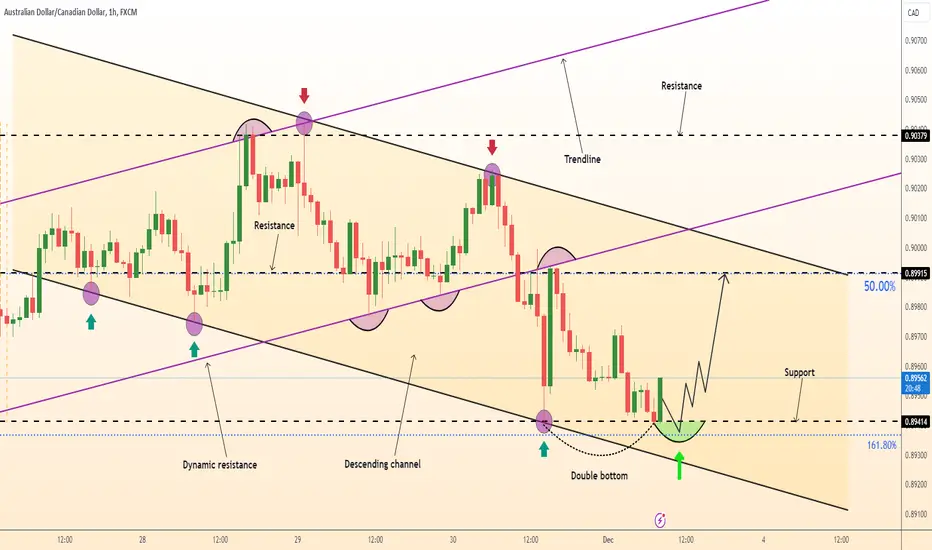
DeGRAM | AUDCAD at the structure support levelAUDCAD rejected the support level of 0.89500 and the fibo extension level.
The market created a double at the support level.
Price bounced off the major daily support level, and the trend is bullish.
We expect a bullish move and a retest of the resistance.
-------------------
Share your opinion in the comments and support the idea with a like. Thanks for your support!
#AUDCAD|| 600+ Buying Setup||Dear Traders,
XAU and AUD are positively correlated which means when price of GOLD goes up AUD goes up too. Hence, AUDCAD dropped heavily in recent time and therefore price is at the 'discounted level' where big buys are expected within the next week. It is crucial to enter with good risk management. Next week is likely to be volatile.
Good Luck and Like and Follow!!
