AUDCAD LongDaily
-trend: uptrend
-price broke and closed above resistance
-price retraced back to retest new support
4h
-price is retesting support
-price closed with multiple bullish pin bars at support
signal = Buy
Audcadbuy

AUDCAD, daily timeframe, bullish divergence materialized (2)Hello my friends,
I am updating my previos post about this pair.
I took buy position since 0.9500 as i spotted bullish divergence exactly at support and now this trade is going my way floating +90 pips.
Noted this pair also moving above the kumo cloud so it got bullish energy in it, hence taking long position is more favorable.
Partial profits taken here and stop loss has been moved to entry.
For those who followed previous post, please do the same for a safer trade.
I am holding half positon for TP2 at 0.9680
Good luck

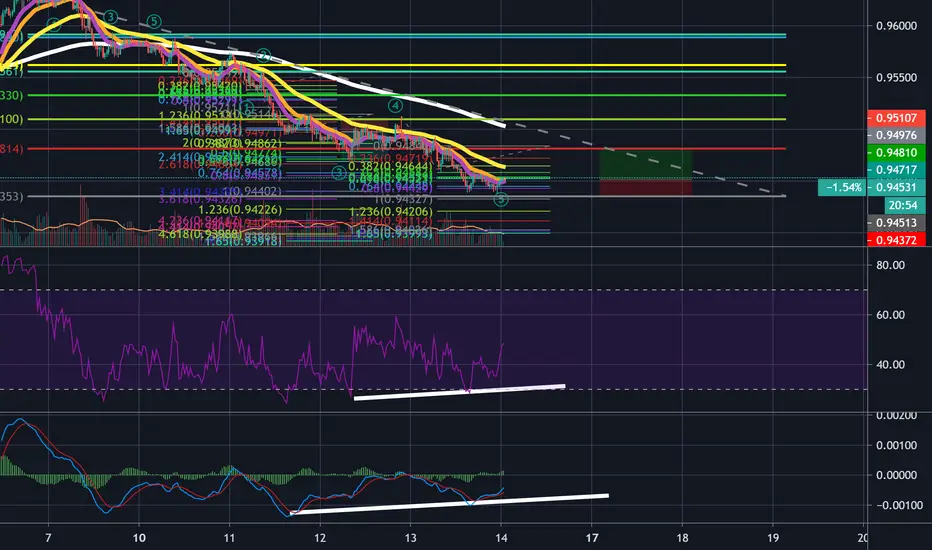
Aud Cad short term bullish opportunityGood evening everyone, I hope you've all been doing well. As per the usual, I am going to keep this short and sweet. I strongly believe that we are headed up in aud/cad to atleast the 0.94810.
Elliottwave analysis: If you saw my last post, which I highly recommend, you probably caught the wave a of the wave 5 and have come out with a great profit. This means that it is now time to catch the retracement. Typically I would expect a 0.382 retracement, but I am more than happy taking the conservative target on this one, which is the 0.236 retracement. I think we have finished the wave 5, since we have hit a 1:1 extension of the wave a of the wave 5, which is a strong indicator that this movement is over. Ideally, I think that we could target the bottom of the wave 4, since this is typically where the wave a ends after an impulse wave.
Moving average analysis: The only thing that the moving average tells me, is that the target I have is the same as the 1 hour 55 ema, but I didn't take the EMA into too much consideration for this trade, since it wasn't giving me many strong singles.
RSI analysis: The rsi analysis is the money maker. As we can see on the 1 hour, we have some strong bullish divergence, which IS WHAT I LIKE TO SEEEEEE. The best part is that this divergence is visible on many different time frames, for example, the 30, the one hour, and a little bit on the 2 hour.
MACD analysis: This is indicator is also giving me really bullish signs. Firstly, we can see that there is some huge bullish divergence on the macd for the 1 hour and the 30 minute. We have seen another cross and I believe that we are headed to the upside.
All in all, this is the trade setup I am following:
Target 1: 0.236 retracement- 0.94810
Target 2: 0.95086
Stop loss: 0.94372
I wish you all the best when trading tomorrow. Stick to your stop losses and have a great time.

AUDCAD - SWING - 27. JULY. 2020Welcome to our weekly trade setup ( AUDCAD )!
-
1 HOUR
Bearish reaction after forming new highs.
4 HOUR
Good long entries after pullback.
DAILY
Overall bullish market after a pullback, expecting another push to the upside.
-
FOREX SWING
BUY AUDCAD
ENTRY LEVEL @ 0.95410
SL @ 0.94860
TP @ 0.96210
Max Risk. 0.5% - 1%!
(Remember to add a few pips to all levels - different Brokers!)
Leave us a comment or like to keep our content for free and alive.
Have a great week everyone!
ALAN

AUDCAD and Buy Area (23/7/2020)Please fill the lines..!
Note!
Cancel/pending plan few minutes before news! (Medium/high impact news)
Decide your target, manage your risk..!
Turn off your PC..! Let your choice running..!
Disclaimer
The content on this analysis is subject to change at any time without notice, and is not provided for assisting traders to make decision.


AUDCAD - SWING - 22. JUNE. 2020Welcome to our weekly trade setup ( AUDCAD )!
-
1 HOUR
Very bullish price action.
4 HOUR
Prices closed above main sr level and are trading above it.
DAILY
Expecting some pressure shortly and a lift off.
-
FOREX SWING
BUY AUDCAD
ENTRY LEVEL @ 0.93310
SL @ 0.92790
TP @ 0.94090
Max Risk. 0.5% - 1%!
(Remember to add a few pips to all levels - different Brokers!)
Leave us a comment or like to keep our content for free and alive.
Have a great week everyone!
ALAN

AUDCAD - SWING - 15. JUNE. 2020Welcome to our weekly trade setup ( AUDCAD )!
-
1 HOUR
Bullish price action this week.
4 HOUR
Close above main sr level, expecting a rise in price action shortly.
DAILY
Overall good long entries, nice pa!
-
FOREX SWING
BUY AUDCAD
ENTRY LEVEL @ 0.93360
SL @ 0.92930
TP @ 0.93950
Max Risk. 0.5% - 1%!
(Remember to add a few pips to all levels - different Brokers!)
Leave us a comment or like to keep our content for free and alive.
Have a great week everyone!
ALAN

STRONG BUY for AUD/CADGreat and Strong support, MACD and Signal lines touched each other, Enter the trade right now!

Strong Buy For AUD/CADAUD/CAD is now on a strong support, MACD and Signal lines touched each other, So AUD/CAD will rise / 30M Time Frame / MACD, MA, SUPPORT


AUDCAD Long! Price-Action Narrative on DailyNote: Idea is to complement your research.
Idea also complements previously shared idea/s.
Check comments section for future updates on idea.
Like this idea?
Like, Share, Follow, (...)
Thank you and Happy Trading.


AUDCAD: Alternate angle on Daily, Long!
Note: Idea is to complement your research.
Check comments section for future updates on idea.
Like this idea? Like, Share, Follow (...)
Thank you and Happy trading.

AUDCAD: Daily; Price trading above Multiple Buy-Zones, Long!
Note: Idea is to complement your research.
Check comments section for future updates on idea.
Like this idea? Like, Share, Follow (...)
Thank you and Happy trading.

AUDCAD - SWING - 18. MAY. 2020Welcome to our weekly trade setup ( AUDCAD )!
-
1 HOUR
Market dropped towards range low.
4 HOUR
Pullback from previous support and close above sr level.
DAILY
Overall bullish market slowing down and in pullback, good long entries!
-
FOREX SWING
BUY AUDCAD
ENTRY LEVEL @ 0.90700
SL @ 0.90300
TP @ 0.91290
Max Risk. 0.5% - 1%!
(Remember to add a few pips to all levels - different Brokers!)
Leave us a comment or like to keep our content for free and alive.
Have a great week everyone!
ALAN

AUDCAD reversed from resistance, potential drop!
AUDCAD reversed off its resistance at 0.91335 where it could potentially drop further to 0.84853.
Trading CFDs on margin carries high risk.
Losses can exceed the initial investment so please ensure you fully
understand the risks.


AUD/CAD, only if price will break the Level I would enter BuyThe Aussie dollar looks strong. If the price breaks the level, we would be looking for a nice long trade to the upside.

audcad is a BUYAbove SMAs, which are about to cros over, above bullish trendline on daily, 4hr and 1hr.
Price action confirms not inhbitors to upward push.

AUSTRALIAN DOLLAR / CANADIAN DOLLAR (AUDCAD)Dates in the future with the greatest probability for a price high or price low.
The Djinn Predictive Indicators are simple mathematical equations. Once an equation is given to Siri the algorithm provides the future price swing date. Djinn Indicators work on all charts, for any asset category and in all time frames. Occasionally a Djinn Predictive Indicator will miss its prediction date by one candlestick. If multiple Djinn prediction dates are missed and are plowed through by same color Henikin Ashi candles the asset is being "reset". The "reset" is complete when Henikin Ashi candles are back in sync with Djinn price high or low prediction dates.
One way the Djinn Indicator is used to enter and exit trades:
For best results trade in the direction of the trend.
The Linear Regression channel is used to determine trend direction. The Linear Regression is set at 2 -2 30.
When a green Henikin Ashi candle intersects with the linear regression upper deviation line (green line) and both indicators intersect with a Djinn prediction date a sell is triggered.
When a red Henikin Ashi candle intersects with the linear regression lower deviation line (red line) and both indicators intersect with a Djinn prediction date a buy is triggered.
This trading strategy works on daily, weekly and Monthly Djinn Predictive charts.
Trades made when the monthly, weekly and daily arrows are pointing in the same direction are the most profitable.
This is not trading advice. Trade at your own risk.
