AUDCAD possible short for 0.8920market making lower high and then fall mean each high did not breach previous high. 15th August formed inside bar range confined within the previous bar range. supply zone for short 0.9055-80. stop loss above inside bar high i.e 0.9115. target: 0.8920
Audcadforecast

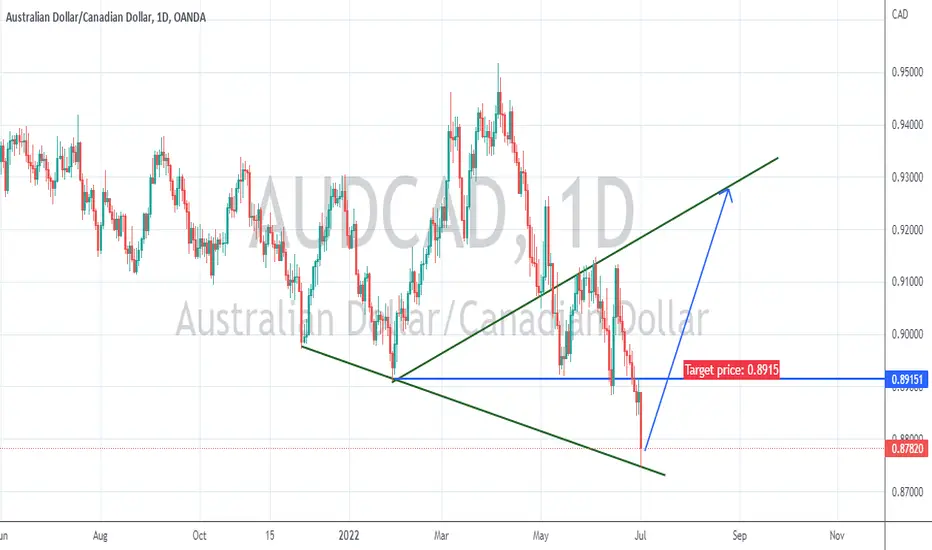
AUDCAD Long Setup with 1:2 R:R RatioIt can be a QM pattern so you have 2 entry point, take profit area in the strongest 1D resistance.

DeGRAM | AUDCAD target for shortAUDCAD is approaching the psychological level at 0.9000.
We are considering selling if price action rejects the resistance zone.
-------------------
Share your opinion in the comments and support the idea with like. Thanks for your support!

DeGRAM | AUDCAD divergenceAUDCAD is forming a compression channel at the resistance zone.
Price action tested the resistance multiple times.
We expect a pullback to the support levels.
-------------------
Share your opinion in the comments and support the idea with like. Thanks for your support!

DeGRAM | AUDCAD false break at the resistanceAUDCAD made a false break of the resistance level at 0.8950.
Since the market is in a bearish trend on the daily timeframe, we look for selling opportunities.
Price action is going to either consolidate or retest the support level.
-------------------
Share your opinion in the comments and support the idea with like. Thanks for your support!

DeGRAM | AUDCAD resistanceAUDCAD made a lower low, as we predicted in the previous session.
On the daily timeframe, price action rejected a resistance zone at 0.89000.
We expect the price to retest the support levels.
-------------------
Share your opinion in the comments and support the idea with like. Thanks for your support!

AUDCAD possible long for 0.9050#audcad, 4th July daily bar is inside bar range confined within the previous bar range. 5th July coiled bar broker inside bar high closed on the high. both bars are dictating strength ahead. 0.9030, 0.9055 and 0.9090 are resistance levels ahead. my view long for target 0.9050.

DeGRAM | AUDCAD false break againAUDCAD could not go higher.
A major resistance zone at 0.889000 holds the price.
We can see multiple rejections, which means bears are still in control.
-------------------
Share your opinion in the comments and support the idea with like. Thanks for your support!

DeGRAM | AUDCAD false breakAUDCAD recently made higher lows, meaning bears are running out of steam.
Price action has entered into consolidation until it breaks and closes above 0.8900.
A perfect signal to sell would be a false break with divergence.
-------------------
Share your opinion in the comments and support the idea with like. Thanks for your support!

DeGRAM | AUDCAD selling pullback AUDCAD is like other AUD pairs in a bearish trend.
Price action is retracing back to the resistance level.
-------------------
Share your opinion in the comments and support the idea with like. Thanks for your support!

AUDCAD seems BullishAUDCAD took support on it's trendline on D1 chart which is lower low. I believe it will go upside from the current market price.
Audcad bull from SupportHi everyone in the TradingView community. I am Rana Sarmad I like to share and talk about trading strategies. If you are a member of my subscribers list and like my ideas, please don't hesitate to let me know by hitting that Like button and growing my notification count!
We are going to discuss about FX:AUDCAD
We can see a market tested its resistence area in H4 & H1 and now trying to test its support in bigger timeframe.
So we are expecting a little strength near its Support or lower trendline. after this test we will take a Long entry near trendline.
This is my opinion, I really hope this will be useful for you.
This is not a financial advice. Always take trade at your own risk,
Be ready and take care your money. Have a great profit !
Risk Warning:
Trading Forex and Leveraged Financial Instruments involves significant risk and can result in the loss of your invested capital. You should not invest more than you can afford to lose and should ensure that you fully understand the risks involved. Trading leveraged products may not be suitable for all investors. Trading non-leveraged products such as stocks also involves risk as the value of a stock can fall as well as rise, which could mean getting back less than you originally put in. Past performance is no guarantee of future results. Before trading, please take into consideration your level of experience, investment objectives and seek independent financial advice if necessary. It is the responsibility of the Client to ascertain whether he/she is permitted to use the services of the EMOTT brand based on the legal requirements in his/her country of residence........


DeGRAM | AUDCAD break the descending channelAUDCAD made a sharp move up. There is no clear trend.
We expect some consolidation.
-------------------
Share your opinion in the comments and support the idea with like. Thanks for your support!


DeGRAM | AUDCAD selling a pullback AUDCAD made lower lows as predicted yesterday.
Price action pulled back to the resistance/swing zone.
This is a breakout pullback continuation pattern.
-------------------
Share your opinion in the comments and support the idea with like. Thanks for your support!

AUDCAD $AUDCAD Initial ShortAUDCAD $AUDCAD Initial Short. TP and SL on chart. Move SL on TP. After TP2, trail with 0.5ATR step and 1.5ATR offset.

DeGRAM | AUDCAD lower lowsAUDCAD is making lower lows. It bounced off the resistance level.
This is a simple trend continuation trade.
-------------------
Share your opinion in the comments and support the idea with like. Thanks for your support!

AUDCAD $AUDCAD Initial ShortAUDCAD $AUDCAD Initial Short. TP and SL on chart. Move SL on TP. After TP2, trail with 0.5ATR step and 1.5ATR offset.

DeGRAM | AUDCAD sell pullback AUDCAD is in a bearish trend.
This is going to be a simple breakout - pullback - continuation trade.
-------------------
Share your opinion in the comments and support the idea with like. Thanks for your support!

AUDCAD Buy & Sel Long#AUDCAD 4H SET UP
Bullish then Bearish
Sell Long
Buy Long
Buy Now
Sell limit 0.94750

AUDCAD- Analysis Hello traders,
Hope you are having an amazing day and looking towards a profitable week ahead.
AUDCAD analysis shared with the ETGL group is playing out perfectly, anticipating further push to the downside before we make another rally to the highs.
Although we're approaching the end of the month, the market is likely to be more volatile than other days. However, the bias remains intact.
Looking forward to see how this trade plays out.
Good luck & happy trading.
ETGL TEAM 💛

AUDCAD hrly long | Algo tradingAUDCAD hrly long
buystop @ .91167
TP #1 @ .91379 82% wr
TP #2 @ .91635 56% wr
SL @ swing low .90425 12% wr
WR and HR Determined from past trades on this pair, on this timeframe.
More trades like this on my profile and on Bifrost trades
