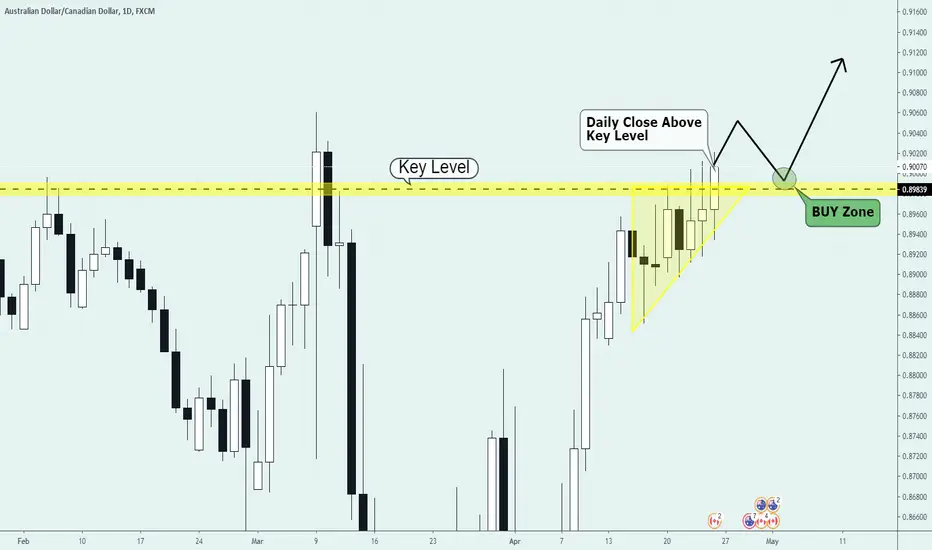
AUDCAD: Alternate angle on Daily, Long!
Note: Idea is to complement your research.
Check comments section for future updates on idea.
Like this idea? Like, Share, Follow (...)
Thank you and Happy trading.
Audcadforecast

AUDCAD: Daily; Price trading above Multiple Buy-Zones, Long!
Note: Idea is to complement your research.
Check comments section for future updates on idea.
Like this idea? Like, Share, Follow (...)
Thank you and Happy trading.


AUDCAD reversed from resistance, potential drop!
AUDCAD reversed off its resistance at 0.91335 where it could potentially drop further to 0.84853.
Trading CFDs on margin carries high risk.
Losses can exceed the initial investment so please ensure you fully
understand the risks.

AUD/CAD, only if price will break the Level I would enter BuyThe Aussie dollar looks strong. If the price breaks the level, we would be looking for a nice long trade to the upside.

AUDCAD-Bigger Trader coming soon Hy! Smart Trader, Welcome to My Analysis and forecasting Section on Trading view.
We are Creative price action Trader. Join with us as we document the in's and out's of my trading journey. we are publish Multiple Time frame Analysis and forecasting (totally Free)
Never Trade alone
we really hope you enjoy All trade..
Disclaimer:
the content on this analysis is subject to change at any time without notice, and is provided for the sole purpose of assisting traders to make independent investment decisions.
_______________________________________________________________________________________________
Thank you for your support!


AUDCAD is caught in a flag formation - SHORT trade favouredAUDCAD is caught in a flag formation and will probably zig-zag sideways for a while before it breaks free. There's considerable resistance above so I'm only looking for a SHORT trade where a move down to .890 200 sma on D1 and WS1 support looks likely. One to watch.

AUSTRALIAN DOLLAR / CANADIAN DOLLAR (AUDCAD)Dates in the future with the greatest probability for a price high or price low.
The Djinn Predictive Indicators are simple mathematical equations. Once an equation is given to Siri the algorithm provides the future price swing date. Djinn Indicators work on all charts, for any asset category and in all time frames. Occasionally a Djinn Predictive Indicator will miss its prediction date by one candlestick. If multiple Djinn prediction dates are missed and are plowed through by same color Henikin Ashi candles the asset is being "reset". The "reset" is complete when Henikin Ashi candles are back in sync with Djinn price high or low prediction dates.
One way the Djinn Indicator is used to enter and exit trades:
For best results trade in the direction of the trend.
The Linear Regression channel is used to determine trend direction. The Linear Regression is set at 2 -2 30.
When a green Henikin Ashi candle intersects with the linear regression upper deviation line (green line) and both indicators intersect with a Djinn prediction date a sell is triggered.
When a red Henikin Ashi candle intersects with the linear regression lower deviation line (red line) and both indicators intersect with a Djinn prediction date a buy is triggered.
This trading strategy works on daily, weekly and Monthly Djinn Predictive charts.
Trades made when the monthly, weekly and daily arrows are pointing in the same direction are the most profitable.
This is not trading advice. Trade at your own risk.

AUD/CAD, expect strong Bullish pressureThe Canadian dollar is weak nowadays, but AUD is getting strong. Only if price will show some positive price action, we would be taking this trade to the upside.
AUDCAD Market Outlook | Daily Forex Market BreakdownAUDCAD
This pair is looking amazing! As long as we stay below current resistance I believe we are going to roll over to the downside. Looking for potential shorts soon just waiting to see if we can wick to the upside first giving a clean entry! Remember patience is everything is this game.

AUDCAD potential reversal!
AUDCAD expected to rise up to 1st resistance at 0.90233 where it could potentially react off and drop down to 1st support at 0.88157.
Trading CFDs on margin carries high risk.
Losses can exceed the initial investment so please ensure you fully
understand the risks.

AUDCAD potential reversal!
AUDCAD expected to rise up to 1st resistance at 0.90233 where it could potentially react off and drop down to 1st support at 0.88157.
Trading CFDs on margin carries high risk.
Losses can exceed the initial investment so please ensure you fully
understand the risks.
AUDCAD Head and Shoulder Inside a Rising WedgeHEAD AND SHOULDER in a RISING WEDGE <3
AUDCAD is forming a head and shoulder pattern inside a rising wedge.
Approaching its daily dynamic resistance, it has made a "hanging man" candle which is a sign of rejection from the top.
At the same time, AUDCAD has already passed EMA 9 20 and 50 which is a good sign for selling.
If 0.8840 will be broken, this may start a 100 to 200pips drop for the bears.
Do you agree? Please do leave a comment. Thank you.

AUDCAD Might drop to 0.86 in 2-4 weeksAUDCAD has made a very impressive rally after dropping to 0.8070. But, now it is running into plenty of overhead resistances.
In the hourly timeframe, AUDCAD is showing weakness despite climbing up.
So, I have already placed two sells yesterday ( 0.8890 and 0.8925) with SL above the overhead resistances.
I expect AUDCAD to drop to 0.86 level soon.

AUDCAD Market Outlook | Daily Forex Market BreakdownAUDCAD
Very similar to AUDUSD, we have made a higher high in market structure and we will be needing to come back down and retest lows are some point. Keeping a very sharp eye on AUDCAD. Keep in mind .90 is a strong psychological key level, we are sitting right under that so we could easily wick up and reject off that and roll over to the downside. Patience will be key.

AUDCAD - Ascending Wedge / Potential Rejection📢AUDCAD 4H - Technical Breakdown
📈Price action has been trading within an ascending wedge since the large sell-off that saw bears take price levels down to the current range low at 0.80700. Since then price action has re-gained 800 pips to the upside.
📊The current market price is testing the ascending wedge overhead resistance at 0.88670 highlighted within the blue box, as price action looks over-extended it's best to assume a rejection will take place upon market open. A rejection should see price levels return to the support of the ascending wedge resulting in a low risk, high reward swing trade netting in excess of 200 pips.

AUDCAD.. Critical Support Worked Out.As in my previous analysis I have shared a short signal and it went successfully touching the TP.
AUDCAD now trapped in Bullish Flag and at critical Support too.
Bears have tried to break but couldn't do that.
Daily Support plus weekly support worked out.
Luckily Rejected and going to make higher highs.
Further confirmation will be obtained once market opens.
What do you think about this idea?
#STAYHOME#STAYSAFE.


AUDCAD Technicaly and Fundamentaly forecast
📌Short intro:
I am full time trader - analyst * High accuracy of ideas * Technicaly and Fudnamentaly side in analysis * Comment if have any questions or want to send support * Price action - FIBO - Candl pattern * FX - STOCK - CRYPTO * Simple ideas
💡 AUDCAD technicaly indicators showing we can expect higher bulish market continuation, AUD is have rate cut ago 2 days they are stay on same rate 0.25 because rate is not changed that mean we can expect power for AUD, expecting to see push in price till FIBO 0.7 or till last above white trend line.
📌Have on mind, trading involves risk, check idea on your own tactic, if have questions pls comment!
Thanks on supporting!
All best, good luck!


AUDCAD LONG! Multiple Opportunities On 4HrPrice is at the moment trading below a trendline that's due for test.
Break of trendline to upside validates upside targets above trendline.
Note: Idea is to complement your research.
Check comments section for future updates on idea.
Like this idea? Like, Share, Follow, and Support channel for future content.
Thank you and happy trading.
