AUD/CAD Giving Great Bullish Signals, Long Setup After RetestThis Is An Educational + Analytic Content That Will Teach Why And How To Enter A Trade
Make Sure You Watch The Price Action Closely In Each Analysis As This Is A Very Important Part Of Our Method
Disclaimer : This Analysis Can Change At Anytime Without Notice And It Is Only For The Purpose Of Assisting Traders To Make Independent Investments Decisions.
Audcadlong

AUD/CAD :: Very important range !!!AUD/CAD :::
Various supports and resistances are located in this range. Waiting can be the best decision until the decision to take a position is made after the change.

AUDCAD Long setup 1. Weekly/Daily - Uptrend
2. 4H - price broke above the key zone then retested
3. Entry pattern - 30M Engulfing
Targets ; 0.93730 and 94738

AUDCAD Idea H1Here is my view for AUDCAD on H1. The price could go bullish, you can put a pending order on the Order block or find an entry on LTF within OB Zone. Trade Safe!

AUDCAD: a SHORT TERM BUYHello, everybody and welcome to BIGPAPA Forex, today we are going to be analyzing the AUDCAD pair, translating the market information by using a full technical analysis on different time frames, giving you a personal opinion about the next most likely market movement and helping you to spot and manage market opportunities

AUD/CAD :: Movement in the upper part of the middle line .AUD/CAD :::
The price has been moving in the lower part of the channel for some time and the middle line has been the resistance of this movement
And now the resistance has been broken, we can expect the price to move above the middle line for a while ,
And it will definitely have downward corrective movements .

AUDCAD - Target 1 hit ready for target 2 0.9862First target hit at 0.9260 recently.
What's great is there is a new Cup and Handle formed.
We also see strong upside with bullish divergence RSI and RSI>50 - Green.
Target 2 - 0.9862

AUDCAD Idea H1Here is my view for AUDCAD on H1. The price could go up, you can put a pending order on the Order block or find an entry on LTF within OB Zone. Trade Safe!

AUDCAD - long trade opportunityHi everyone :) Higher time frames suggest bullishness in the market, as the weekly price movement is above the most important moving averages of 20/50/200. The trade has the potential to move around 40 pips before it has to face the daily resistance zone. On the 4-hour, we are currently attempting to form a bullish engulfing candlestick, which indicates that the buyers are slowly stepping into the market by attempting to push it up.

We have AUDCAD H1 Forecast.With this analysis, you will be able to find your most profitable trade. EnclaveFX does not recommend that you buy or sell this assist. We do not take any responsibility for your profits & losses. EnclaveFX believes in enhancing the knowledge of our clients & followers.

AUDCAD LongDear friends,
Here comes another analysis for the future trade. Right now, the price is taking the trendline support to make a move upward. But the trendline has been tested multiple times. From my point of view, it looks like it will break. After breaking in the downward direction, price will test the range from 0.90270 to 0.89550 (Aggressive entry) if it is a normal selling pressure. If selling pressure is high, then the price will again make a move of another 0.00500pts in the downward direction to test the price at 0.89100 (Conservative entry).
A good force of touch to this point it will make a move to go upside. But the only problem is the trend will be in the downside and the Algo traders will enter against the bulls to force the rally. Tests patience. Makes us sell. Then finally stocks go up.
But it is wise to follow your risk management before taking entry.
I love to share my ideas. Feel free to revise the text and provide feedback. It makes it so personal and improve us in better ways.
Thanks & Regards,
Alpha Trading Station
Disclaimer: This view is for educational purpose only & any stock mentioned here should not be taken as a trading/investing advice. We may or may not have position in the stocks mentioned here. Please consult your financial advisor before investing. Because Price is the "King of Market".
OANDA:AUDCAD

AUD/CAD :: Short position for lower time frame and ...AUD/CAD :::
The resistances have performed their role well and now it is the turn of the supports .
Currently, the movement is downwards and the best positions have been determined for the short position .
In case of a change in the course of the route ::
The chart is reviewed again .
<<< Good luck >>>

AUDCAD | Descending Channel Breakout & Retest Confirmed..!!
#AUDCAD Descending Channel Upside Breakout & Retest has Confirmed in the 3-Days Timeframe Chart.
Looks Pretty Bullish for Midterm Hold, Expecting +1000 PIPs Bullish Impulse in the Midterm. 📈
Please like the idea for Support & Subscribe for More ideas like this and share your ideas and charts in Comments Section..!!
Thanks for Your Love & Support..!!

audcad still running to downsidedownside demand area still very strong to breakdown to down side that is why my order for buy for long abd sl will after 1tp on profit side

AUDCAD, best place for another short.HTF Bearish
LTF Short term bullish.
Price currently in bearish continuation.
Strong reversal impulse broke all previous lows.
More downside to continue after retest of 0.926 level.
Trade Safe
Thanks


AUDCAD LONGPrice is consolidating in an expanding triangle from 1987 to till date after a clear bearish impulse from 1970s to 1987 which fundamentally 1980s ended in failure, a monetary policy failure – a deep recession provoked by interest rates of 18 per cent resulting in unemployment above 11 per cent. Then Corrected (A) to (B) with triple combo (Elliot Wave Correction) for 20 years and running for (C) wave since then beside Australia has seen average annual economic growth of 3.3 per cent over the period from 1992 to 2017. We are expecting and diagnosing wave (C) as shown in the graph. Have a better luck!!! If you like the idea hit support button. Thanks

AUD/CAD LONG TRADE ...According to SMC , We have a two trades entry for long on AUD/CAD pair as following :
TRADE 1:
ENTRY @ ACTIVATE NOW
SL @ 0.91686
TP @ 0.92676
RRR : 1:4.05
TRADE 2:
ENTRY @ 0.91473
SL @ 0.91249
TP @ 0.92555
RRR : 1:4.83
IF 1ST TRADDE IS ACTIVATED AND HIT TP , DON'T ENTER THE 2ND TRADE ...
GOOD LUCK GUYS ...

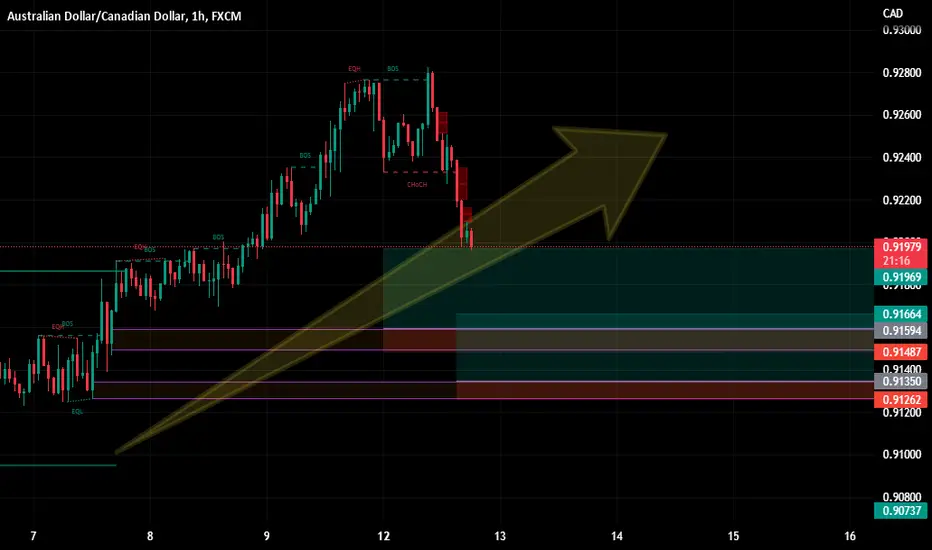
AUD/CAD LONG TRADE ...According to SMC , We have a two trades entry for long on AUD/CAD pair as following :
TRADE 1:
ENTRY @ 0.91594
SL @ 0.91487
TP @ 0.91969
RRR : 1:3.5
TRADE 2:
ENTRY @ 0.91350
SL @ 0.91262
TP @ 0.91664
RRR : 1:3.57
IF 1ST TRADDE IS ACTIVATED AND HIT TP , DON'T ENTER THE 2ND TRADE ...
GOOD LUCK GUYS ...
AUDCAD Idea H1Here is my view for AUDCAD on H1. The price could go up, you can put a pending order on the Order block or find an entry on LTF within OB Zone. Trade Safe!

LONG ON AUD/CADPrice has broken above a major resistance zone and has held above the zone as new support.
We have a bullish engulfing candle with momentum.
Here is the Play I will be taking on this pair:
Entry = 0.91698
Stop Loss = 0.90899
Take Profit = 0.94344

AUDCAD - Long from bullish orderblock ✅Hello traders!
‼️ This is my analysis on AUDCAD.
Here we are bullish from H4 timeframe perspective, so I am looking for longs. I expect price to make a retracement to fill the imbalances lower and then to reject from bullish orderblock.
Like, comment and subscribe to be in touch with my content!

20 REASONS FOR LONG AUDCAD MULTI-TIME FRAME TOP-DOWN ANALYSIS OVERVIEW🤑
🧐Eagle eye: Over All Price movement are bear till last 10 years. Almost every year, prices create a new low
Monthly: clear downtrend two higher low and lower low current candle is corrective mood and taped recent FVG area
Weekly: also a clear downtrend on weekly tf till it breaches the last high of about 0.9100 area, so we expect retracement till this area's previous high
SUMMARY extreme bear in Big pic resistance level is 0,9100. The price can reach 0.9100
1 Structure analysis time frame: D1 up trend
2 target time frame: D1
3 Current Move: impulse
4 Entry Time Frame: h4
4.1 Entry TF Structure: bullish
4.2 entry move: current move is impulse. A correction is expected if the price is unable to break the 0.9035 area only 10 pip ahead
5 Support resistance base: support area is 0.8925, resistance area 0.9035. Decide based on these areas but remember, if the price break the resistance level, take a buy entry, or if the price is rejected on the resistance level, then wait for the support area for another buying opportunity only till the support area is intact
6 FIB: Almost done trigger event
7-candle Pattern: shrinking Pattern
8 Chart Pattern: double top
9 Volume: reversal volume is the significant volume at 1st leg and low at 2nd leg
10 Momentum UNCONVENTIONAL Rsi: super bullish zone above 60
11 Volatility measure Bollinger bands: m pattern with volume support volatility divergence
12-strength ADX: uptrend is in strength
13 Sentiment ROC: AUD is weaker than CAD
14 final comments: for now, according to h4, we are with bulls expected the last move, then reversal, as we mentioned, is eagle eye view
15: decision: buy now, and 2nd entry buy at retracement
16 Entry: 0.8927
17 Stop losel: 0.8915
18 Take profit: 0.9090
19 Risk to reward Ratio:1:9
20 Excepted Duration:5 days
