AUD/CADBuy: AUD / CAD
SL @ 0.90990
TP @ 0.92220
Max Risk: 2%
(When calculating, do not forget about different spreads from Brokers)
Leave comments or likes to keep our content free and alive.
Have a good week to everyone
It is not an investment recommendation
Audcadlong

Long opportunity on AUDCAD for this week??Share your idea in the comment section about this pair and let's debate
Happy New Year, Michel_FRX
DISCLAIMER:
1. Be aware this is not financial advice so trade carefully and have stop loss for sure
2. Past performance is not indicative of future results.

💡Don't miss the great buy opportunity in AUDCADTrading suggestion:
". There is a possibility of temporary retracement to the suggested support line (0.9204).
. if so, traders can set orders based on Price Action and expect to reach short-term targets."
Technical analysis:
. AUDCAD is in an uptrend, and the continuation of the uptrend is expected.
. The price is above the 21-Day WEMA, which acts as a dynamic support.
. The RSI is at 70.
Take Profits:
TP1= @ 0.9248
TP2= @ 0.9273
TP3= @ 0.9301
TP4= @ 0.9331
TP5= @ 0.9351
SL= Break below S2
❤️ If you find this helpful and want more FREE forecasts in TradingView
. . . . . Please show your support back,
. . . . . . . . Hit the 👍 LIKE button,
. . . . . . . . . . Drop some feedback below in the comment!
❤️ Your support is very much 🙏 appreciated!❤️
💎 Want us to help you become a better Forex / Crypto trader?
Now, It's your turn!
Be sure to leave a comment; let us know how you see this opportunity and forecast.
Trade well, ❤️
ForecastCity English Support Team ❤️

💡Don't miss the great buy opportunity in AUDCADTrading suggestion:
". There is a possibility of temporary retracement to the suggested support line (0.9204).
. if so, traders can set orders based on Price Action and expect to reach short-term targets."
Technical analysis:
. AUDCAD is in an uptrend, and the continuation of the uptrend is expected.
. The price is above the 21-Day WEMA, which acts as a dynamic support.
. The RSI is at 69.
Take Profits:
TP1= @ 0.9248
TP2= @ 0.9273
TP3= @ 0.9301
TP4= @ 0.9331
TP5= @ 0.9351
SL= Break below S2
❤️ If you find this helpful and want more FREE forecasts in TradingView
. . . . . Please show your support back,
. . . . . . . . Hit the 👍 LIKE button,
. . . . . . . . . . Drop some feedback below in the comment!
❤️ Your support is very much 🙏 appreciated! ❤️
💎 Want us to help you become a better Forex / Crypto trader ?
Now, It's your turn !
Be sure to leave a comment; let us know how you see this opportunity and forecast.
Trade well, ❤️
ForecastCity English Support Team ❤️

AUDCAD Buy Setup4h
Trend: Up
Level: Support
-price broke and close above resistance
-waiting for price to retrace 60% fibo & support level
Signal: Buy

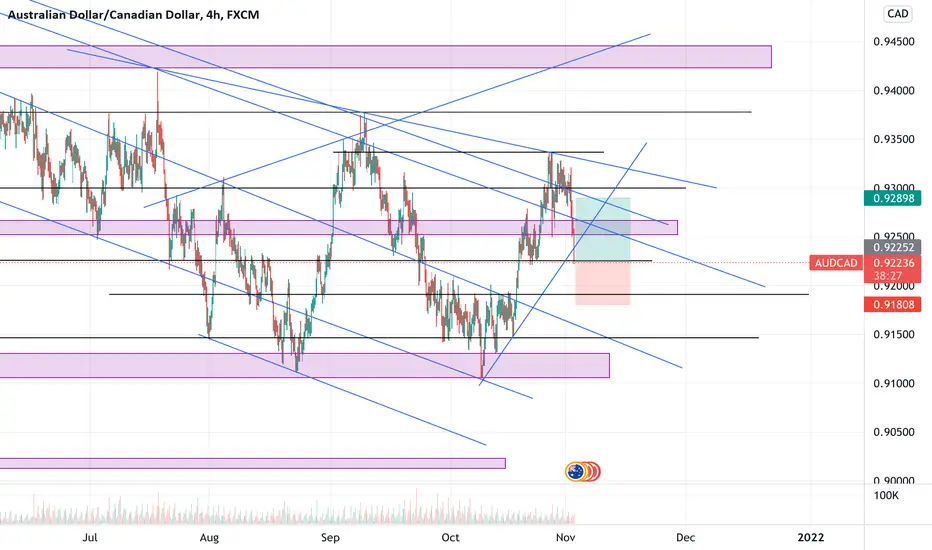
AUDCADThis pair looks BULLISH in a the Longer time frames (W, D) but it seems to be struggling to break structure that confirms the bullish bias. There is a likely short term SELL opportunity that is currently present. The other option is to wait for the market to continue accumulation, break out of structure and then find an entry on a retest. Goodluck!

AUDCAD Pair to watch next weekI think divergence is forming on
this pair and a possible correction
is an opportunity to buy for continuation
to the next structural test
currently price is at a medium term resistance
if that is broken then the head and shoulder pattern
will be completed
some news to watch out though for next weeek
so those can change the outlook OANDA:AUDCAD

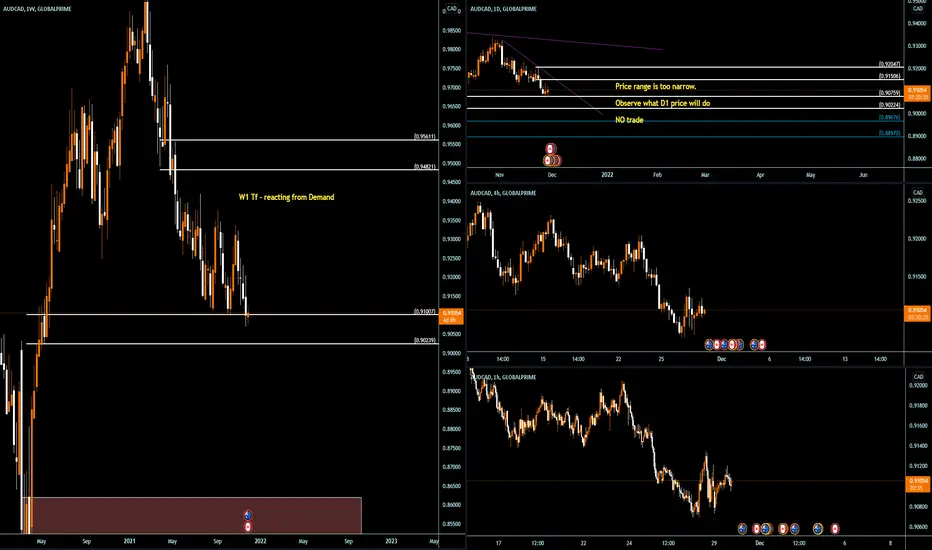
SUPPLY AND DEMAND - AUDCADW1 TF - reacting from Demand Zone
D1 Direction
Price range is too narrow. Need a strong breakout trend before setting any trades.
NO trade.
AUDCAD falling FASTFor more detailed expert analysis on a daily basis, make sure you click the follow button after reading.
Here we have our AUDCAD chart.
Today this asset has fallen down are we are looking for lower TF price action before we start to go long.
This is because price is falling hard and fast.
TGT is noted by the directional arrow.

AUDCADCanadian Australian.
The general trend is bearish, but the (hostile) speculator can open a buy deal in the opposite direction, as the price is currently at a support level (the side of the channel) and is targeting the resistance (the ceiling of the channel). , hope you all a brilliant week end , stay safe

AUD/CADBuy: AUD / CAD
SL @ 0.90000
TP @ 0.91000
Max Risk: 2%
(When calculating, do not forget about different spreads from Brokers)
Leave comments or likes to keep our content free and alive.
Have a good week to everyone
It is not an investment recommendation

AUDCAD LONGOANDA:AUDCAD
FX:AUDCAD
Entry and Target Level as per written in chart.
Please place trade at your own risk.
Cheers!

BIG BOUNCEReject the bottom line institutional trend, statistics from AUD 07:30 retails sales was really great so it gives positivity on the AUD also we can't forget to follow.

AUDCAD Bullish ideaAs per the linked chart you can see the cycles involved. Now at the end of a 3 waves impulse cycle we can expect to see ABC back to 50%. We have Divergence on Weekly, daily and 4 hour. Convergence has validated the bullish and as long as we stay above the invalidation zone then we should be bullish for the mid term.

AUDCAD LONG - Buy Entry - H4 ChartAUDCAD LONG - Buy Entry - H4 Chart
Symbol: AUDCAD
Timeframe: H4
Type: BUY
Entry Price: 0.91648 - Buy @ Market
Stop Loss: 0.91331
Take Profit: 0.92514
🔺 DISCLAIMER
🔺 For educational informational purposes only.
🔺 Analysis may change at any time without notice.
🔺 You must research and create your own trading plan.

AUD/CAD Bullish momentum..We are looking for buy entry from solid support level with first target at the elite spot on H4 time frame.

Tue 16th Nov 2021 Daily Forex Charts : 4x New Trade SetupsGood morning. I decided to a video as there were 4x new trade setups on the Forex Daily time frame from my watch list. You can hear me talk about my thoughts on each setup or you can read my notes on the charts. Enjoy your day all. Cheers.

AUDCAD | H1 |📈1) Heiken Ashi candle “closed” with no wick. 2) Gold line is above dotted line. 3) Green line is over red line | Stop-loss: Placed “just below” candle that just “closed” with no wick | Move stop-loss to “just below” each new Heiken Ashi candle that “closes” with no wick | Do not move stop-loss if Heiken Ashi candle(s) “closes” with a wick (of any size) | Close trade before market close Friday

💡Don't miss the great buy opportunity in AUDCADTrading suggestion:
". There is a possibility of temporary retracement to the suggested support line (0.9150).
. if so, traders can set orders based on Price Action and expect to reach short-term targets."
Technical analysis:
. AUDCAD is in a range bound, and the beginning of an uptrend is expected.
. The price is below the 21-Day WEMA, which acts as a dynamic resistance.
. The RSI is at 61.
Take Profits:
TP1= @ 0.9185
TP2= @ 0.9204
TP3= @ 0.9247
TP4= @ 0.9268
TP5= @ 0.9294
SL= Break below S2
❤️ If you find this helpful and want more FREE forecasts in TradingView
. . . . . Please show your support back,
. . . . . . . . Hit the 👍 LIKE button,
. . . . . . . . . . Drop some feedback below in the comment!
❤️ Your support is very much 🙏 appreciated!❤️
💎 Want us to help you become a better Forex / Crypto trader?
Now, It's your turn!
Be sure to leave a comment; let us know how you see this opportunity and forecast.
Trade well, ❤️
ForecastCity English Support Team ❤️

💡Don't miss the great buy opportunity in AUDCAD". There is a possibility of temporary retracement to the suggested support line (0.9150).
. if so, traders can set orders based on Price Action and expect to reach short-term targets."
Technical analysis:
. AUDCAD is in a range bound, and the beginning of an uptrend is expected.
. The price is below the 21-Day WEMA, which acts as a dynamic resistance.
. The RSI is at 63.
Take Profits:
TP1= @ 0.9185
TP2= @ 0.9204
TP3= @ 0.9247
TP4= @ 0.9268
TP5= @ 0.9294
SL= Break below S2
❤️ If you find this helpful and want more FREE forecasts in TradingView
. . . . . Please show your support back,
. . . . . . . . Hit the 👍 LIKE button,
. . . . . . . . . . Drop some feedback below in the comment!
❤️ Your support is very much 🙏 appreciated!❤️
💎 Want us to help you become a better Forex / Crypto trader?
Now, It's your turn!
Be sure to leave a comment; let us know how you see this opportunity and forecast.
Trade well, ❤️
ForecastCity English Support Team ❤️

AUD/CADBuy: AUD / CAD
SL @ 0.90990
TP @ 0.92890
Max Risk: 2%
(When calculating, do not forget about different spreads from Brokers)
Leave comments or likes to keep our content free and alive.
Have a good week to everyone

AUD/CADBuy: AUD / CAD
SL @ 0.91800
TP @ 0.92890
Max Risk: 2%
(When calculating, do not forget about different spreads from Brokers)
Leave comments or likes to keep our content free and alive.
Have a good week to everyone
AUD/CADBuy: AUD / CAD
Buy limit: 0.93070
SL @ 0.92550
TP @ 0.93950
Max Risk: 2%
(When calculating, do not forget about different spreads from Brokers)
Leave comments or likes to keep our content free and alive.
Have a good week to everyone
