AUD/CAD +200 Pips 0 Drawdown,New Entry Added To Who Missed FirstThis Is An Educational + Analytic Content That Will Teach Why And How To Enter A Trade
Make Sure You Watch The Price Action Closely In Each Analysis As This Is A Very Important Part Of Our Method
Disclaimer : This Analysis Can Change At Anytime Without Notice And It Is Only For The Purpose Of Assisting Traders To Make Independent Investments Decisions.
Audcadlong

AUDCAD Buy TF H4 TP = 0.8947On the 4-hour chart the trend started on June 30 (linear regression channel).
There is a high probability of profit. A possible take profit level is 0.8947
But do not forget about SL = 0.8740
Using a trailing stop is also a good idea!
Please leave your feedback, your opinion. I am very interested. Thank you!
Good luck!
Regards, WeBelieveInTrading

LONG - AUDCAD (D) (28 May 2023)Position Trade - AUDCAD
This is a pair that I would personally study to just observe and see how price will behave as there are no fresh Daily zones to buy from and that is not part of my trading plan.
In the Monthly Chart,
- Price is reaching Monthly Demand
But in the weekly and daily charts, there are no clean zones to buy from. Hence, best to stay away from.
Daily Chart
- a potential zone to buy from if traders want to take the risk as it hits the HTF demand

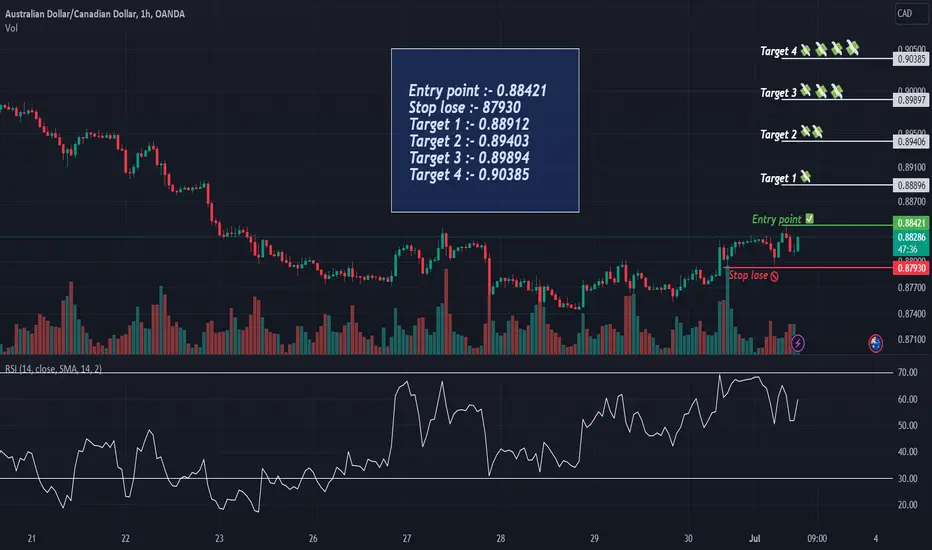
AUDCAD Bullish viewEntry point :- 0.88421
Stop lose :- 87930
Target 1 :- 0.88912
Target 2 :- 0.89403
Target 3 :- 0.89894
Target 4 :- 0.90385
AUDCAD BuyAUD is much stronger than CAD. I believe that AUDCAD pair will rise same as it was fall. Better to look buying opportunities on it.

AUDCAD LongOANDA:AUDCAD
RSI was in a long oversold and it has ended. The price has also reached a very important support level. The key points for the target are the 38%, 50%, 61.8% and 88% Fibonacci percentages. what's your opinion?

AUD/CAD Giving Good Bullish P.A , Can We Buy It Now ?This Is An Educational + Analytic Content That Will Teach Why And How To Enter A Trade
Make Sure You Watch The Price Action Closely In Each Analysis As This Is A Very Important Part Of Our Method
Disclaimer : This Analysis Can Change At Anytime Without Notice And It Is Only For The Purpose Of Assisting Traders To Make Independent Investments Decisions.

#AUDCAD - Long 1H☑️Broke the structure on the 1H timeframe
☑️Lots of liquidity on the left side
If we break down the red level on the 1H timeframe, the analysis becomes invalid🙅♂️
Good luck 🙌💪

AUDCAD at daily horizontal support... The RBA are likely to continue raising rates, more so than the BOC. The real fundamental bias is based on the economic data, though - Australia has released much more attractive economic figures than Canada. In fact, the AUD is a clear buy for me, if and when the price action agrees.
We could see price reverse from the current support at 0.8815. If not, the next key levels are 0.8750 and 0.8600...

Aud still strongClear setup approaching with a small risk. Trade the trend while others are want to predict a reversal.

AUD/CAD Bullish ideaHello Traders
Our technical view has been shown in the chart.
If you like it then Support us by Like, Following, and Sharing.
Thanks For Reading
Team Fortuna
-RC
(Disclaimer: Published ideas and other Contents on this page are for educational purposes and do not include a financial recommendation. Trading is Risky, so before any action do your research.)

AUDCAD Long Term Trading IdeaHello Traders
In This Chart AUDCAD HOURLY Forex Forecast By FOREX PLANET
today AUDCAD analysis 👆
🟢This Chart includes_ (AUDCAD market update)
🟢What is The Next Opportunity on AUDCAD Market
🟢how to Enter to the Valid Entry With Assurance Profit
This Video is For Trader's that Want to Improve Their Technical Analysis Skills and Their Trading By Understanding How To Analyze The Market Using Multiple Timeframes and Understanding The Bigger Picture on the Charts.

AUDCAD Breakout Long! AUD-CAD broke the
Resistance cluster of the
Falling and horizontal level of 0.896
And the breakout is confirmed
Because the 12H candle closed
Above the cluster so now
I am bullish biased
And I think that the pair
Will go higher up!

AUDJPY and AUDCAD Top-down analysis Hello traders, this is a complete multiple timeframe analysis of this pair. We see could find significant trading opportunities as per analysis upon price action confirmation we may take this trade. Smash the like button if you find value in this analysis and drop a comment if you have any questions or let me know which pair to cover in my next analysis.

AUDCAD - Short active ✅Hello traders!
‼️ This is my perspective on AUDCAD.
Technical analysis: Here we are in a bearish market structure from daily perspective, so I am looking for shorts. I expect bearish price action from here as price filled the imbalance and rejected from bearish order block.
Fundamental analysis: Tomorrow we have news on CAD, will be released Cash Rate, as well on Friday will be released Unemployment Rate in Canada. Important news for CAD, so pay attention to the results in order to validate the analysis.
Like, comment and subscribe to be in touch with my content!

AUD/CAD Gave Yesterday +70 Pips 0 Drawdown , New Entry Added !This Is An Educational + Analytic Content That Will Teach Why And How To Enter A Trade
Make Sure You Watch The Price Action Closely In Each Analysis As This Is A Very Important Part Of Our Method
Disclaimer : This Analysis Can Change At Anytime Without Notice And It Is Only For The Purpose Of Assisting Traders To Make Independent Investments Decisions.

AUDCAD TradingView H1Here is my view for AUDCAD on H1. The price could go bullish, you can put a pending order on the Order block or find an entry on LTF within OB Zone. Trade Safe!

AUD/CAD Giving A Good Bullish P.A On W/D/4H T.F , Time To Buy ?This Is An Educational + Analytic Content That Will Teach Why And How To Enter A Trade
Make Sure You Watch The Price Action Closely In Each Analysis As This Is A Very Important Part Of Our Method
Disclaimer : This Analysis Can Change At Anytime Without Notice And It Is Only For The Purpose Of Assisting Traders To Make Independent Investments Decisions.

AUDCAD Bullish Divergence in 1 HROANDA:AUDCAD
Bullish Divergence Create in 1 HR TF. We enter this trade little bit late.
AUD More Strong compare to CAD
Same Divergence create AUD USD pair
We only enter this trade due to DXY Bullish.

AUDCAD Trade Idea💸 #AUDCAD💸
(Australian Dollar/Canadian Dollar)
📊 30min
⚠️Limit order
🟢Buy Level: 0.89100$-0.8905
❌StopLoss:0.88900$
➖➖➖➖➖➖➖➖
📊Powered By Smart Money Concept+Volume profile
🆚Risk/Reward Ratio:3
➖➖➖➖➖➖➖➖
📅 05.23.2023
📫Get Free Access to Premium «Analysis + Trading Signals»

AUDCAD LongHello Traders
I hope you all are doing well.
The idea here is about AUDCAD Long.
I am most inclined towards price action, the moment we breakout. i will be taking the trade.
Observations below
Falling wedge (Waiting for breakout)
Elliot wave 5-3 completed. (Considering last 1D candle taking support on trendline started on 21 Oct 2022)
Harmonic pattern
Bullish Butterfly 1D (For TP3 0.97145)
5 Bullish Divergences 1D RSI, Stoch, OBV, MFI, Hist
Not a financial advice.

AUD/CAD - Trade Setup Structure: Solid power move to the support zone aligned with the 200 MA Strategy
Trade: Long
Risk/Reward: 1:2
Disclaimer: DYOR!

AUDCAD BUYHi fellow traders, AUDCAD has completed a larger WXYXZ flag correction. Look for a buy opportunity from the blue box in this smaller 3-wave correction. Target the resistance levels. Good luck and trade safe!
