AUDCAD ON A CHANNELAUDCAD
The price is going down on a channel and im hoping for tonight that the price respects the level as a ceiling and continues the way down near level 0.945.
.
.
.
El precio esta bajando por un canal y estoy esperando que el precio respete la zona donde esta en este momento como un techo y vuelva a bajar hasta tocar el nivel 0.945.
Audcadsell

AUD/CAD SHORT SET UP (1Month TF/1Week TF/8Hour TF)AUD/CAD SHORT SET UP ON (1Month TimeFrame/1Week TimeFrame/8Hour TimeFrame)
SIGNAL BELOW
TITLE/(DATE)- AUD/CAD
ASSET- Forex
PLATFORM- MT4
ORDER TYPE- SELL LIMIT
Time Frame- 4hr
ENTRY PRICE 1- 0.95980 (pending)
ENTRY 2- 0.96260 (pending)
STOP LOSS- 0.96480 (50PIPS)
TAKE PROFIT 1- 0.95480 (50 PIPS)
TAKE PROFIT 2- 0.94980 (100 PIPS)
TAKE PROFIT 3- 0.94480 (150 PIPS)
TAKE PROFIT 4- 0.93980 (200 PIPS)
STATUS: Pending


AUDCAD Short A head and shoulder pattern has been formed, usually we wait for a small re-test than enter the trade.
I would like to know whether these analysis are useful/educational to you, if they are please hit like and share, that will confirm i should keep them coming. More great set ups coming...,
Thank You.

AUDCAD - SWING - 11. AUGU. 2020Welcome to our weekly trade setup ( AUDCAD )!
-
1 HOUR
Bearish market open and pressure below main sr level.
4 HOUR
Prices broke back into our trend following midterm.
DAILY
Overall bullish market at its lows, good long entries!
-
FOREX SWING
BUY AUDCAD
ENTRY LEVEL @ 0.95570
SL @ 0.95130
TP @ 0.96240
Max Risk. 0.5% - 1%!
(Remember to add a few pips to all levels - different Brokers!)
Leave us a comment or like to keep our content for free and alive.
Have a great week everyone!
ALAN


AUDCAD - BEARISH BIAS.#AUD - Bearish Mode
Recap:
1️⃣ Aussie down because of the rising COVID-19 cases in Australia,disappointing business confidence data and global risk sentiment moved towards negative.
2️⃣ U.S.-China tensions were once again a focus after China ordered the closure of a U.S. consulate in Chengdu and US Secretary of State Mike Pompeo urged China’s citizens to help ‘change the behaviour’ of their government.
Review:
1️⃣ Australia CPI For Q2
- Bearish prediction — Dropped in consumer inflation expectations in Q2.
2️⃣ 2nd quarter GDP figures from key economies, COVID-19 news, and geopolitics will remain the key drivers. A jump in new COVID-19 cases and deteriorating relations with China would likely test support for the Aussie Dollar.
=====
#CAD - Bullish Mode
Recap:
1️⃣ Retail sales bounced back from April’s slump, with inflationary pressures picking up in June.
2️⃣ Crude oil prices also headed northwards in the week, providing the Loonie with support.
Review:
1️⃣ Canada GDP for May
- Bullish prediction — Stronger trade balance and retail sales.

AUDCAD forecast for tomorrow This is what will happen with a huge probability,
Please share with me your thoughts,

BEARISH FLAG - WATCH FOR THISHUGE potential drop incoming - I see 4HR and daily divergence as well as price reaching a key level
Waiting for the dump
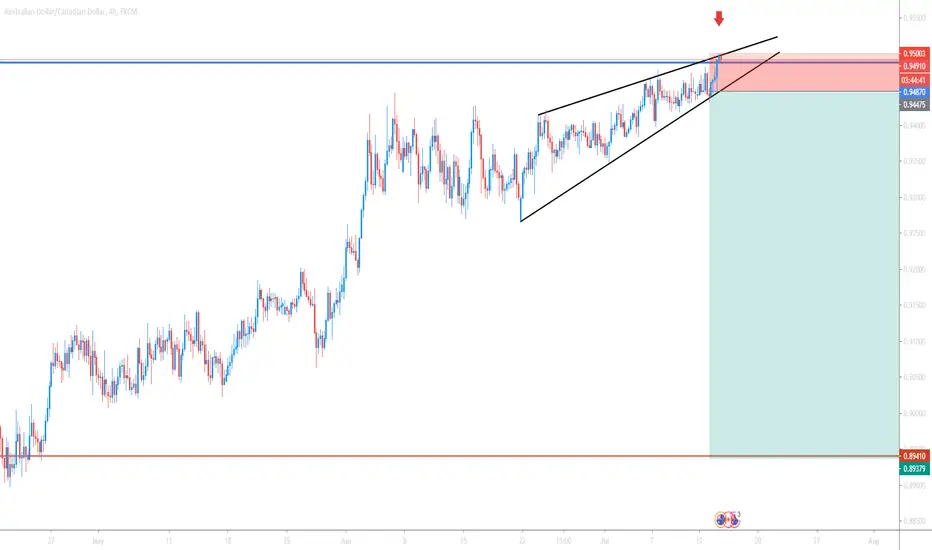


EASY DOLLAR $$$$$$$Waiting for Trendline break / Support to be broken then we are looking for sells to the green area

AUD/CAD Wave Analysis The counter has made a strong move from the low of 0.80 handle to 0.93 handle in just 3 months.
The move could be attributed to a 5-wave pattern and it is now in corrective mode.
It has completed waves A and B is going to kickstart wave C.
The resistance zone around 0.93 handle proves to be a tough nut for the pair despite trying to take it down thrice.
It makes a price action imminent and hence, we expect the pair to be bearish in the short-term.


AUDCAD Bearish on 4HPrice broke below channel so waiting for it to break below support at 0.9271 and close a 4H candle below.


AUDCAD OVERALL BULLISH BUT IN A DOWN RETRACEMENTWaiting for a low price to form with a pull back to enter a short position.
Price last week broke the outer up trendline.
Looking to short the King's Crown pattern.
Once price reaches my TP 2, I will wait to ensure price respects that level and look for price to start heading back up to the 1.618 D extension @ 1.02417.

AUDCAD - SELLWe are anticipating another sell from an AUD pair.. once price has broken this level we can sell all the way to the green area
Price has tested this level a few times and been rejected but i believe next week we will see a break and we can start a sell
AUDCAD - SELL
SL - 0.93810
TP - 0.91564


AUD/CAD - Sell Opportunity!Price has broken market structure. We are waiting for price to retest our highlighted area for sell entries.

AUDCAD GREAT SHORTTHIS IS GREAT OPPOTURNITY FOR SELL. THE PRICE CURRENTLY HITTING H4 SUPPLY AND MAY CONTINUE BEAR UNTIL IT MEET H4 DEMAND. PUT SL SLIGHTLY ABOVE SHADOW OF SUPPLY H4 AND TP ON DEMAND ZONE OF H4.

AUDCAD SELL IDEASI am trying combination of candle pattern and supply and demand strategies. We see evening star on m15 tf and finding sell zone there. But, price continue bull. We may see the bearish trend will start after hitting the H1 supply zone.
