Audcadsell


AUDCAD - WEEKLY SWING - 19. AUGUST 2018WELCOME TO DACAPITAL TRADING!!
AUDCAD just started moving as expected, quick Timeframe breakdown for free and everybody.
4 HOUR
Small Pullback to previous H4 Highs taking out sellers
DAILY
Small 3 day pullback last week but overall bearish
WEEKLY
Very bearish price action last few weeks following this move
LEVELS
SELL AUDCAD @ 0.95550
SL @ 0.96670 (110 Pips)
TP1 @ 0.94320 (120 Pips)
TP2 @ 0.93870 (170 Pips)
MOVE SL TO BE @ HIT OF 88.6 FIB!
Weekly Wave Swing, Close 3/4 Position at Hit of TP1!
Enjoy our limited Free Content and Setups,
leave us a like and Comment!!
DACAPITAL TRADING

AUDCAD - WEEKLY SWING - 09. JULY 2018WELCOME TO DACAPITAL TRADING!!
AUDCAD just started moving as expected, quick Timeframe breakdown for free and everybody.
4 HOUR
Small Bullish Pullback and Price getting Slower, good entry!
DAILY
Last few Days Market started to pullback into our Favor
WEEKLY
Overall very Bearish with a very strong Bearish price action last 3 weeks
LEVELS
SELL AUDCAD @ 0.97500
SL @ 0.98250 (75 Pips)
TP1 @ 0.96620 (85 Pips)
TP2 @ 0.96380 (110 Pips)
MOVE SL TO BE @ HIT OF 88.6 FIB!
Weekly Wave Swing, Close 3/4 Position at Hit of TP1!
Enjoy our limited Free Content and Setups,
leave us a like and Comment!!
DACAPITAL TRADING

AUDCAD - short opportunityAUDCAD bearish divergence plus strong resistance from daily TF. let's see, where it takes us.. enjoy the profit. Chart is pretty self explanatory.
Please hit "LIKE" to support & follow for more ideas.
Vinny


AUDCAD bearish divergence... shortAUDCAD 4H chart showing bearish divergence.. going down to supports *white lines"...
Enjoy free pips..
Please hit LIKE & FOLLOW to support..
Vinny


AUDCAD approaching major resistance, watch for a potential drop!AUDCAD is fast approaching major resistance at 0.9705 (Fibonacci retracement, Fibonacci extension, horizontal overlap resistance) and a strong reaction could occur at this level to push prices all the way down to major support at 0.9644 (Fibonacci retracement, horizontal pullback support).
Stochastic (89,5,3) is seeing major resistance at 91% where a corresponding reaction could occur.
Trading CFDs on margin carries high risk.
Losses can exceed the initial investment so please ensure you fully understand the risks.


>> AUDCAD << April 17th >> Short „Breakout“ Setup <<Hey Guys and Welcome,
AUDCAD broke previous week lows, we are following „Mid“-term Trend with a good RR.
Bearish reaction after forming another HL with a 60% pullback..Following this trend expecting another break..
Short: 0.97457
Sl: 0.97881 (40 Pips)
TP: 0.97060 (40 Pips)
TP2: 0.96480 (100 Pips)
Feel free to Comment and Discuss my Trades.
Have a Great Week :)
Alan

>> AUDCAD << March 28th >> Short „Breakout“ Setup <<Hey Guys and Welcome,
AUDCAD broke previous Week lows, we are following „Mid“-term Trend with a good RR.
Very bearish over the last 3 weeks, following this drop with a good Price action.
Short: 0.99064
Sl: 0.99572 (50 Pips)
Tp: 0.98606 (50 Pips)
Tp2: 0.97905 (120 Pips)
Feel free to Comment and Discuss my Trades.
Have a Great Week :)
Alan

AUDCAD Staring DownOn the daily time frame AudCad is looking at further down movement. The lower range has already been broken and the indicators show power that might also break the support. So AudCad sell position can be profitable to hold for 1-2 days.
Entry: cmp
TP: 0.97 > 0.9645
SL: 0.9820

AUDCAD Bearish Shark PatternEntry 88.6%
Targets 38.2 and 61.8
SL Above X
Use your own trade plan to enter the market

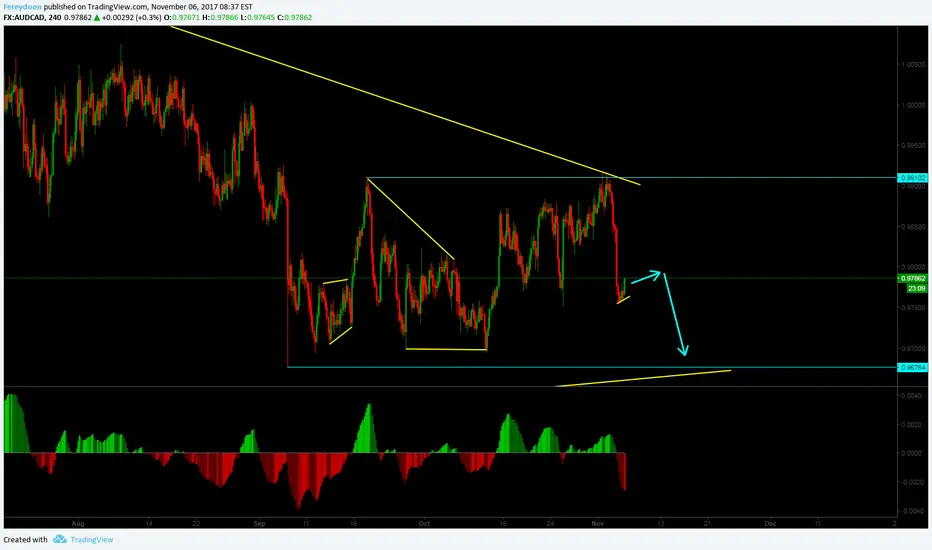
Sell opportunity in AUDCADWe had bearish impulsive move and now we are in consolidation. Selling the break of that structure seems like a good idea. Please trade with care.


AUDCAD QUICK 30 PIPS ! SELLYOU SEE THE CONFIRMATIONS THAT THIS PAIR GAVE SO WE CAN GO EASY AND MAKE A SMALL PROFIT TODAY AND LONG TERM ALSO


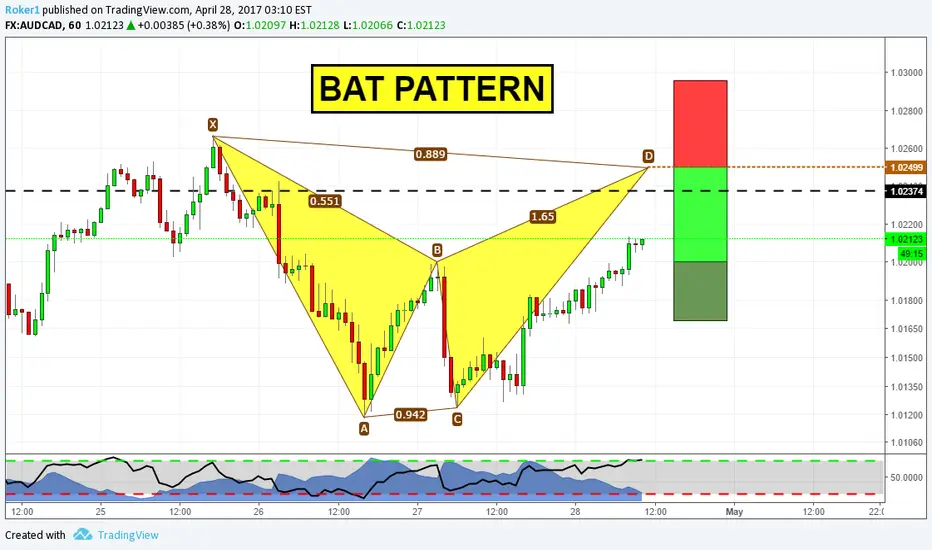
Harmonics with Structure!Hey guys,
here we are on AUDCAD hourly chart. As you can see price has created 4/5 point of the Bat pattern. Now we're just waiting for its completion to come; the black line represents a previous level of daily structure, and that increases the chances we can get a reversal from there.
Stops above X, targets as usual in harmonic patterns.
If you have questions, or if you want to share your viewpoint, feel free to comment below.
Otherwise, see you in the next chart!