AUD/CAD SELL STOP at .8850AUD/CAD is carving out a classic M-Top candle pattern at resisance so a break of the neckline at .8850 will be a confirmed SELL.
M-Tops and W-Bottoms are proof that you don't need indicators to trade.
Indicators obviously help and I use them - but you don't NEED them.
You'll be a successful trader if you just traded M-Tops and W-Bottoms.
These patterns are traditionally traded on a 1:1 ratio with the STOP taken from the neckline to the top of the pattern and the TAKE PROFIT at 1:1 so the STOP is .8879 and the TP is .8819.
As ever, these levels are not set in stone and you should always micro manage your trades and if you reach your take profit and the momentum is still with the position then adjust you TP accordingly.
Similalrly with STOPS. A STOP is not necessarliy a line in the sand that should not be crossed.
If price bounces but the overall structure is still in place then by all means squeeze the SL a bit higher rather than lose but be mindful that there MUST BE a line in the sand if price is continuing north and your're SHORT.
The old adage "let your winners run and shut down your losers early" is for ever true.
Audcadsell

AUDCAD Trade IdeaThe AUDCAD pair has reached a critical support level, marked by this horizontal line on our chart that corresponds to a previous daily open/close. The price is clearly overextended and we expect a correction soon. A potential trade setup may arise later today when the Canadian GDP data is announced. If the data is positive for the CAD, this could offer a good sell opportunity. We are eagerly awaiting this news release. Please note that this is only a trade idea and not a trade recommendation, the information is for educational purposes only and should not be considered as financial advice.

AUDCAD H1 / Expecting a Strong Bullish Move 💲📈 Hello Traders!
This is my forecast for AUDCAD H1. I expect a bullish move on H1 if the retracement will be valid. I expect a rise until the OB around the price of 0.89700.
Traders, if you liked my idea or if you have a different vision related to this trade, write in the comments. I will be glad to see your perspective.
____________________________________
Follow, like, and comment to see my content:
www.tradingview.com

AUDCAD H4 / PERFECT OB RETRACEMENT / OBBULLISH MOVE ACTIVE✅Hello Traders!
This is My idea related to AUDCAD H4. A very nice retracement from the OB, I expect a strong bullish move until the OB at the price of 0.89600.
Traders, if you liked my idea or if you have a different vision related to this trade, write in the comments. I will be glad to see your perspective.
____________________________________
Follow, like, and comment to see my content:
www.tradingview.com

AUDCAD Short Term Sell IdeaH1 - Bearish trend pattern.
Currently it looks like a pullback is happening.
Until the two strong resistance zones hold my short term view remains bearish here.

AUDCAD - SELL - BEARISHSelling only after the retest of the HMA
**This is just my trading thought process and does not constitute as financial advice.
**Please trade with proper risk management**

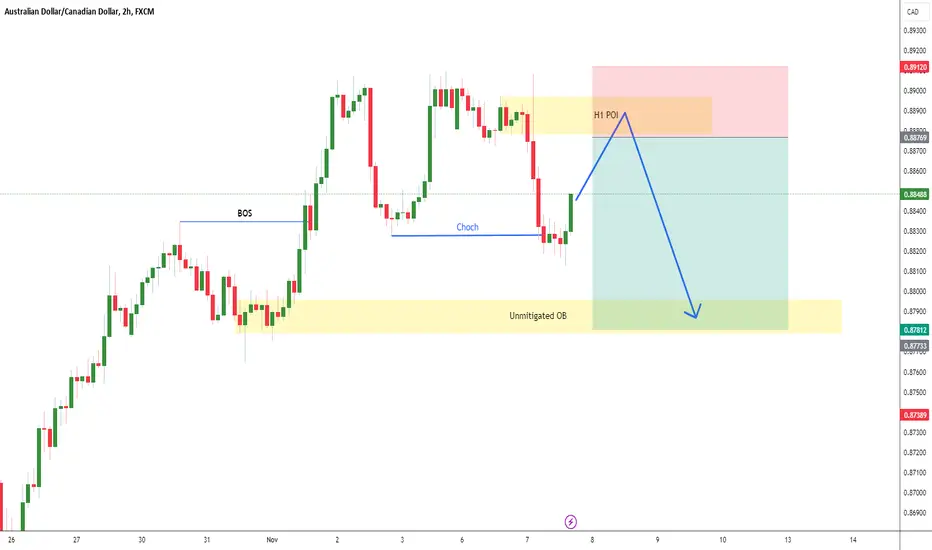
AUDCAD, Expecting down H1AUDCAD, i am Expecting down in H1 soon but it will go a little bit up to take the POI then it will fall directly down to unmitted OB.
AUDCAD Shorting SetupYellow: Open Position
Red: Stop Loss
Green: Take Profit
I am not responsible for your loss!
Thanks for visiting.
Happy Trading!

AUDCAD Short SetupYellow: Open Position
Red: Stop Loss
Green: Take Profit
I am not responsible for your loss!
Thanks for visiting.
Happy Trading!

AUDCAD SellOANDA:AUDCAD
It has been observed that the price has reached the upper side of the bearish channel, indicating that it is likely to commence a downward trend.

AUDCAD Analysis H4Here is my analysis for AUDCAD on H4 using Order Block. The price could go bearish, you can put a pending order on the Order block or find an entry on LTF within OB Zone. Trade Safe!

AUDCAD Technical Analysis and Trade IdeaIn this video, we analyze the AUDCAD currency pair, noting its bearish trend on the higher timeframe. Within the video, we delve into crucial elements of technical analysis, such as the trend, price action, and market structure. Furthermore, we explore a potential trade setup. Please remember that all information is thoroughly explained in the video, and this content should not be considered as financial advice.

AUDCAD Analysis H1Here is my analysis for AUDCAD on H1 using Order Block. The price could go bearish, you can put a pending order on the Order block or find an entry on LTF within OB Zone. Trade Safe!

AUDCAD: 02/10/2023:🔴Short opportunity (Please read the caption)
Hello traders, we need LTF confirmation for both zones. We should not enter as a limit order.
Both zones are valid.
💡Wait for the update!
🗓02/10/2023
🔎 DYOR
💌It is my honor to share your comments with me💌

AUDCAD Long Term BUYING Trading IdeaHello Traders
In This Chart AUDCAD DAILY Forex Forecast By FOREX PLANET
today AUDCAD analysis 👆
🟢This Chart includes_ (AUDCAD market update)
🟢What is The Next Opportunity on AUDCAD Market
🟢how to Enter to the Valid Entry With Assurance Profit
This CHART is For Trader's that Want to Improve Their Technical Analysis Skills and Their Trading By Understanding How To Analyze The Market Using Multiple Timeframes and Understanding The Bigger Picture on the Charts

AUDCAD Technical Analysis and Trade IdeaAnalyzing the AUDCAD currency pair, we observe a bearish shift in market structure evident on both the 4-hour (4H) and daily (1D) charts, characterized by a substantial downward movement. My focus lies on identifying a potential trade opportunity during the retracement phase, capitalising on the imbalances evident within the chart. I encourage you to watch the video for a detailed explanation, but please be mindful that the information provided is for educational purposes and should not be construed as financial advice or recommendations for trading decisions.

AUDCAD 11/09 MovePair : AUDCAD ( Australian Dollar / Canadian Dollar )
Description :
Completed Its Impulse and Correction and It can again make Impulsive move if Reject the Upper Trendline. Completed " 12345 " and " AB " Corrective Waves , Rejecting the Lower Lows / Lower Highs Trend with Strong Bullish Price Action

AUDCAD: How low can you go? Australian dollar against Canadian dollar is a fascinating pair.
And from historical chart patterns, we can conclude that AUDCAD is in a descending channel.
Our bias will be to follow the trend down and exit early.

AUDCAD Analysis H1Here is my analysis for AUDCAD on H1 using Order Block. The price could go bearish, you can put a pending order on the Order block or find an entry on LTF within OB Zone. Trade Safe!

AUDCAD Will Fall From Falling Resistance!AUD-CAD was going up
After the pair made a rebound
From the local bottom but
The pair is still in the downtrend
And is trading in a below
The falling resistance
So after the retest I think
That a move down is
Very likely !

AUDCAD Short Bearish gets strongerAustralia's ties to China and the 'hard' commodities it produces have fostered a historical relationship between the local currency and precious metals. The value of the Canadian Dollar is strongly correlated with the price of crude oil as the country remains a dominant exporter of the commodity. Both currencies are therefore sensitive to broader commodity price trends.
AUD has been hurt by a mix of factors recently: a setback in risk sentiment amid the lack of meaningful progress in Washington over raising the debt limit, a trimming back of rate cut expectations after hawkish speak from US Federal Reserve officials, and underwhelming Australia data (jobs data being the most recent).
This puts increased focus on Australia retail sales data for April due Friday – forecast to have slowed to 0.1% on-month from 0.4% previously.A below-expected print could precipitate a decline in AUD. Also, a higher-than-expected US core PCE price index print (expected to remain flat at 4.6% on-year) could boost USD.
AUD/CAD’s fall below a horizontal trendline from April at about 0.8950 has triggered a minor double top (the April and the May highs), potentially exposing downside risks toward 0.8800. The bearish development follows a failure to cross above stiff resistance on the 89-day moving average (see the daily chart).

AUDCAD Idea H1Here is my analysis for AUDCAD on H1 using Order Block. The price could go bearish, you can put a pending order on the Order block or find an entry on LTF within OB Zone. Trade Safe!

AUDCAD Analysis H1Here is my analysis for AUDCAD on H1 with Order Block. The price could go bearish, you can put a pending order on the Order block or find an entry on LTF within OB Zone. Trade Safe!
