AUDCAD Bullish Wedge (Perfect buy setup!)AudCad is forming a classical bullish wedge on the daily time frame. Besides that its also about the bounce of the lower range. At this stage AudCad looks like a beautifull buy opportunity. When looking at other Cad pairs you can still see that the Cad is a weak currency. Judging by this setup AudCad will soon follow the other cad pairs.
Take profit: 1.0289 > 1.0331
Stop-loss: 1.0010
Audcadsetup


Long AUDCAD - Until Oil starts to pick back up:Oil has taken a beating recently, so the CAD has suffered a tad.
I am long AUDCAD until oil starts to make a recover (seems like it wants to starting now, make no mistake oil WILL come up again, it's just a matter of when) - So I am long AUDCAD until oil starts to turn around. Target 1.017 - Stop Loss - 1.01


AUDCAD H&S AnalysisCAD bulls are still working to break below the neckline. A retest of the right shoulder is appropriate not necessary.

DOWNTREND IN AUDCAD - 4H CHARTHey Guys,
We may have Blue or Red:
Blue: More downtrend.
Red: One more up and then have an ABC correction to sell.
Watch for these moves!
-
Hola Chicos,
Tendremos camino Azul o Rojo:
Azul: Continuación de la tendencia.
Rojo: Un movimiento más arriba para hacer una corrección ABC y después caer.
Estad al tanto!
Carlos


AUDCAD D TECHNICAL ANALYSISFIRST LONG & LATER SHORT.
80 PIPS UP & 100 PIPS DOWN.
We buy this pair at current level and book profits +80. Once the price reached 1.0350, we sell it and book profit @ 1.0150
We will share further analysis on lower time frame charts to elaborate the idea.

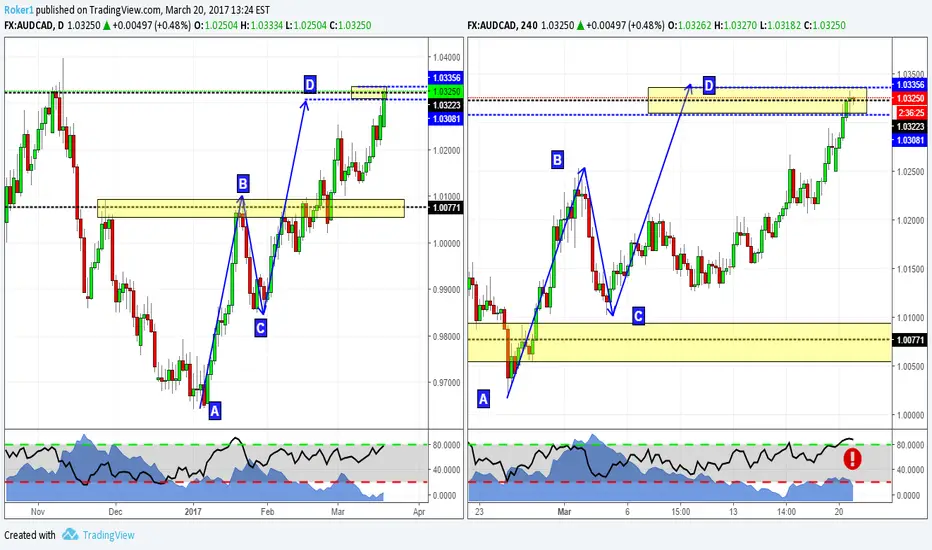
AUDCAD a possible AB=CD trade!As you see guys, looks like AUDCAD making an AB=CD that may complete at major resistance zone. Looking for a possible down move at that level.

AB=CD Patterns unfolding!Hi guys,
this evening i want to bring your attention on this scenario on AUDCAD. As you can see on the left hand side of your screen, price is now testing a key resistance zone on the daily timeframe. Also, it has created two different ab=cd patterns (one on the daily, one on the 4hr chart) that are going to complete right at that structure level.
RSI is in overbought condition on the 4HR.
Pay attention to price action.
I'm waiting for a sell signal.
I'll keep you updated!
If you want to share your viewpoint, or ask questions, feel free to comment below.
Otherwise, see you in the next chart!

Harmonic Patterns on AUDCADHi guys,
this evening i want to bring your attention on this scenario on AUDCAD. As you can see on the left hand side of your screen, price is now testing a key resistance zone on the daily timeframe. Also, it has created two different ab=cd patterns (one on the daily, one on the 4hr chart) that are going to complete right at that structure level.
RSI is in overbought condition on the 4HR.
Pay attention to price action.
I'm waiting for a sell signal.
I'll keep you updated!
If you want to share your viewpoint, or ask questions, feel free to comment below.
Otherwise, see you in the next chart!
AUDCAD - Breakout or pullback? Wait around two weeks.This one is pretty interesting. I will definitely look into selling the pullback or buying the breakout later in the upcoming weeks.

AUDCAD approaching strong resistance. Currently retracing from 1.07 on 18/03/13
This pair has touched the 23.6 retrace twice since 14/04/2014.
Both times it has failed to break.
A clear rejection sign at this point (hopefully around the start of April), will be an excellent short opportunity till at least 1.0125.

Buy opportunity on AUDCAD on the retestdont trade in the white zone
Just my view of the market. Not a Financial advice

Audcad Money Trade!!This is The Best Setup Ever. C leg is extremely streched shows bearish pressure.Any short trade cannot be better than this one.
Best of luck Muze (aud/cad)

Gartley's coming on AUDCADHey guys,
i bring to your attention this kind of harmonic pattern that's completing right now on this chart, it is called Gartley.
Its completion point D is right around the corner. Orders set.
Stops above X, targets at the .382 and .618 of the AD leg.
Feel free to write below for any matter.
Otherwise, see you in the next chart!


AUDCAD 4H TECHNICAL ANALYSISTake Entry @ 1.00148
Take Profit @ 1.00904
Stop Loss @ 0.98637
Best of Luck !!

AUDCAD now it's a buyHey guys,
yesterday we took profit of our last AUDCAD trade that brought in more than 150 pips (see attachment). Now i changed my mind about this pair being the recent movements price has made. As you can see on the left hand side of your screen on the daily timeframe price is testing a daily structure level that acted as support. Being the case, we expect to see some difficulty breaking through. In the lower timeframe (4H-right hand side) price's put an engulfing candle with RSI OVERSOLD, right at that level which happens to be also a psychological number.
With all those conditions met i think this could be a good opportunity to buy the market hoping for a retest of the higs at 1,070.
Good luck!
If you have any question, feel free to write below.
Otherwise, see you in the next chart!

Forecast AUDCAD: limited move down, then move upThis week we have important data from AUD (interest rate decision) on Tuesday, followed by important data from CAD later that day.
Forecast is a stronger AUD. First false move lower on unchanged interest rate decision, then move higher on CAD data.
Alternative view: charts.mql5.com
