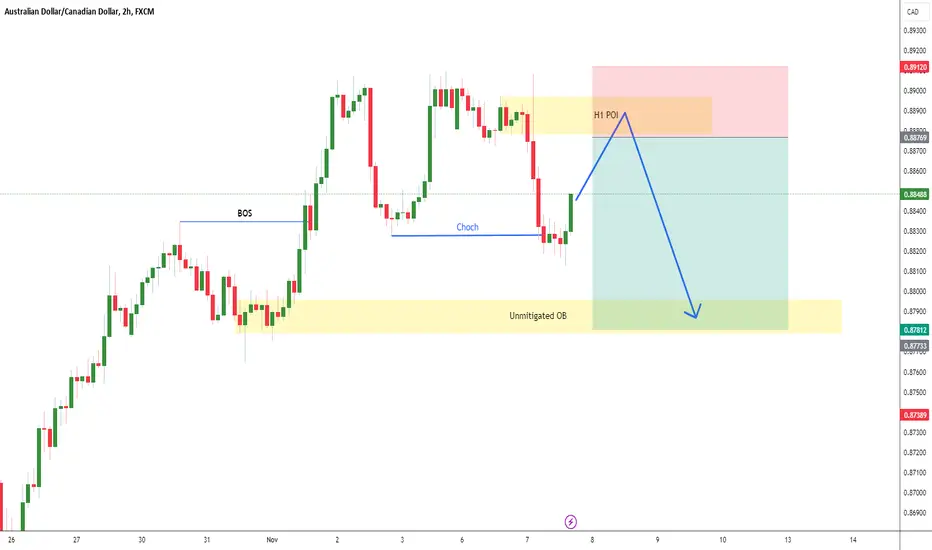
AUDCAD Shorting SetupYellow: Open Position
Red: Stop Loss
Green: Take Profit
I am not responsible for your loss!
Thanks for visiting.
Happy Trading!
Audcadsetup

AUDCAD, Expecting down H1AUDCAD, i am Expecting down in H1 soon but it will go a little bit up to take the POI then it will fall directly down to unmitted OB.
AUDCAD Analysis H4Here is my analysis for AUDCAD on H4 using Order Block. The price could go bullish, you can put a pending order on the Order block or find an entry on LTF within OB Zone. Trade Safe!

AUDCAD - Potential long ✅Hello traders!
‼️ This is my perspective on AUDCAD.
Technical analysis: As we can see here price changed the character and started to make higher highs and higher lows, so I am looking for long position. I want price to continue the retracement to fill that little imbalance lower and then price to reject from bullish order block + institutional big figure 0.87000.
Fundamental news: On Friday will be released Unemployment Rate in Canada, so pay attention to the result in order to validate the analysis.
Like, comment and subscribe to be in touch with my content!

AUDCAD Short SetupYellow: Open Position
Red: Stop Loss
Green: Take Profit
I am not responsible for your loss!
Thanks for visiting.
Happy Trading!

AUDCAD Long Term Selling Trading IdeaHello Traders
In This Chart AUDCAD DAILY Forex Forecast By FOREX PLANET
today AUDCAD analysis 👆
🟢This Chart includes_ (AUDCAD market update)
🟢What is The Next Opportunity on AUDCAD Market
🟢how to Enter to the Valid Entry With Assurance Profit
This CHART is For Trader's that Want to Improve Their Technical Analysis Skills and Their Trading By Understanding How To Analyze The Market Using Multiple Timeframes and Understanding The Bigger Picture on the Charts

AUDCAD Analysis H4Here is my analysis for AUDCAD on H4 using Order Block. The price could go bearish, you can put a pending order on the Order block or find an entry on LTF within OB Zone. Trade Safe!

Daily Wave Rider - AUDCAD - SELLAUDCAD
Channel: RED
WK Pivot: RED
AOB: WS1
CON: SBB
SELL Stop: 0.85838
Stop Loss: 0.86677
TP01: 0.84999
TP02: 0.83321
DWR present as a sell setup on 16 OCT, with Channel and Pivot are red bouncing off weekly support line
However, trade is not taken/considered as it is Monday which is normally correction day and market is unpredictable
SPX500: SELL
DXY: SELL
OIL: SELL
GOLD: BUY

AUDCAD Analysis H1Here is my analysis for AUDCAD on H1 using Order Block. The price could go bearish, you can put a pending order on the Order block or find an entry on LTF within OB Zone. Trade Safe!

Hello traders, Audcad analysis, Hello traders, Audcad analysis, the general trend is down, and the ascending channel has now been broken. We are waiting for a retest in the breakout area. It will be a great selling opportunity from the 0.87251 area. Good luck.

AUDCAD is going to bearish trendIn the 1-hour time frame, we've observed a significant bearish divergence, which is a clear indication of potential downside pressure. This divergence, combined with the double top formation, suggests that bearish sentiment currently outweighs bullish sentiment.
Bearish Divergence: The bearish divergence occurs when the price makes higher highs while the relevant technical indicator, such as the Relative Strength Index (RSI), makes lower highs. This divergence often signals a weakening bullish trend and potential reversal.
While these indicators point towards a potential bearish outlook, it's crucial to keep in mind that market dynamics can change quickly. Traders and investors should exercise caution and consider various factors before making any trading decisions.
Please stay tuned and follow for more intriguing market insights and trade ideas.

A Clear Potential Selling Opportunity Sell Description:
Pair: AUDCAD
SL: 20 - 30 pips
TP: 80-100 pips
We have identified a potential selling opportunity in pair. The price has shown signs of bearish momentum and is currently trading below key resistance levels.
Our entry point for this trade is is Shown in Picture, with a stop loss (SL) set at . This provides a risk-reward ratio of approximately 1:3,4 ensuring a favorable risk management strategy.
Our take profit (TP) target is set at mentioned Area on the chart, aiming for a potential gain of 80 to 100 pips. This level aligns with previous support and offers a high probability of price reversal or further downward movement.Please note that trading involves risks, and it is essential to manage your positions carefully. Always adjust your position size according to your risk tolerance and ensure you have a clear understanding of the market conditions before entering any trades.

AUDCAD Long Term BUYING Trading IdeaHello Traders
In This Chart AUDCAD DAILY Forex Forecast By FOREX PLANET
today AUDCAD analysis 👆
🟢This Chart includes_ (AUDCAD market update)
🟢What is The Next Opportunity on AUDCAD Market
🟢how to Enter to the Valid Entry With Assurance Profit
This CHART is For Trader's that Want to Improve Their Technical Analysis Skills and Their Trading By Understanding How To Analyze The Market Using Multiple Timeframes and Understanding The Bigger Picture on the Charts

Daily Wave Rider - AUDCAD - SELLAUDCAD
Channel: RED
WK Pivot: RED
AOB: WP
CON: EngB
SELL Stop: 0.86654
Stop Loss: 0.87157
TP01: 0.86151
DWR present as a sell setup on 18SEP, with Channel and Pivot are red bouncing of weekly pivot
However, trade is not taken/considered as it differs from our Market Analysis Bias.
SPX500: BUY
DXY: SELL
OIL: SELL
GOLD: BUY
Reference to our WK38 analysis, we are anticipating a "Risk-On" sentiments thus will BUY AUD/NZD.

Daily Wave Rider - AUDCAD SELLAUDCAD
Channel: RED
WK Pivot: RED
AOB: WP
CON: SBB
SELL Stop: 0.86740
Stop Loss: 0.87410
TP01: 0.86070
DWR present as a sell setup on 18SEP, with Channel and Pivot are red bouncing off weekly pivot.
However, trade is not taken/considered as it differs from our Market Analysis Bias.
SPX500: BUY
DXY: SELL
OIL: SELL
GOLD: BUY
Reference to our WK38 analysis, we are anticipating a "Risk-On" sentiments thus will BUY AUD/NZD.

AUDCAD Technical Analysis and Trade IdeaAnalyzing the AUDCAD currency pair, we observe a bearish shift in market structure evident on both the 4-hour (4H) and daily (1D) charts, characterized by a substantial downward movement. My focus lies on identifying a potential trade opportunity during the retracement phase, capitalising on the imbalances evident within the chart. I encourage you to watch the video for a detailed explanation, but please be mindful that the information provided is for educational purposes and should not be construed as financial advice or recommendations for trading decisions.

AUDCAD 11/09 MovePair : AUDCAD ( Australian Dollar / Canadian Dollar )
Description :
Completed Its Impulse and Correction and It can again make Impulsive move if Reject the Upper Trendline. Completed " 12345 " and " AB " Corrective Waves , Rejecting the Lower Lows / Lower Highs Trend with Strong Bullish Price Action

Daily Wave Rider - SELL AUDCADChannel: RED
WK Pivot: RED
AOB: EMA10
CON: SBB
SELL Stop: 0.8688
Stop Loss: 0.8760
TP01: 0.8616
TP02: 0.8588
DWR present as a sell setup on 11SEP, with Channel and Pivot are red bouncing off EMA10.
However, trade is not taken/considered as it differs from our Market Analysis Bias.
SPX500: Up
DXY: Down
OIL: Up
GOLD: Up
Reference to our WK37 analysis, we are anticipating a "Risk-On" sentiments thus will BUY AUD/NZD.

AUDCAD Long Term BUYING Trading IdeaHello Traders
In This Chart AUDCAD DAILY Forex Forecast By FOREX PLANET
today AUDCAD analysis 👆
🟢This Chart includes_ (AUDCAD market update)
🟢What is The Next Opportunity on AUDCAD Market
🟢how to Enter to the Valid Entry With Assurance Profit
This CHART is For Trader's that Want to Improve Their Technical Analysis Skills and Their Trading By Understanding How To Analyze The Market Using Multiple Timeframes and Understanding The Bigger Picture on the Charts

AUDCAD: How low can you go? Australian dollar against Canadian dollar is a fascinating pair.
And from historical chart patterns, we can conclude that AUDCAD is in a descending channel.
Our bias will be to follow the trend down and exit early.

AUDCAD Analysis H1Here is my analysis for AUDCAD on H1 using Order Block. The price could go bearish, you can put a pending order on the Order block or find an entry on LTF within OB Zone. Trade Safe!

AUD CAD LONGRIsky Trade which is against the trend.
Risk 0.5%
TP1 = 1:5 RR
Disclaimer:
The contents in this Idea are intended for information purpose only and do not constitute investment recommendation or advice. Nor are they used to promote any specific products or services. They serve as an integral part of a case study to demonstrate fundamental concepts in risk management under given market scenarios. A full version of the disclaimer is available in our profile description.

AUDCAD Analysis 31July2023Upon examination of the bearish channel formed a few months ago, there appears to be a flag pattern in the current price which could indicate a possible reversal. It is expected that prices will remain within a narrow range in the coming weeks. With this analysis, we can pursue scalping with a relatively low level of risk.
