AUDCAD SellGood day everyone! Don't forget to put your thumbs up and write comment if you like the idea.
AUDCAD sell 0.94365 and 0.94837. SL 0.9600. Risk 1%. Sale from monthly and weekly target area. In the week they came for a test of the upper edge of the balance sheet , and in the week for commercial interest for sale. First Target Standard, Global Target Return to Area 0.92710.
DISCLAIMER:
The opinion of the author may not coincide with yours! Keep this in mind and consider in your trading transactions before making a trading decision.
Audcadshort

AUDCAD - Selloff continuation ✅Hello traders!
‼️ This is my perspective on AUDCAD .
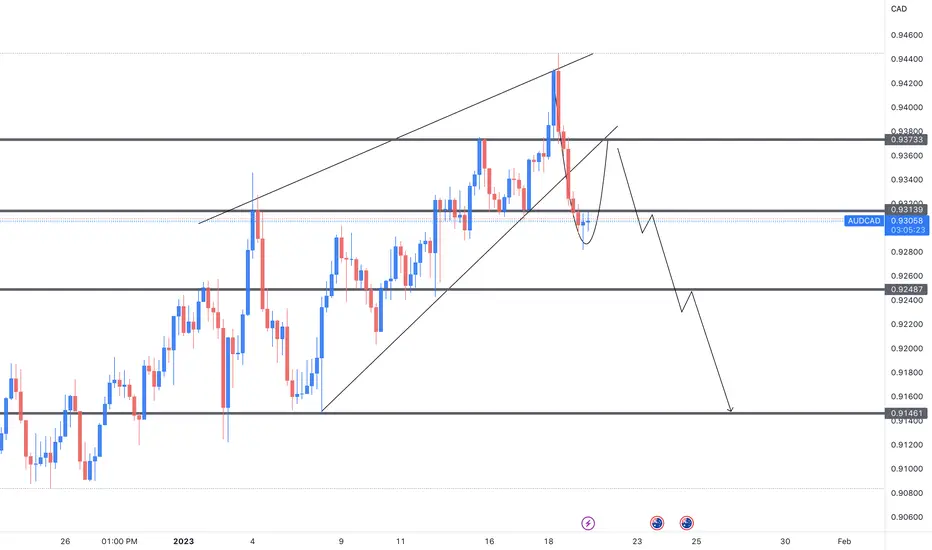
Here I expect bearish price action to continue as price took out buy stop liquidity and rejected from institutional big figure 0.95000. Also an argument is that price forme a normal divergence on daily timeframe.
‼️Attention!!! Due to the fact that we have a lot of news events upcoming week, the analysis can be invalidated.
Like, comment and subscribe to be in touch with my content!

AUDCAD Analysis SHORTTHIS IS MY IDEA ABOUT AUDCAD
DON'T FORGET STOPLOSS
AUDCAD Chart, Rate and Analysis
AUD CAD | Australian Dollar Canadian Dollar

AUDCAD Reaching to a Resistance ZoneAUDCAD Reaching to a Resistance Zone
Divergence on RSI, MACD
Important zone to watch and trade.

AUDCADAUDCAD is in a 4H supply zone and on my 4H chart, it just broke structure to the upside which i am expecting a pullback to the premium 4H demand zone. Nevertheless, in current price sitting at the 4H supply zone, 1min has switched bearish and I'm taking an entry at 0.94861 with a 3pips Stop Loss at 0.94891 targeting a 100pips minimum. I hope you find this useful. Cheers.

AUDCAD SHORT AUDCAD SHORT IDEA
audcad has been reached (HTF) Oder Block and 1H clean market break of structure. from the intuition movement IB area we can go for short trade.

AUD/CAD :: Very important range !!!AUD/CAD :::
Various supports and resistances are located in this range. Waiting can be the best decision until the decision to take a position is made after the change.

AUDCAD (SHORT)Everything seems to be aligning for a short entry on AUDCAD. looking for price to retest on the previous level of support.
AUD/CAD :: Movement in the upper part of the middle line .AUD/CAD :::
The price has been moving in the lower part of the channel for some time and the middle line has been the resistance of this movement
And now the resistance has been broken, we can expect the price to move above the middle line for a while ,
And it will definitely have downward corrective movements .

AUD/ CAD Short...AUD/CAD ... This is not signal... Dont risk more than 3% of your account on any trade...

AUD/CAD AnalysisIf the AUD/CAD pair continues to stay below 93.50, it may see 90.60 and 89.50 levels.

AUDCAD analysis wait and make a short sellAUD CAD is bullish .
we think that it would move toward the upward resistance where is the supply zone found .
Here you could enter a short sell with a stoploss not away due to the upward trend.
here we divide the target as two pieces as usual.
if you like it boost this idea

AUDCAD-SHORT - we had since a long bullish impulse however, the long tern view on audcad, is bearish. Therefore, we are expecting a continues bearish downtrend.

AUD/CAD :: Short position for lower time frame and ...AUD/CAD :::
The resistances have performed their role well and now it is the turn of the supports .
Currently, the movement is downwards and the best positions have been determined for the short position .
In case of a change in the course of the route ::
The chart is reviewed again .
<<< Good luck >>>

AUD/CAD SHORT TRADE ...According to SMC , We have a trade entry for short on AUD/CAD pair as following :
ENTRY @ 0.91540
SL @ 0.91774
TP @ 0.90839
RRR : 1:3
GOOD LUCK GUYS ...

AUDCAD: Elliot Wave Price action Continuing the previous analysis with more details. It can be expected that wave c will correct up to 0.8935 and continue to grow.

AUD/CAD Technical Analysis: Short Looking to enter as close to the resistance level as possible.
.946 is my best option entry
in case it will fall before reaching levels we will pick up short position on pullback.

AUDCAD BUY / AUD CAD BUYAud Cad Buy from here.
Entry at : 0.92350
Stop Loss : 0.91200
Take Profit : 0.93000
Please Subscribe
Hope you enjoy

AUDCAD Investment Plan - 30/Dec/2022Hello Traders,
Hope you all are doing good!!
I expect AUDCAD to go Down after finishing the current correction in LTF.
Look for your SELL setups.
Considering the fact that there are also traders looking for ideas wrt investment purpose, I will be posting my view on few assets for Long term trades.
Please follow me and like if you agree or this idea helps you out in your trading plan.
Disclaimer: This is just an idea. Please do your own analysis before opening a position. Always use SL & proper risk management.
Market can evolve anytime, hence, always do your analysis and learn trade management before following any idea

AUDCADVery simple ... Very clear!
Everything is marked on the chart.
This is my personal opinion. Please do not trade based on my analysis and data.

AUDCAD :Elliot Analysis 4hr 340 pip Hello guys. According to the Chart of AUDCAD all of things be clear and it's not to describe any word.

AUDCAD, best place for another short.HTF Bearish
LTF Short term bullish.
Price currently in bearish continuation.
Strong reversal impulse broke all previous lows.
More downside to continue after retest of 0.926 level.
Trade Safe
Thanks

AUDCAD BEARISH OUTLOOKThe AUD/CAD currency pair had broke and remained under one of its major supports at 0.9133 on the 1H graph, which is an indicator for bearish trend for the instrument.
Both technical indicators, RSI and MACD are confirming the outlook for the pair. In this case in the next few hours the price might try to test levels of 0.91 In the opposite scenario the price might try to climb back to levels of 0.915
Risk Disclosure: Trading Foreign Exchange (Forex) and Contracts of Difference (CFD's) carries a high level of risk. By registering and signing up, any client affirms their understanding of their own personal accountability for all transactions performed within their account and recognizes the risks associated with trading on such markets and on such sites. Furthermore, one understands that the company carries zero influence over transactions, markets, and trading signals, therefore, cannot be held liable nor guarantee any profits or losses.
