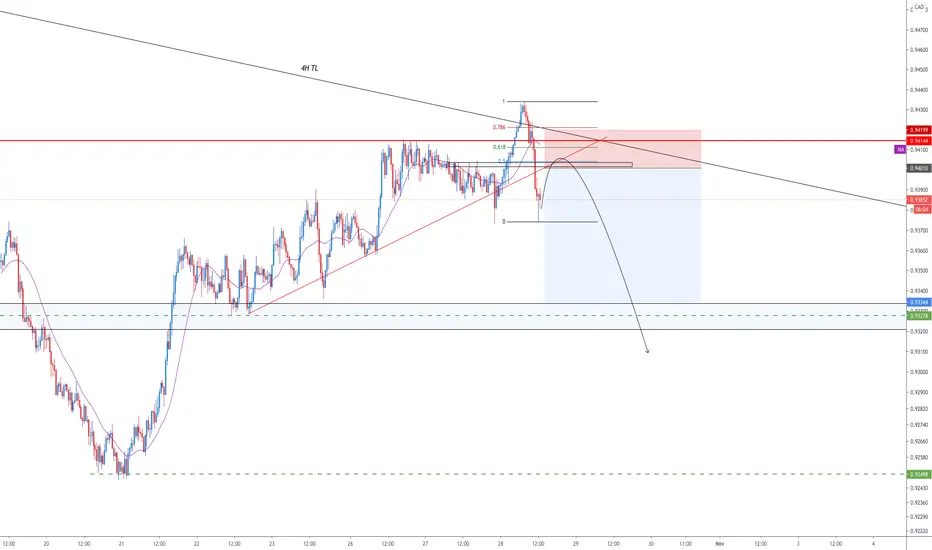
AUDCAD - SHORTAUDCAD is on a downward trend and is capped by the fibbo resistance around 0.9409 and the downward trend line just above that. The asset remains responsive to risk off mood which we could see play out with the current volatility that lies ahead around the US election. We saw it test the 0.9347 fibbo support yesterday and have since bounced. I remain a seller of the rally's. I have opened a short at 0.9380, SL 0.9420 (on the close) and finally a TP 1: 0.9347 TP2: 0.9303.
Audcadshort

AUDCAD ShortOANDA:AUDCAD
Nice retracement on this pair, pulled back and hit the 618 fib.
Double top at that level, also RSI divergence on the double top.
Will take half the position off at a retest of the recent lows at .09400 level.
Then roll stops and take the rest off at 127 fib


AUDCAD - SHORTAUDCAD is on a downward trend and is capped by the fibbo resistance around 0.9409 and the downward trend line just above that. The asset remains responsive to risk off mood which we could see play out with the current volatility that lies ahead around the US election. I have opened a short at 0.9403, SL 0.9420 (close) and finally a TP 1: 0.9347 TP2: 0.9303

AUDCAD, daily tf, double top pattern to materializeHello my friends,
Today i got a nice setup fo AUDCAD pairs.
Before i start my analysis i am gonna review some of my trading positions that i shared with everyone here.
Yesterday was a great day that so many positions hit take profit and i banked some decent profit.
In total it was +18% profit and it consists of:
1st is GBPJPY pairs for +120 pips banking +4% profit
2nd is XAUUSD pairs for +300 pips banking +6% profit
This setup take some times to materialize but it was worth the wait.
3rd is CADJPY pairs for +125 pips banking +10% profit
This trade stop loss was only 25pips as we get into it at a very good position. I closed my position at 78.50 as it has already gave decent profit
I am planning on selling it again once i got some retracement on this pair.
4th is EURAUD pairs which take my stop loss for -70 pips yielding -2% loss
This trade take my stop loss before going in favor with my direction.
After taking my stop loss, i managed to jump into it once again and now it is going in my favor again.
As you can see, there is no way we could get 100% right all the time but if we managed the risk properly we will get positive results.
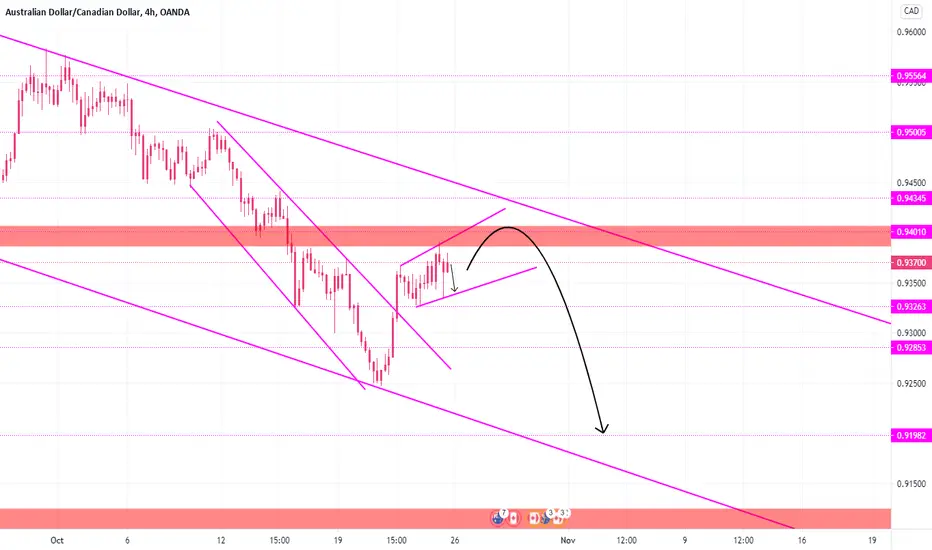
This par made an obvious double top pattern and price already broken below the neckline/support zone.
This upwards movement is a retest of broken neckline in my opinion.
This is a textbook trade so we don't need to analyze it in a complicated way and just keep it simple.
The measured objective of this pattern is 230 pips to the downside and it is not completed yet.
So we will sell it again to see if this objective gonna be completed or not.
Sell AUDCAD 0.9400
Stop loss at 0.9450
Take profit 0.9200
RR ratio 1 : 4 (4R)
Use only 1-2% risk
Good luck

Rejected Off the Resistance for AUDCAD!!!From our previous analysis, we managed to secure the BULLISH movement 0.9405 resistance level where we were planning to look out for a rejection or a break out. As of now, We managed to see a clean rejection and I will be looking to see price movement heading towards a strong support level. However, what we currently see is a short retest movement to a weak resistance at 0.9390. We should see a fall soon for this pair. Do keep a look out will be a good BEARISH trade to support!!!
Kindly hit the LIKE Button if you agree with my analysis and feel free to COMMENT your idea below. As for those who are keen to get daily updates and analysis from me feel free to FOLLOW me. Cheers and Happy Trading!!

Pullback Setup | Strong Zone of Confluence-Ascending TL breakout, retest expected
-0.5 fib retracement
-Minor resistance area
-50MA
📢 AUD/CAD Long Opportunity ahead 👍This pair is looking good for a long. Broken a major trend along with major structure. Waiting on a retest or price action for an entry now. It's on the watchlist 👀👀 This pair is on the watch list 👀👀👀 If you like the Analysis feel free to drop a like and leave comment and follow, we are grateful for all the love out there and we will share the love back 🤍

AUDCAD DISTRIBUTION, BREAK/RETEST AND PREPARATION FOR DECLINEAfter a 6 months advancement, AUDCAD might be brewing a decline. We see a distribution after the advancement, followed by a break of distribution range support, signaling end to distribution. Now price is back for a retest of support now turned resistance and the presence of 200MA at that same support turned resistance area further suggests possible additional strength that will hold price from going up. If however price happens to push back into the range, we can expect distribution to continue for a short while. If resistance holds and price reverses, we might be on time to catch the start of a new trend to the downside, and Christmas would come early for trend followers. Cheers!

AUD/CAD Daytrade-execution!! SHORTAUD/CAD Daytrade-execution!! SHORT
27/OCT
Market-Sell : 0.93930
Stop-loss : Close Break 0.94240
Target : 0.92100
note :
Our chart is simple as possible to make it easier for you to see the chart.
- This is an execution signal. you can enter the market now
Good luck 👍

AUDCADLooking at the above chart, its first supply zone is the only green candle in the downward move AUDCAD made from 0.9502 to 0.9253 and Price is. back to the strong level, and it is currently testing it. if the price gets rejected at this level, I would advise shorting to the recent low.
Also, using the wave count, it shows AC is about to start a wave 5 movement downwards. The black trendline shows there is a divergence between price and MACD, which marks the high of wave 2 and wave 4.
Please feel free to leave a comment and like if you agree


AUD/CAD New Analysis And 2 Setups Are Available AUD/CAD New Analysis And 2 Setups Are Available
1- A Buy Trade To Our Sell Zone
2- A Sell Trade To 0.92000
This is an educational + analytic content that will teach why and how to enter a trade
Make sure you watch the price action closely in each analysis as this is a very important part of our method
Disclaimer : this analysis can change at anytime without notice and it is only for the purpose of assisting traders to make independent investments decisions

AUDCAD | Short | H4 AUDCAD
Short Position
4 hour time line
----------------------------
Trade at your own risk


will it be Bearish!!!!???still waiting for another move towards the trend line above(daily and 4H Flag) and a Bounce on the horizontal line(and that area will be acting as our high confluence area)
we still need more confirmation before entering the trade but from my analysis this is what im still looking for....
have a Great week Guys....PINK...

AUDCAD exhibits series of bearish signAUDCAD
Is gradually declining within a downward channel and we can see the slowing of bullish momentum around 0.96500 and started its downward journey. After some minor fall another rising channel was formed and its collapsed towards 0.94000 and managed to reach around 0.96000.
For the past two days its in uptrend as the CAD is relatively weak against AUD AUDCAD managed to reach around 0.93500 level.
I am expecting AUDCAD will fall from 0.94000 level and will reach the 0.92000 area which is a key psychological level and lower trend line area
Give us a like if you found useful

SHORT Playlikejason.com team is placing a SELL tradeStop Loss 🚫: 0.93579
Take Profit #1 ✅: 0.93099
Take Profit #2 ✅: 0.92622
Take Profit #3 ✅: 0.91665

AUDCAD - Day trade signal by Keltner 19 DEC 2020Risk per trade: 1%.
---> How to the signal works in links below.

AUDCAD likely a SELL here. Good for 200 pipsLast Friday was probably the end of this major stop-hunt. It's potentially a safe SHORT here for ~200 pips - to the 0.93s. Don't fight it, though!

AUDCAD looking to SELL ~0.9600.One should be probably looking for a SHORT entry here on any bounce toward 0.9600. (... which may happen rather quickly here!)
