AUDCAD - SHORTMy first trade of the week, AUDCAD short.
price breaks of of a bearish flag, which is a continuation pattern, I'm expecting the price to continue dropping lower.
Audcadshort
AUDCAD Short TradeMARKET PHASE
OANDA:AUDCAD is in a long term downtrend (daily) with a short term corrective structure that has been taking place (4 hour).
AREA OF VALUE
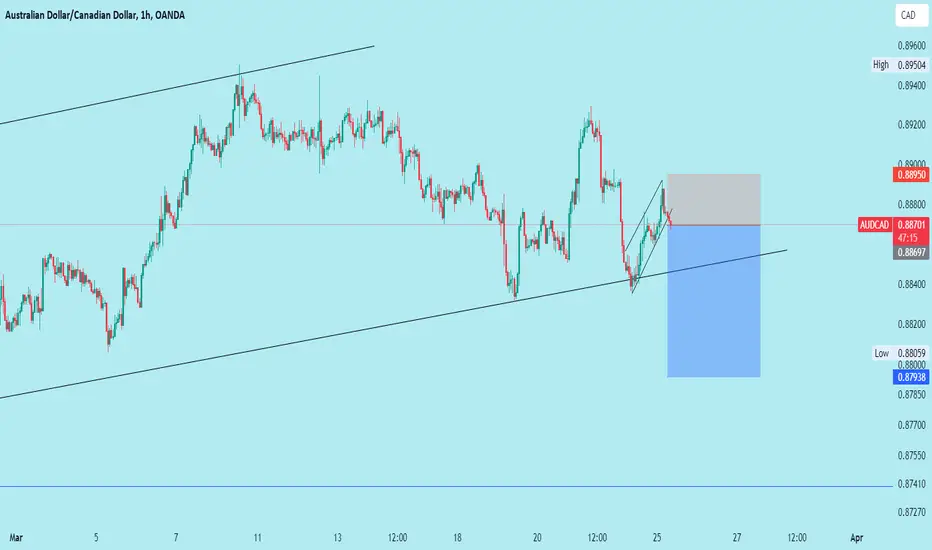
Price continued to break new highs within this corrective structure. Eventually, price reached an area where sellers stepped in, resulting in a buildup of liquidity (buy stops, longs, short stop losses) above the corrective structure swing highs. Price violently moved up to trigger the buy stops (liquidity) to pair against the sell orders needed to take price down. Price has already started it's initial move down, the velocity of the downward move caused a gap in price around 0.89169. Price retraced to this level, triggering our entry and has continued downwards.
TRADE
I will be entering short on OANDA:AUDCAD with the following parameters:
Sell Limit: 0.89169
Stop Loss: 0.89239
Take Profit: 0.88889

AUDCAD - Long active ✅Hello traders!
‼️ This is my perspective on AUDCAD.
Technical analysis: Here we are in a bullish market structure from 4H timeframe perspective, so I am looking for a long. I expect bullish price action from here as price filled the imbalance and rejected from bullish order block.
Fundamental news: On Thursday we will see results of Unemployment Rate on AUD, news with high impact on currency.
Like, comment and subscribe to be in touch with my content!

AUDCAD: Potential Bearish MomentumOn the hourly timeframe, AUDCAD is displaying indications of potential bearish momentum, characterized by lower highs and lower lows, suggesting a downward trend in price action.

AUDCAD - Long trade idea ✅Hello traders!
‼️ This is my perspective on AUDCAD.
Technical analysis: Here we are in a bullish market structure from 4H timeframe perspective, so I am looking for a long. I wait price to continue the retracement and my point interest for a long is if price rejects from trendline + bullish order block.
Like, comment and subscribe to be in touch with my content!

AUDCADAUDCAD is trading in descending channel and printing consistent LLs LHs. and it has also completed ABCD pattern at strong daily resistance level. Now buyers seems to be exhausted at resistance area and selling pressure seems to be activated.
If the sell momentum continues the 1st target could be 0.8800
What you guys think of this idea?

Breaking the Chains? Analyzing Channel Breakout for Shorting!Hello Traders,
We have A Channel Zone. If The Price Breached The Trend Line, Take Entry While Retested and Looking For Bearish Momentum As Showing By The Path Tool.
Please Note That The Only Purpose of The Information On This Page is Purely Educational.
I Would Welcome Your Participation And Support in the Form of Likes, Comments, And Follow us to Offer Some Encouragement.
Thank You.

AUDCADKeep an eye on 0.88300 zone if price presents and opportunity to sell, sell hard, but manage risk. Also keep an on 0.88386 zone too. For the counter-trend long, i already have a 5min confirmation entry. Cheers

AUDCADAnother sell opportunity for AUDCAD. Trail SL once it breaks below 0.88373 and lets follow price for this potential short till 0.88060. Cheers.

AUDCAD SELL | Trading AnalysisHello Traders, here is the full analysis.
I think we can soon see more fall from this range! GOOD LUCK! Great SELL opportunity AUDCAD
I still did my best and this is the most likely count for me at the moment.
Support the idea with like and follow my profile TO SEE MORE.
Traders, if you liked this idea or if you have your own opinion about it, write in the comments. I will be glad 🤝
Patience is the If You Have Any Question, Feel Free To Ask 🤗
Just follow chart with idea and analysis and when you are ready come in THE GROVE | VIP GROUP, earn more and safe, wait for the signal at the right moment and make money with us💰

AUD/ CAD !! 29/2/2024 Trendline DOWN, SELL now⭐️ Smart investment, Strong finance
⭐️ Personal comments NOVA:
Pay attention to the long-term DECREASE trendline, set up a SELL signal
⭐️ SET UP AUD/CAD PRICE:
🔥SELL zone:0.88450 - 0.88600 SL 0.89000
TP1: 0.88100
TP2: 0.87800
TP3: 0.87500
⭐️ Technical analysis:
Based on technical indicators EMA 34, EMA89 and support resistance areas to set up a reasonable SELL order.
⭐️ NOTE:
Note: Nova wishes traders to manage their capital well
- take the number of lots that match your capital
- Takeprofit equal to 4-6% of capital account
- Stoplose equal to 2-3% of capital account
- The winner is the one who sticks with the market the longest

AUD/CAD SELL STOP at .8850AUD/CAD is carving out a classic M-Top candle pattern at resisance so a break of the neckline at .8850 will be a confirmed SELL.
M-Tops and W-Bottoms are proof that you don't need indicators to trade.
Indicators obviously help and I use them - but you don't NEED them.
You'll be a successful trader if you just traded M-Tops and W-Bottoms.
These patterns are traditionally traded on a 1:1 ratio with the STOP taken from the neckline to the top of the pattern and the TAKE PROFIT at 1:1 so the STOP is .8879 and the TP is .8819.
As ever, these levels are not set in stone and you should always micro manage your trades and if you reach your take profit and the momentum is still with the position then adjust you TP accordingly.
Similalrly with STOPS. A STOP is not necessarliy a line in the sand that should not be crossed.
If price bounces but the overall structure is still in place then by all means squeeze the SL a bit higher rather than lose but be mindful that there MUST BE a line in the sand if price is continuing north and your're SHORT.
The old adage "let your winners run and shut down your losers early" is for ever true.

AUDCAD - Short active Hello traders!
‼️ This is my perspective on AUDCAD.
Technical analysis: Here we are in a bearish market structure from 4H timeframe perspective, so I am looking for short. I expect bearish price action from here as price took trendline liquidity and rejected from bearish order block + FIBO 0.786 level.
Like, comment and subscribe to be in touch with my content!

AUDCAD I Potential intraday short from top of the channel Welcome back! Let me know your thoughts in the comments!
** AUDCAD Analysis - Listen to video!
We recommend that you keep this pair on your watchlist and enter when the entry criteria of your strategy is met.
Please support this idea with a LIKE and COMMENT if you find it useful and Click "Follow" on our profile if you'd like these trade ideas delivered straight to your email in the future.
Thanks for your continued support!

AUDCAD Long setupI see a nice long setup on AUDCAD. Mid-term trend is changing and i expect a long till resistance zone at 0.89100

AUDCAD IS ON MAIN RESISTANCE..Hello traders i hope every one having a great profitable week...
AUDCAD is on main resistance on daily and on weekly price on last high that's make this resistance more value able. price also break trend continuation trendline on daily and price also showing sign of sell on lower time frame..
WHAT YOU THINK ABOUT THIS PAIR LET ME KNOW IN COMMENT..
.. good luck..

AUDCAD - SHORT & LONG ENTRY - 1H - Application of DOW TheoryAUDCAD Charts shows a Complex pattern in which it frequently changing trends after a small time interval. So it will be suggest to take two positions a small SHORT entry which will be hit in few hours or take LONG entry which will take more than 20 hours.
Hope this helps you.
Happy Trading

AUDCAD Short IdeaHey guys! Its your girl Forex Potatoes. We have a signal for AUDCAD, currently we can see that audcad has been in a consistent downtrend for a long time and we can see a third touch and divergence on 30 mins time frame.
Confluences:
Downtrend on 4H downtrend,1H downtrend and 30mins Downtrend
RSI: Currently overbought
4H Bearish engulfing candlestick, 30 Mins and 1HR candlestick
Price below 50EMA

AUDCAD - Potential short ✅Hello traders!
‼️ This is my perspective on AUDCAD.
Technical analysis: Here we are in a bearish market structure from 4H timeframe perspective, so I am looking for short. I want price to continue the retracement to fulfill the imbalance higher and then to reject from bearish order block.
Fundamental news: On Friday we will see results of Unemployment Rate on CAD.
Like, comment and subscribe to be in touch with my content!

AUDCAD Trade IdeaThe AUDCAD pair has reached a critical support level, marked by this horizontal line on our chart that corresponds to a previous daily open/close. The price is clearly overextended and we expect a correction soon. A potential trade setup may arise later today when the Canadian GDP data is announced. If the data is positive for the CAD, this could offer a good sell opportunity. We are eagerly awaiting this news release. Please note that this is only a trade idea and not a trade recommendation, the information is for educational purposes only and should not be considered as financial advice.

AUDCAD H1 / Expecting a Strong Bullish Move 💲📈 Hello Traders!
This is my forecast for AUDCAD H1. I expect a bullish move on H1 if the retracement will be valid. I expect a rise until the OB around the price of 0.89700.
Traders, if you liked my idea or if you have a different vision related to this trade, write in the comments. I will be glad to see your perspective.
____________________________________
Follow, like, and comment to see my content:
www.tradingview.com

AUDCAD turn bearish As you can see clearly the price was moving in a bullish momentum, then began to forming a double top pattern, then broke out the support zone and returning to test it, currently we are starting to see reactions from sellers, so I expect a decrease in the price of the Australian dollar against the Canadian dollar.

AudCad changing trend soon.Looking for Impulse Down.
AudCad will start to move down soon. AudCad cleared stops and made a displacement to move down. Make sure you have your own rules on RR and follow them. This is just a trading idea to help you gain better knowledge. If you have any question ask me in comments.
Learn & Earn!
Wave Trader Pro
