Audcadsignal

AUDCAD Preparation!!! SHORT
Entry Sell-Stop , 0.95450
Stop-Loss, 0.95750
Target
R1, 0.95150
R2, 0.94850
R3, 0.94550
SL-30pips
Risk1%


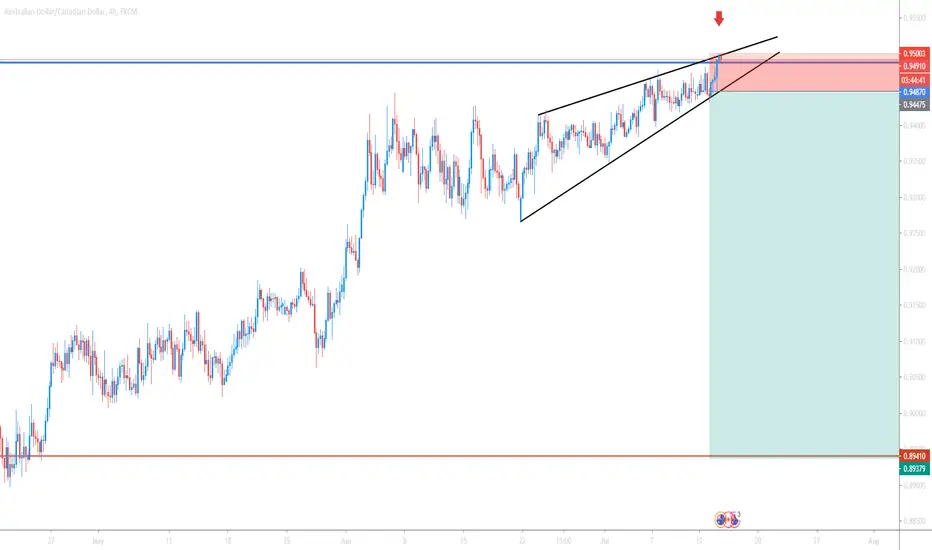
AUDCAD It will go to the rising trend line +180 PipsWelcome Back.
Please support this idea with LIKE if you find it useful.
***
It may head to the downside to retest the rising trend line, in case the trend is not broken, it will head to the upside and greater resistance will form than the previous one.
***
Here is the full analysis for this pair, let me know in the comment section below if you have any questions, the entry will be taken only if all rules of the strategies will be satisfied. I suggest you keep this pair on your watchlist and see if the rules of your strategy are satisfied.
Remember this analysis is not 100% accurate No single analysis is To make a decision follow your own thoughts.
***
The information given is not a Financial Advice.

AUD/CAD Daytrade-execution!! SHORTAUD/CAD Daytrade-execution!! SHORT
27/OCT
Market-Sell : 0.93930
Stop-loss : Close Break 0.94240
Target : 0.92100
note :
Our chart is simple as possible to make it easier for you to see the chart.
- This is an execution signal. you can enter the market now
Good luck 👍

AUDCAD ideia-The ideia here is to wait for a pullback into the 50% fib area in the 1h candle (around 0.93070). At that point, we can enter in a long position with at takeprofit at 0.9415 and SL 0.92795.
-Since it will probabliy take a few hours, we can leave a buy limit around 0.93070
- For the more conservative people, you can wait for a confirmation candle.
(Analysing the 1d, 4h and 1h candle)

SHORT Playlikejason.com team is placing a SELL tradeStop Loss 🚫: 0.93579
Take Profit #1 ✅: 0.93099
Take Profit #2 ✅: 0.92622
Take Profit #3 ✅: 0.91665


AUDCAD - Weekly - SELL; This is now a Long-term (heavy!!) SHORT.Check for the SHORT Entry then ride it down hard, like a rented mule!

AUDCAD SELL ON DIPS !!!as we see this pair has made a cup shape on 30 min TF
and it had done a fake breakout on 4H TF
a strong resistance has tested and fail to break so we are selling on dip is for big rewards with a small risk
we need your support to get delivered some great analysis to help all other traders so keep supporting us and
follow for more updates on all trades

AUDCAD / SHORTPrice has broken out of its daily trendline and is now going to retest
Waiting for a true pullback before shorting this pair

AUD/CAD Technical Analysis
The counter is currently trading around a strong resistance zone that triggered a sell-off previously.
According to the wave, it has now completed the ABC correction for the down move it made.
Further, the entire setup looks like a head and shoulder in the higher timeframes.
Hence, we expect the pair to move down from here.


AUDCAD heading towards 52 week high AUDCAD
The recent risk rally helps the Aussie dollar to gain some strength against its counterpart Lonnie
From August 24 this pair is trading in uptrend and reached the current monthly high of 0.96511
The uncertainty in oil prices also weighing in CAD pairs and it's lose some gain against the strong risk proxy currency which is Aussie dollar
After completion of Elliott correction wave 03 which is a current monthly low- 0.94197 this pair went bullish
And trading above all the 50,100,200 Exponential moving average will further attract the buyers until 0.9700 which is a 52 week high and a major resistance zone And a supply zone
The current monthly high-0.96511 which is a third wave of Elliot principal
We can open suitable buy orders at 50% Fibonacci retracement level of third wave which is 0.95588. And a completion of fourth wave
Potential take profit will be 0.96964 which is the level expected to be a end of 5th Elliott wave
We have to see the bullish engulfing or rejection at 0.94600 level to buy this pair and descending channel got broken on August 26 which is a clear sign of bullish Trend
Positive risk appetite will make this pair as more bullish, Have a eye on corona vaccine development and a relationship between USA and China
Important key levels
Previous week low - 0.94661
Previous week high - 0.96511
Monthly high - 0.96511
Monthly low - 0.94611
52 week high - 0.96964

AUD/CAD W Pattern on Daily TF Hello Traders,
Buyers may enter into action near 0.618 fibonacci after the formation of a W pattern with 0.38 level testing partially failed going to look for a good support. Open position and take profit are shown on the chart ( green lines )
If you agree with my ideas put a like and feel free leave a comment to link your trading ideas.
Follow me for weekly analysis of swing trading support/resistance , fibonacci retracements, COT data.
For informations feel free to contact me.
Thanks for your support and let me know what you think!
My analysis are for educational purposes only, and in no way represent a solicitation to invest in the financial markets. Compare them with yours and make a decision.

AUD/CAD SHORT SET UP (1Month TF/1Week TF/8Hour TF)AUD/CAD SHORT SET UP ON (1Month TimeFrame/1Week TimeFrame/8Hour TimeFrame)
SIGNAL BELOW
TITLE/(DATE)- AUD/CAD
ASSET- Forex
PLATFORM- MT4
ORDER TYPE- SELL LIMIT
Time Frame- 4hr
ENTRY PRICE 1- 0.95980 (pending)
ENTRY 2- 0.96260 (pending)
STOP LOSS- 0.96480 (50PIPS)
TAKE PROFIT 1- 0.95480 (50 PIPS)
TAKE PROFIT 2- 0.94980 (100 PIPS)
TAKE PROFIT 3- 0.94480 (150 PIPS)
TAKE PROFIT 4- 0.93980 (200 PIPS)
STATUS: Pending


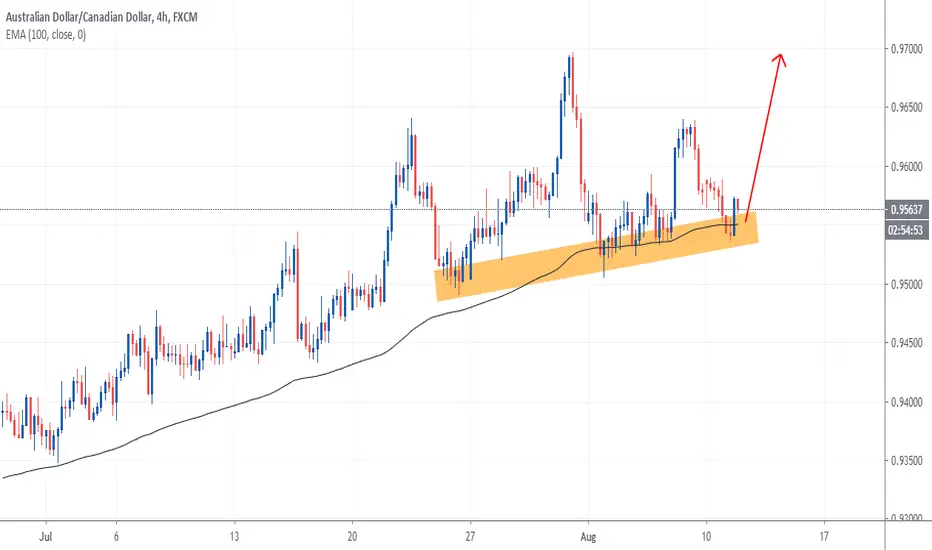
Buy the dip in AUDCADAUDCAD is consolidating for the last few days. However, the uptrend is still intact. The recent pullback is just a small correction in my opinion.
I have already bought AUDCAD and will be buying again if it drops to 0.9550 level. TP for this trade would be 0.97 and SL will be placed below 0.95
AUDCAD FORECAST 4HRGOOD LUCK
-----------------------
Disclaimer: Forex trading and trading in other leveraged products involves a significant level of risk and is not suitable for all investors.

AUDCAD TRADE IDEAAUDCAD - Nothing major on this one at the moment. Will be waiting for a break to the downside of the corrective structure, and support (yellow zone) before entering anything here.

BEARISH FLAG - WATCH FOR THISHUGE potential drop incoming - I see 4HR and daily divergence as well as price reaching a key level
Waiting for the dump