AUDCHF LongAUDCHF long trade:Buying stop,covering Buys where other set their stops.
2 approches, Proft targets are the same
AUDCHF

AUDCHF: Long Trade with Entry/SL/TP
AUDCHF
- Classic bullish setup
- Our team expects bullish continuation
SUGGESTED TRADE:
Swing Trade
Long AUDCHF
Entry Point - 0.5536
Stop Loss - 0.5514
Take Profit - 0.5578
Our Risk - 1%
Start protection of your profits from lower levels
Disclosure: I am part of Trade Nation's Influencer program and receive a monthly fee for using their TradingView charts in my analysis.
❤️ Please, support our work with like & comment! ❤️

Bearish reversal?AUD/CHF is rising towards the resistance level which is a pullback resistance that aligns with the 61.8% Fibonacci retracement and could reverse from this level to our take profit.
Entry: 0.5602
Why we like it:
There is a pullback resistance level that aligns with the 61.8% Fibonacci retracement.
Stop loss: 0.5626
Why we like it:
There is a pullback resistance level.
Take profit: 0.5545
Why we like it:
There is a pullback support level.
Enjoying your TradingView experience? Review us!
Please be advised that the information presented on TradingView is provided to Vantage (‘Vantage Global Limited’, ‘we’) by a third-party provider (‘Everest Fortune Group’). Please be reminded that you are solely responsible for the trading decisions on your account. There is a very high degree of risk involved in trading. Any information and/or content is intended entirely for research, educational and informational purposes only and does not constitute investment or consultation advice or investment strategy. The information is not tailored to the investment needs of any specific person and therefore does not involve a consideration of any of the investment objectives, financial situation or needs of any viewer that may receive it. Kindly also note that past performance is not a reliable indicator of future results. Actual results may differ materially from those anticipated in forward-looking or past performance statements. We assume no liability as to the accuracy or completeness of any of the information and/or content provided herein and the Company cannot be held responsible for any omission, mistake nor for any loss or damage including without limitation to any loss of profit which may arise from reliance on any information supplied by Everest Fortune Group.

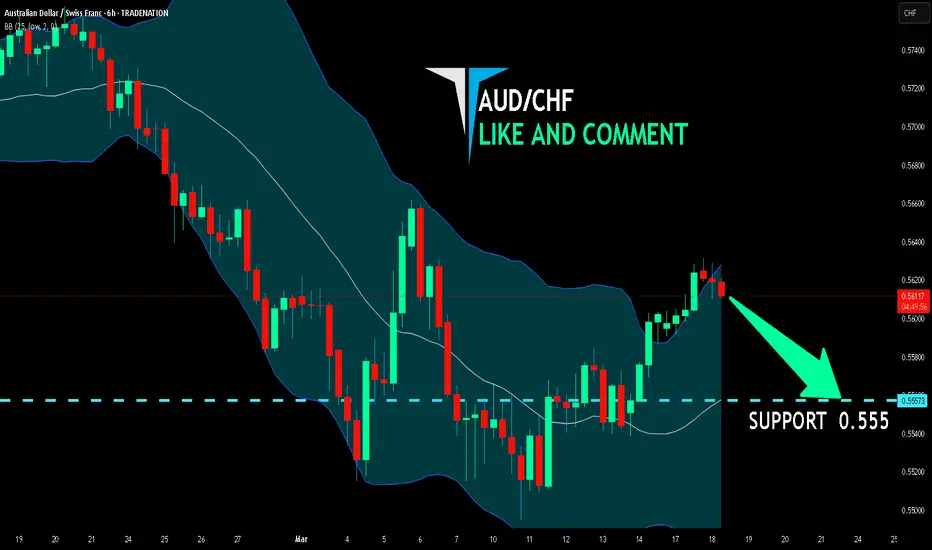
AUD/CHF SELLERS WILL DOMINATE THE MARKET|SHORT
Hello, Friends!
AUD/CHF pair is in the uptrend because previous week’s candle is green, while the price is obviously rising on the 6H timeframe. And after the retest of the resistance line above I believe we will see a move down towards the target below at 0.555 because the pair overbought due to its proximity to the upper BB band and a bearish correction is likely.
Disclosure: I am part of Trade Nation's Influencer program and receive a monthly fee for using their TradingView charts in my analysis.
✅LIKE AND COMMENT MY IDEAS✅
Bullish bounce?AUD/CHF is reacting off the pivot and could bounce to the 1st resistance.
Pivot: 0.55755
1st Support: 0.55314
1st Resistance: 0.56322
Risk Warning:
Trading Forex and CFDs carries a high level of risk to your capital and you should only trade with money you can afford to lose. Trading Forex and CFDs may not be suitable for all investors, so please ensure that you fully understand the risks involved and seek independent advice if necessary.
Disclaimer:
The above opinions given constitute general market commentary, and do not constitute the opinion or advice of IC Markets or any form of personal or investment advice.
Any opinions, news, research, analyses, prices, other information, or links to third-party sites contained on this website are provided on an "as-is" basis, are intended only to be informative, is not an advice nor a recommendation, nor research, or a record of our trading prices, or an offer of, or solicitation for a transaction in any financial instrument and thus should not be treated as such. The information provided does not involve any specific investment objectives, financial situation and needs of any specific person who may receive it. Please be aware, that past performance is not a reliable indicator of future performance and/or results. Past Performance or Forward-looking scenarios based upon the reasonable beliefs of the third-party provider are not a guarantee of future performance. Actual results may differ materially from those anticipated in forward-looking or past performance statements. IC Markets makes no representation or warranty and assumes no liability as to the accuracy or completeness of the information provided, nor any loss arising from any investment based on a recommendation, forecast or any information supplied by any third-party.

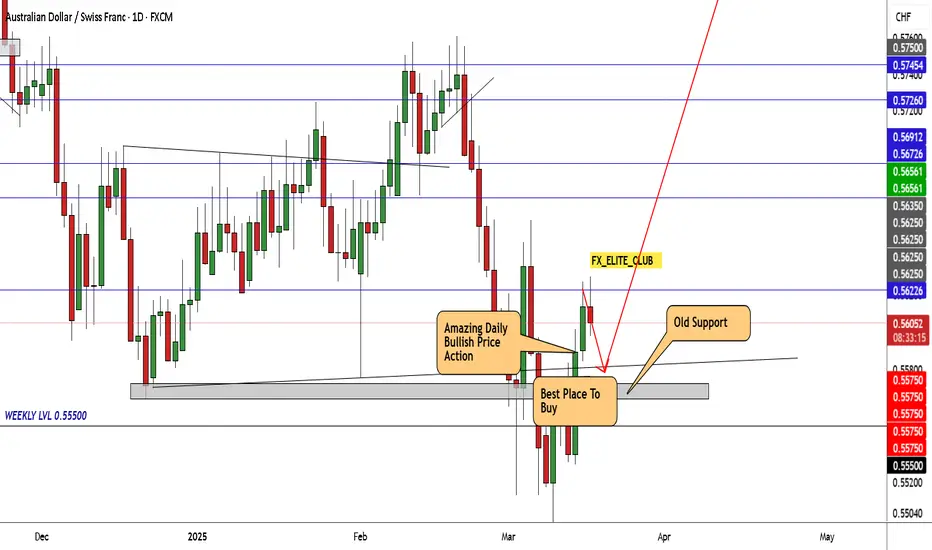
AUD/CHF Ready To Go Up , Don`t Miss This 250 Pips !Here is my chart on AUD/CHF , As we see the price back above our old support again and giving amazing bullish price action on all timeframes , so i decided to buy it from my support and i`m targeting 250 pips target .
This Is An Educational + Analytic Content That Will Teach Why And How To Enter A Trade
Make Sure You Watch The Price Action Closely In Each Analysis As This Is A Very Important Part Of Our Method
Disclaimer : This Analysis Can Change At Anytime Without Notice And It Is Only For The Purpose Of Assisting Traders To Make Independent Investments Decisions.
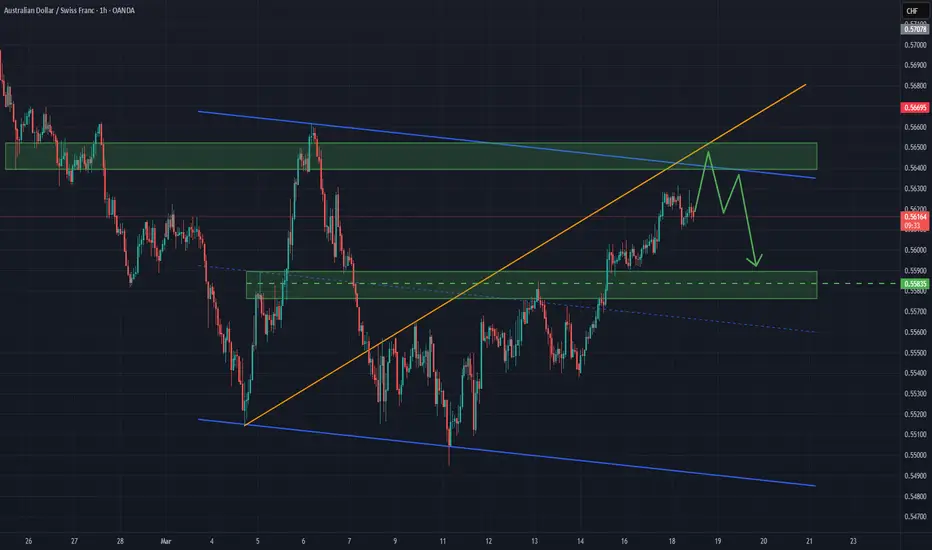
AUD/CHF: Consolidation Within a Defined RangeThe AUD/CHF pair continues to oscillate within a range between 0.56550 and 0.55000, recently reaching the upper boundary. Following a rebound from the support level, the price has developed an ABC move, which often precedes a pullback.
Currently, the market has approached the upper boundary of the channel and trendline, a level where price has previously faced rejection twice. Given the ongoing consolidation, there is a possibility of another rejection at resistance, potentially leading to a downward move while the sideways trend persists. The next key target is the support zone around 0.55835
Overlap resistance ahead?AUD/CHF is rising towards the pivot which is an overlap resistance and could reverse to the 1st support.
Pivot: 0.56541
1st Support: 0.55863
1st Resistance: 0.57011
Risk Warning:
Trading Forex and CFDs carries a high level of risk to your capital and you should only trade with money you can afford to lose. Trading Forex and CFDs may not be suitable for all investors, so please ensure that you fully understand the risks involved and seek independent advice if necessary.
Disclaimer:
The above opinions given constitute general market commentary, and do not constitute the opinion or advice of IC Markets or any form of personal or investment advice.
Any opinions, news, research, analyses, prices, other information, or links to third-party sites contained on this website are provided on an "as-is" basis, are intended only to be informative, is not an advice nor a recommendation, nor research, or a record of our trading prices, or an offer of, or solicitation for a transaction in any financial instrument and thus should not be treated as such. The information provided does not involve any specific investment objectives, financial situation and needs of any specific person who may receive it. Please be aware, that past performance is not a reliable indicator of future performance and/or results. Past Performance or Forward-looking scenarios based upon the reasonable beliefs of the third-party provider are not a guarantee of future performance. Actual results may differ materially from those anticipated in forward-looking or past performance statements. IC Markets makes no representation or warranty and assumes no liability as to the accuracy or completeness of the information provided, nor any loss arising from any investment based on a recommendation, forecast or any information supplied by any third-party.

Bearish reversal?AUD/CHF is rising towards the resistance level which is an overlap resistance and could reverse from this level to our take profit.
Entry: 0.5654
Why we like it:
There is an overlap resistance level.
Stop loss: 0.5682
Why we like it:
There is a pullback resistance level.
Take profit: 0.5586
Why we like it:
There is a pullback support level.
Enjoying your TradingView experience? Review us!
Please be advised that the information presented on TradingView is provided to Vantage (‘Vantage Global Limited’, ‘we’) by a third-party provider (‘Everest Fortune Group’). Please be reminded that you are solely responsible for the trading decisions on your account. There is a very high degree of risk involved in trading. Any information and/or content is intended entirely for research, educational and informational purposes only and does not constitute investment or consultation advice or investment strategy. The information is not tailored to the investment needs of any specific person and therefore does not involve a consideration of any of the investment objectives, financial situation or needs of any viewer that may receive it. Kindly also note that past performance is not a reliable indicator of future results. Actual results may differ materially from those anticipated in forward-looking or past performance statements. We assume no liability as to the accuracy or completeness of any of the information and/or content provided herein and the Company cannot be held responsible for any omission, mistake nor for any loss or damage including without limitation to any loss of profit which may arise from reliance on any information supplied by Everest Fortune Group.

AUD-CHF Move Up Expected! Buy!
Hello,Traders!
AUD-CHF made a bullish
Breakout of the key horizontal
Level of 0.5576 and the
Breakout is confirmed
Because the daily candle
Closed above the key level
So on the market open
We will be expecting a
Local pullback and then
A strong move up
Buy!
Comment and subscribe to help us grow!
Check out other forecasts below too!
Disclosure: I am part of Trade Nation's Influencer program and receive a monthly fee for using their TradingView charts in my analysis.

AUD_CHF WILL GROW|LONG|
✅AUD_CHF is going up now
And the pair made a a bullish
Breakout of the key horizontal
Level of 0.5580 and the breakout
Is confirmed so we are bullish biased
And we will be expecting a
Further bullish move up
LONG🚀
✅Like and subscribe to never miss a new idea!✅

Bullish bounce?AUD/CHF is falling towards the pivot and could bounce to the 1st resistance.
Pivot: 0.55517
1st Support: 0.55053
1st Resistance: 0.56177
Risk Warning:
Trading Forex and CFDs carries a high level of risk to your capital and you should only trade with money you can afford to lose. Trading Forex and CFDs may not be suitable for all investors, so please ensure that you fully understand the risks involved and seek independent advice if necessary.
Disclaimer:
The above opinions given constitute general market commentary, and do not constitute the opinion or advice of IC Markets or any form of personal or investment advice.
Any opinions, news, research, analyses, prices, other information, or links to third-party sites contained on this website are provided on an "as-is" basis, are intended only to be informative, is not an advice nor a recommendation, nor research, or a record of our trading prices, or an offer of, or solicitation for a transaction in any financial instrument and thus should not be treated as such. The information provided does not involve any specific investment objectives, financial situation and needs of any specific person who may receive it. Please be aware, that past performance is not a reliable indicator of future performance and/or results. Past Performance or Forward-looking scenarios based upon the reasonable beliefs of the third-party provider are not a guarantee of future performance. Actual results may differ materially from those anticipated in forward-looking or past performance statements. IC Markets makes no representation or warranty and assumes no liability as to the accuracy or completeness of the information provided, nor any loss arising from any investment based on a recommendation, forecast or any information supplied by any third-party.

AUD-CHF Local Long! Buy!
Hello,Traders!
AUD-CHF went down and
The pair made a retest of the
Horizontal support level
Of 0.5514 from where
We are already seeing a
Bullish rebound and we
Will be expecting a local
Bullish rebound
Buy!
Comment and subscribe to help us grow!
Check out other forecasts below too!
Disclosure: I am part of Trade Nation's Influencer program and receive a monthly fee for using their TradingView charts in my analysis.

AUDCHF: Long Trade Explained
AUDCHF
- Classic bullish formation
- Our team expects growth
SUGGESTED TRADE:
Swing Trade
Buy AUDCHF
Entry Level - 0.5542
Sl - 0.5503
Tp - 0.5628
Our Risk - 1%
Start protection of your profits from lower levels
❤️ Please, support our work with like & comment! ❤️

AUD/CHF BULLS WILL DOMINATE THE MARKET|LONG
Hello, Friends!
AUD/CHF pair is in the downtrend because previous week’s candle is red, while the price is clearly falling on the 1H timeframe. And after the retest of the support line below I believe we will see a move up towards the target above at 0.557 because the pair oversold due to its proximity to the lower BB band and a bullish correction is likely.
✅LIKE AND COMMENT MY IDEAS✅

AUD/CAD’s Breakout Watch: Targeting 0.91431 & 0.91822
AUD/CAD has been consolidating beneath the 0.90900 resistance—also forming a “double top” region on the chart. A solid break above 0.90900 could confirm a bullish breakout, supported by rising trendline structure and Fibonacci retracements (notably around 0.9058–0.9025). If buyers sustain momentum above this breakout zone, look for a move toward Expect Level 1 at 0.91431 (1.618 Fib extension), and potentially Expect Level 2 at 0.91822 (2.0 Fib extension). Should price fail to hold the breakout, however, the broader downtrend and consolidation could resume.

Bullish rise?AUD/CHF has reacted off the pivot which acts as a pullback resistance and could potentially rise to the 1st resistance which has been identified as an overlap resistance.
Pivot: 0.5618
1st Support: 0.5577
1st Resistance: 0.5680
Risk Warning:
Trading Forex and CFDs carries a high level of risk to your capital and you should only trade with money you can afford to lose. Trading Forex and CFDs may not be suitable for all investors, so please ensure that you fully understand the risks involved and seek independent advice if necessary.
Disclaimer:
The above opinions given constitute general market commentary, and do not constitute the opinion or advice of IC Markets or any form of personal or investment advice.
Any opinions, news, research, analyses, prices, other information, or links to third-party sites contained on this website are provided on an "as-is" basis, are intended only to be informative, is not an advice nor a recommendation, nor research, or a record of our trading prices, or an offer of, or solicitation for a transaction in any financial instrument and thus should not be treated as such. The information provided does not involve any specific investment objectives, financial situation and needs of any specific person who may receive it. Please be aware, that past performance is not a reliable indicator of future performance and/or results. Past Performance or Forward-looking scenarios based upon the reasonable beliefs of the third-party provider are not a guarantee of future performance. Actual results may differ materially from those anticipated in forward-looking or past performance statements. IC Markets makes no representation or warranty and assumes no liability as to the accuracy or completeness of the information provided, nor any loss arising from any investment based on a recommendation, forecast or any information supplied by any third-party.

Bullish rise?AUD/CHF has reacted off the resistance level level which is a pullback resistance and could rise from this level to our take profit.
Entry: 0.5616
Why we like it:
There is a pullback resistance level.
Stop loss: 0.5581
Why we like it:
There os a pullback support level.
Take profit: 0.5679
Why we like it:
There is an overlap resistance level that is slightly above the 61.8% Fibonacci retracement.
Enjoying your TradingView experience? Review us!
Please be advised that the information presented on TradingView is provided to Vantage (‘Vantage Global Limited’, ‘we’) by a third-party provider (‘Everest Fortune Group’). Please be reminded that you are solely responsible for the trading decisions on your account. There is a very high degree of risk involved in trading. Any information and/or content is intended entirely for research, educational and informational purposes only and does not constitute investment or consultation advice or investment strategy. The information is not tailored to the investment needs of any specific person and therefore does not involve a consideration of any of the investment objectives, financial situation or needs of any viewer that may receive it. Kindly also note that past performance is not a reliable indicator of future results. Actual results may differ materially from those anticipated in forward-looking or past performance statements. We assume no liability as to the accuracy or completeness of any of the information and/or content provided herein and the Company cannot be held responsible for any omission, mistake nor for any loss or damage including without limitation to any loss of profit which may arise from reliance on any information supplied by Everest Fortune Group.

AUDCHF: Bearish continuation - Will it reach 0.55190?OANDA:AUDCHF is trading within a well-defined descending channel, with price action respecting both the upper and lower boundaries. The recent rejection from the resistance zone suggests sellers are maintaining control, supporting a potential continuation of the downtrend.
As long as the price remains below the resistance level and the channel's upper boundary holds, the bearish structure remains intact.
A potential downside target is 0.55190, aligning with the lower boundary of the channel. A break and close below this level could signal further bearish momentum.
However, a breakout above the resistance zone would invalidate the bearish scenario and may indicate a potential reversal or deeper pullback.
Always confirm your setups and trade with solid risk management.
Best of luck!

AUDCHF Long From SupportHello Traders
In This Chart AUDCHF 4 HOURLY Forex Forecast By FOREX PLANET
today AUDCHF analysis 👆
🟢This Chart includes AUDCHF market update)
🟢What is The Next Opportunity on AUDCHF Market
🟢how to Enter to the Valid Entry With Assurance Profit
This CHART is For Trader's that Want to Improve Their Technical Analysis Skills and Their Trading By Understanding How To Analyze The Market Using Multiple Timeframes and Understanding The Bigger Picture on the Charts

AUD/CHF BULLS WILL DOMINATE THE MARKET|LONG
Hello, Friends!
AUD/CHF is making a bearish pullback on the 1D TF and is nearing the support line below while we are generally bullish biased on the pair due to our previous 1W candle analysis, thus making a trend-following long a good option for us with the target being the 0.566 level.
✅LIKE AND COMMENT MY IDEAS✅

AUD_CHF POTENTIAL LONG|
✅AUD_CHF is set to retest a
Strong support level below at 0.5570
After trading in a local downtrend from some time
Which makes a bullish rebound a likely scenario
With the target being a local resistance above at 0.5624
LONG🚀
✅Like and subscribe to never miss a new idea!✅

AUDCHF: Bulls Will Push Higher
Looking at the chart of AUDCHF right now we are seeing some interesting price action on the lower timeframes. Thus a local move up seems to be quite likely.
❤️ Please, support our work with like & comment! ❤️
