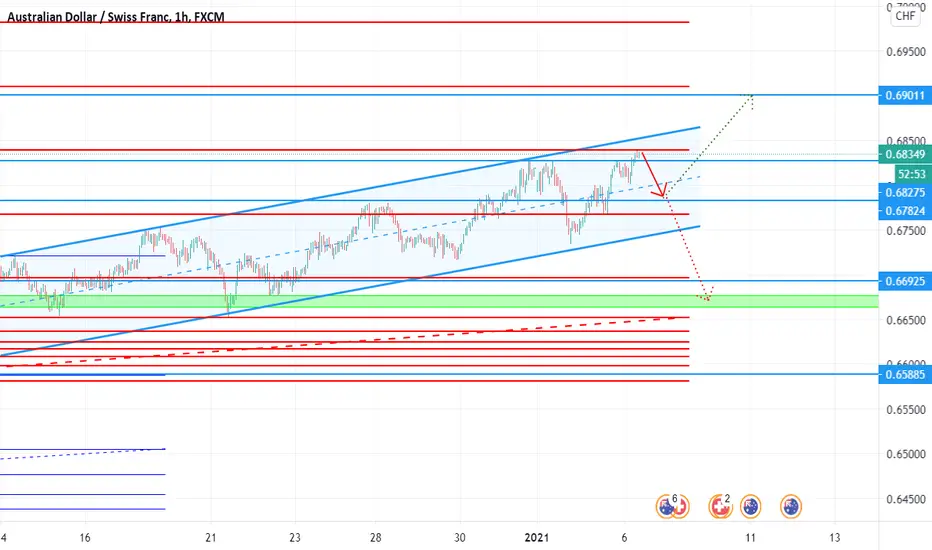
AUDCHF BEARS COMMING`As we can see AUD against CHF standing near its Neckline and support. So we can imagine an H&S pattern and 3 times HIGHER HIGH and divergence in between PRICE AND RSI.
1st view. If we enter in 2nd shoulder so our SL can be 0.68868. But we are suggesting to use SL little big so we can follow both view.
2nd view. If we expect an other high so we will follow 2nd view risk reward ratio with smalest SL and biggest TP
Audchfanalysis


AUDCHF IS GOING BACK TO THE RESITANCE ZONEAs you can see here, AUDCHF reached a major support, and it's more likely to bounce back to the previous resitance.
Trend : Up
Signals : Price Action & Volume

AUDCHF- Sell Short to Mid Time Entry 📌««««««Notice & Disclaimer»»»»»🔖
⭐️Must Be Follow Money Management. which means Must Be follow maximum 3% risk in your Account Balance.
⭐️When your entry hits the first TP profit, you will try to get out of the market. And if you wait for the another of taking Profit, then you will give your stop loss break even.
then wait for 2nd and 3rd TP.
⭐️All Analysis and Signal Only my opinion using my own Experience and Strategy. so, Trade your own Risk.
Thank you 😊
All Credit Rapid_Trading LTD

Bearish Crab PatternAUDCHF BEARISH CRAB PATTERN
Market Sell Order Set Up.
Sell Entry: (0.68719)
Take-Profit 1: (0.68350)
Take-Profit 2: (0.67968)
Stop-Loss: (0.69100)
Max Risk-Reward: (1.97)
Leave a Like and Comment, I appreciate every support. Goodluck.


AUDCHF: 361.8% Fibonacci Level Tested...BEARISH RetracementPrice level managed to reach 361.8% level. I am expecting resistance level @0.6828 to hold. As of now, I am seeing a retracement opportunity to the support level @0.6782. A rejection or a breakout from there will determine the direction for this pair. A rejection off this support level will show us a BULLISH continuation to test 461.8% level while a breakout could signal a potential movement back to a strong supply zone.
Kindly hit the LIKE Button if you agree with my analysis and feel free to COMMENT your idea below. As for those who are keen to get daily updates and analysis from me feel free to FOLLOW me. Cheers and Happy Trading!!

AUDCHF Sell SetupTrend: Downtrend
Key Level: 0.67000
Entry signal: Waiting for price to pullback to previous key level and show bullish price action before taking shorts


AUDCHF Trade IdeaSame as AUDCAD, we broke a daily resistance, if we now come back to test around 0.67100 and confirm that this level holds as now support, i will enter a long position


AUDCHF BUYAUDCHF 4H timeframe analysis, the market structure is currently ranging so i'm expecting it to buy at support right now for +80 PIPs, but i'm waiting for price action signal and other confirmations before i buy it.

AUDCHF Bullish Momentum SwitchAUDCHF has just broke support and ascending trendline indicating that bullish momentum has switched. I'll be looking for a pullback to this previous level of support to see if this market can retest this level as new found resistance.
Target 1: 0.66000
Target 2: 0.65000


AUDCHF Buy LimitAUDCHF created a new HH and has pulled back to the 61.8 fib level that lines up with the most previously broken structure (The previous high) Price is now showing signs of small rejection, H4 is currently respecting this area as support. Previous H1 candle has broken previous resistance and created a HH. Limit order placed at the previously broken resistance.

AUD/CHF Wave Analysis
The counter has been in a 5-wave bull cycle.
Now, it is in the wave 4 phase which results in a bearish correction.
Hence, we expect the pair to be bearish in the near-term.

Respected Daily trend line and bulls lose control.As you can see, the daily trendline was restpected well for the third time creating multiple tops and rejection. also we broke our 4HR trendline. bulls are losing control and bears are taking over.
Do you like this analisys? Give me a like please.
I wish everyone a great trading week!

AUDCHF Top-Down AnalysisHello Traders,
Here is the Top-Down Analysis of AUDCHF (Monthly, Weekly, Daily for direction and 4H for entry) for
Week 48 - Nov 23
M > Price reached monthly resistance level again, 5 times in last 6 months.
W > In its bullish move price is losing momentum while filling-in the wick of last weekly candle. We can see bearish divergence and expect a price drop however price can continue to fill-in weekly candle again.
D > We can see deceleration with price closing the candle with rejection to the downside.
As per COT AUD saw further closure of Long and closure of Short, reducing net positions (now in -ve). We can see closure of Long and addition of Short in last couple of months, making net positions move from 16K to -08K. AXY weakened during the said period but recovered slightly last week. CHF saw closure of both Long and Short, reducing net positions. SXY weakened during the said period however recovered slightly last week. AUD is weakening and continuation of its weakness can push price to the downside.
4H > Price is decelerating in a symmetric triangle and a break to the downside will provide bearish reversal confirmation.
Pair Correlation > AUDCHF has positive correlation with AUDCAD, AUDUSD and AUDJPY and negative correlation with EURAUD.
This was my Idea and I hope you find it useful. If you find the analysis of help please leave a LIKE and FOLLOW for receiving all updates during the week. In the comment section share your view or ask questions.
Thank You
AP17FX

SELL SELL SELLHello Team, WE HAVE A DOUBLE TOP FORMATION. IF YOU MISSED THE FIRST ENTRY AT THE SECOND LEG OF THE M.
i would advice you wait for the break and retest.

Is AudChf Buy signal Ready?Hello Traders, Could AudChf be making a low? I think so......I will update the idea if necessary. Ask any questions in the comment section. Remember to buy low and sell high. Thank you.
