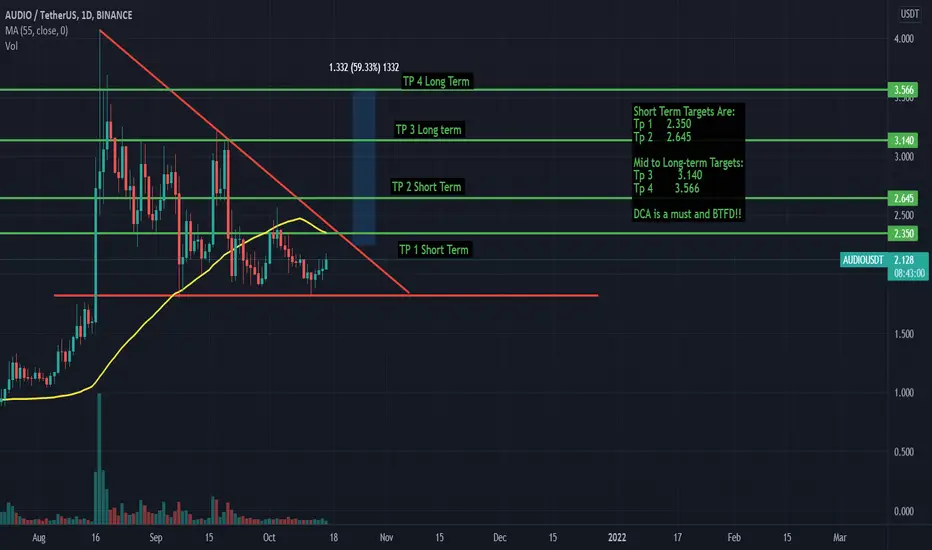
AUDIO preparing for Move. Short Term Targets Are:
Tp 1 2.350
Tp 2 2.645
Mid to Long-term Targets:
Tp 3 3.140
Tp 4 3.566
DCA is a must and BTFD!!
Audio

AUDIO/USDT-Bullish case.
*Please share your opinion on it, write in the comments.
Dont forget some cheers bravo. Teşekkürler.

flip $2.80 level and we're seeing $4 super quickbeen in audio since $2.13, now looking to make a break to $4

Audio can rise up to $3.7 (then new ATHs)Spotify's Market Cap is currently $56.23B. While for Audius is just $1.3B.
What do you think!?

AUDIO: I like my cup and handle hot and steamy ☕️The cup and handle pattern is pretty obvious in this chart. It probably doesn’t get any better than this.
pbs.twimg.com

AUDIO ON THE WAY TO MOONHello To Trader Community , Hope you are Doing Well
As I see in this Chart , After 3 month RSI Near to Breakout the The 70% Level and if you back in time you see everytime this happend AUDIO EXPLODED
SO WE HAVE STRONG RESISTANCE IN 3-3.14 if this Resistane Break we Can See The TARGET 3.44
Its Not Financial Advice , Please Share Your Opinion

AUDIUS TARGETS!TARGET $3.60
I have been watching Audius side by side with top 10 crypto over the last few days, and I'm seeing significant strength in the project and great momentum. Every dip has been bought up very aggressively.
I entered at $2.51. I believe if you can enter around $2.7 this is pretty valuable.
This project can make a name for itself in the music industry.
I believe it is wise to own crypto where people work for revenue from the platform, as artists. This is a bright project.

AUDIOUSDT Daily TimeframeSNIPER STRATEGY (new version)
It works ALMOST ON ANY CHART.
It produces Weak, Medium and Strong signals based on consisting elements.
NOT ALL TARGETS CAN BE ACHIEVED, let's make that clear.
TARGETS OR ENTRY PRICES ARE STRONG SUPPORT AND RESISTANCE LEVELS SO THEY CAN ACT LIKE PIVOT POINTS AND REVERSE THE WAVE (or act like a mirror that can reflects light) BASED ON STRENGTH OF THAT LEVEL.
ENTRY PRICE BLACK COLOR
MOST PROBABLE SCENARIOS TARGETS GREEN COLOR
LEAST PROBABLE SCENARIOS TARGETS RED COLOR
TARGETS ARE NOT EXACT NUMBERS THEY ARE MORE LIKE A ZONE.
DO NOT USE THIS STROTEGY FOR LEVERAGED TRADING.
It will not give you the whole wave like any other strategy out there but it will give you a huge part of the wave.
The BEST TIMEFRAMES for this strategy are Daily, Weekly and Monthly however it can work on any timeframe.
Consider those points and you will have a huge advantage in the market.
There is a lot more about this strategy.
It can predict possible target and also give you almost exact buy or sell time on the spot.
I am developing it even more so stay tuned and start to follow me for more signals and forecasts.
START BELIEVING AND GOOD LUCK
HADIMOZAYAN

BREAKOUT LONG ON AUDIOAnticipating a double breakout on AUDIO on lower and higher timeframes. Once the first breakout has played out, we can then expect higher % gains.

Crypto - Audius - AUDIO - If NAS and Katy Perry find value...Crypto - Audius - AUDIO - Entertainers NAS and Katy Perry have invested in Audius. Is this the beginning of a trend? Edutainment Purposes only!

Audio Long!#Audio broke through the descending trendline. There is a big possibility of bullish movement up to local high at 4$ .

AUDIO looks goodaudio has a strong fundamentals. It can really go to 6-7 dollars easily in this bull run.

audio/usdTesting/tracking elliot wave theory. Please do not trade off idea without S/L. Not financial advice.
Chart update from 4h to daily.
Target 1 went above prediction from previous chart; if wave count is accurate then we might possibly see this play out

AUDIOThe AUDIO currency is ready to move towards the above targets after overcoming its resistance #AUDIO

🎶AUDIO is warming up- macro bottomAUDIO is now trading close to the macro dynamic support, inside of a 2-month long descending formation. The chart itself is pretty clean. The price has been respecting levels very nicely so far, it should be an easy one to trade. The highlighted green boxes are the current areas of interest for scaling in (those will change depending on what happens next)
Long-term targets:
TP1: 2.57
TP2: 3.10
TP3: 3.69
TP4: 5.01 (~140%)
TP5: OPEN++
----------------------------
About AUDIO:
Audius is a blockchain-powered, decentralized music streaming service with social media features. It's owned and run by an open-source community of artists, fans, and developers, and has its own crypto token, AUDIO.
$AUDIO enables network security, exclusive feature access, and community-owned governance. The Audius protocol gives everyone the freedom to share, monetize, and listen to any audio. Thanks to $AUDIO, our users can earn a voice in the platform’s future through active contributions to the network.
Source: decrypt

AUDIO/USD - 1D LONG => 123% to 166% targetThe following statements are of my own opinion and should not be relied upon as Financial Advise
=> Descending Triangle on the Daily - approaching resistance - if it has a breakout in the next few days, it would reflect a price target of ~$5.20 (123% trade)
=> 20, 55 & 34 EMAs are all coiled up and held as support (bullish)
=> Handle extended on cup & handle - price target of ~$6.20 (166% trade)
=> GL if you follow

Big run up for Audio/BTC imminent?The two previous occasions Audio has traded in a similar range than it is currently in has lead to two parabolic runs against Bitcoin. Are we in the beginning of a third?

AUDIOUSDT 1-11-2021 BREAKOUT SOONAudio Forming Cup & Handle Pattern
Eaaily 1x 🎯 Target.
Buy at Your Own Risk.
NFA.

How is about to get a ticket to fly with AUDIO/USDT?Finally AUDIOS gets out of the long-term triangle and after 30 days of fooling around support zone, the price can breaks the downtrend.
It seems the price looses it's momentum and we should be prepare to enter a long on a pullback to green zone (calculated based on fibo levels) which is in a demand zone on hr 1.
Target will be around 3.0$ and a beautiful close below the red area will fail our analysis
Farewell.

AUDIO/USDT TRADE SETUP! 60-80% PROFIT EXPECTED!Hello everyone, if you like the idea, do not forget to support with a like and follow.
AUDIO looks good here and is currently at the bottom. It is trading inside a big symmetric triangle. Once it breaks out of this symmetric triangle, AUDIO is going to melt faces! Buy some here and add more in the dips.
Entry range:- $1.98-$2.12
Target1:- $2.3
Taregt2:- $2.6
Target#:- $3.12
Target$:- $3.68
SL:- $1.75
Buy on spot and hold. You can also buy with low leverage (3x-5x) with a tight SL.
If you like this idea then do appreciate it with your like and follow.
Also, share your views in the comment section.
This isn't financial advice. DYOR before investing.
Thank You!

AUDIOUSDT Cup and handle pattern4HR stochastics RSI is overbought, looks like a cup and handle pattern is also forming
Entry - 2.318
SL - 2.223
TP1 - 2.408
TP2 - 2.563
TP3 - 3.093
Always do your own analysis.
Good luck

$AUDIO, Trying to reclaim ~3500 sats level back to support $AUDIO
Trying to reclaim ~3500 sats level back to support after the 30% recovery over the last 5 days..
Aiming for a potential flip as signal of continuation while volume has been increasing over the same period
UCTS signalling the 1D Buy signal as well
Wait for it
#AUDIO
