Audjpy-short

AUDJPY WeaknessPrice shown on daily having hard time within the 85.0 and 85.5 range as a double touch of this range can be seen. Zooming into the 4h timeframe, you can see a clear break of the uptrend after a hard rejection from the daily zone. A retest and rejection followed. Pushdown, consolidation, pushup and rejection. This rejection was lower than the original, even though just a small amount. On 1h, bearish break of consolidation. Retest of the 84.0 level with a hard rejection. Closing the last hour with a bearish gravestone. Looking for sells toward the 82.4 daily recent low.
AUDJPY Daily
AUDJPY 4h
AUDJPY 1h

AUDJPY reversal in trend and start of a new FALLMarch for the price began with a false breakdown of the resistance line at 83.83, then there was a strong price collapse, an attempt to break through the support line at 82.31. After that, the price finally returned to the uptrend, which has been adhered to since November 2020.
During the growth in this trend since the beginning of March, the price again reached the resistance line and touched it at 84.78. It is already clear that the price reversed from this line and showed a slight downward movement. And I expect it to continue to fall. So my final target is the 83.67 support line.
Traders, if you liked this idea or if you have your own opinion about it, write in the comments. I will be glad 👩💻


AUD/JPY **SHORT** **30 PIPS**Just an idea, markets been very bullish lately. Trade at your own risk~

AUD/JPY shortsShort term sells.
Would need a nice impulse to downside followed by some sort of correction to consider shorting this pair. Lets see how things develop!

AUDJPY FALLING from strong RESISTANCE zoneAt the beginning of this month, the price rose and managed to break first the resistance line 80.002, then the level of 80.556, but immediately after that it touched the resistance line 80.836 and returned back to the first line.
These two lines together with the level create a strong resistance zone. It is important to note that one of these lines, the trend line, was formed in June 2019. The second has existed much longer - the first touch of this line happened in 2017.
A strong resistance zone is the main reason based on which I expect that the price will not be able to continue to rise and will start falling despite an attempt to break through. Now I expect the price to reverse from the resistance line at 80.186 and drop to the support line in the near future. Of course, it will not do without corrections.
Thus, my final target is the support line at 75.45.
Traders, if you liked this idea or if you have your own opinion about it, write in the comments. I will be glad 👩💻

AUDJPY - ShortPossible short opportunity on AUDJPY.
Descending channel making lower lows and lower highs.
A break in the in-channel trend line will call for a shorting opportunity from the 79.95 level down to the 79.15 level.
confirmation of the break will be strong bearish closed 4H candles as well as signals from the MACD and RVI.

AUDJPY continues FALL to support lineAt the very beginning of January, the price came to a strong resistance zone of 80.99. This zone is formed at the intersection of two strong resistance lines, one of which appeared in 2019, and the second, a stronger one, in 2014.
As expected, the price bounced from this zone and began to fall, but after a few days it returned to the zone during the correction. For the second time, the price began to fall from the 80.82 line. But this time there was also a correction. However, during the second correction, the atk price did not return to the resistance zone, but stopped short of reaching it.
Like last time, I continue to expect that despite the correction, the price will continue to fall from the resistance zone and eventually come to the support line. Thus our final target is the 78.43 support line.
Traders, if you liked this idea or if you have your own opinion about it, write in the comments. I will be glad 👩💻


AUDJPY touched RESISTANCE zone and FALL In my previous forecast, we expected the price to rise from the support line to the resistance, and as we can see, the price really showed a strong growth over the last month. From the support line at 77.74, it moved up to the resistance zone of 80.96.
This is a strong zone formed by two lines. The first line is the youngest, appeared on the chart in 2019, the second is older, formed at the highs of the chart since 2014. After the first touch of the zone, the price bounced back and began to fall, but immediately corrected to the zone again.
I now expect a fall for two main reasons. First, the price will not be able to break through such a strong zone. Secondly, one should take into account the strong growth preceding this and the breakdown of the support line, after which the price has no resource left and there is no strong enough support for growth.
Therefore, the final target that I now expect is the 78.30 support line.
Traders, if you liked this idea or if you have your own opinion about it, write in the comments. I will be glad 👩💻


AUDJPY SHORT INTRADAY SCALPAfter a strong bearish open to the market this week/ day i think we are going to get retracement or pullback early in the New York session. After the pullback I will look for the bearish trend to continue until around the close of New York Session.
RISK/ REWARD 1:1
ENTRY 78.237
SL 78.936
TP 75.516


AUDJPY SHORT INTRA DAY SCALPAJ has been very bullish without any retest of the current trend. Price just reached Aug 20th 9am high, forming a possible double top. This is a good area to see a retracement.
Risk To Reward 1.7:1


AUDJPY SHORT DOWNWARD CHANNELJust when you thought you had some quick money.... Looks like Aj is in a Downward Channel. Should you take profits here? or wait out the trend which could take until the start of London just for 27 pips? Is 27 pips worth going to sleep with the trade open? hahah Decisions Decisions. Hopefully this level of holds and we can hit TP by midnight .

AUDJPY line and SIGNALSSo let's start LEARNING. On the chart in the description, we see a good example of a strong resistance line. You can see how the price perfectly touches the given line and then reverses. This line is very important for us today because the price is currently near it.
Next, go to the 4TF chart and see the perfect deal. We put SL above the resistance lines and TP to the nearest support line.
Traders, if you like this idea or have your own opinion about it, write in the comments. I will be glad👩💻

AUD/JPY Potential ReversalAUD/JPY has rejected th support at 77 for 4 times now. I think the pair is ready to drop.
Consider Support 1 and Support 2 as good areas to exit your short. Support 2 has an amazing R/R, but higher risk. Support 1 would be the most conservative exit.


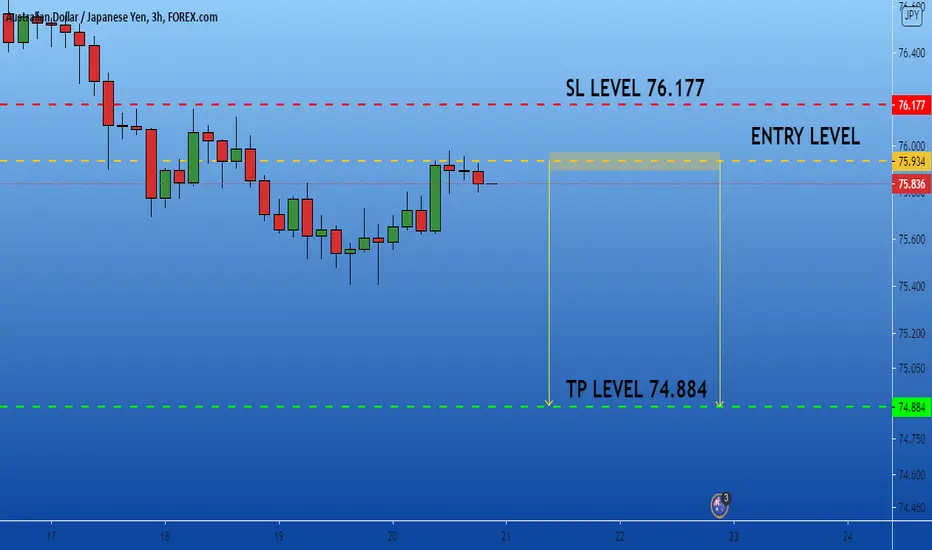
AUDJPY: Short Trade Explained
AUDJPY
- Classic bearish setup
- Our team expects bearish continuation
SUGGESTED TRADE:
Swing Trade
Short AUDJPY
Entry Point - 75.934
Stop Loss - 76.177
Take Profit - 74.884
Our Risk - 1%
Please, leave a comment and support us with like.