The Chart Says ''Cheer Up Japan'' – JPY Looks Safe📊🇯🇵 The Chart Says "Cheer Up Japan" – JPY Looks Safe 💙✨
There’s been talk, worry, even viral prophecy this week… but I’m here to say:
I read charts — not fear.
And right now, the JPY is showing strength, not weakness.
After running a full scan with my AI-powered Precision Master Mode, the cleanest trade setup aligned with this view is:
AUDJPY SHORT 📉
🗾 Cheer up, Japan — the Yen’s got this.
No panic in the charts. Just structure, volume, and momentum confirming that JPY is holding its ground as a safe-haven currency.
🔍 TRADE SETUP – AUDJPY SHORT
ENTRY: Market (or 94.85 for better R:R)
STOP LOSS: 95.70 (above trap high)
TARGETS:
TP1: 93.50
TP2: 91.57
TP3: 87.84 (macro target)
📈 What the chart shows:
– Strong rejection from top channel zone (structure is King!)
– SuperTrend flip starting on multiple TFs
– VWRSI fading = momentum loss
– Volume Profile confirms resistance
So while the headlines play on emotions, my execution comes from structure.
Let’s ride this JPY strength into next week — calmly, confidently.
📸 Chart attached (8H view – AI tuned)
📰 Article on the 'prophecy' that sparked the buzz:
www.telegraphindia.com
Have a nice weekend Japan and all Asia! After a 'scary prophecy' troubling your minds the weekend can end up being a crazy happy one!
One Love,
The FXPROFESSOR 💙
Disclosure: I am happy to be part of the Trade Nation's Influencer program and receive a monthly fee for using their TradingView charts in my analysis. Awesome broker, where the trader really comes first! 🌟🤝📈
AUDJPY

AUDJPY SELLBy utilizing levels, historical patterns, , we can formulate a hypothesis that the market might follow a similar trajectory if bearish sentiment prevails.

AUD/JPY: Rejection at Key ResistanceThis is a high-conviction short setup on AUD/JPY based on a powerful rejection pattern that has formed on the 4-hour chart. As you can see, the price spiked into the critical resistance zone between 95.00 and 95.55 but was immediately and forcefully rejected, leaving behind a long "Exhaustion Spike."
This is a classic sign of buyer exhaustion and seller dominance. It tells us that despite the recent rally, there is significant supply waiting at these higher levels. This price action provides a clear opportunity to short the pair in anticipation of a significant move down.
🏦 Fundamental Analysis
The fundamental backdrop provides a strong tailwind for this trade, with two key drivers:
1️⃣ Central Bank Divergence: The Reserve Bank of Australia (RBA) is in an easing cycle, having recently cut rates to 3.85% with more cuts expected. In stark contrast, the Bank of Japan (BoJ) is on a path of normalization, having already raised its rate to 0.50%. This divergence in monetary policy is structurally bearish for AUD/JPY.
2️⃣ Imminent Catalysts: This week is packed with event risk that is skewed to the downside for this pair. We have the RBA interest rate decision on Tuesday, July 8th , and the U.S. tariff deadline on Wednesday, July 9th . A dovish RBA or a "risk-off" move from the tariff news would likely accelerate the decline in AUD (a risk currency) and strengthen the JPY (a safe-haven currency).
📊 Technical Analysis
The price action on the chart confirms the bearish bias:
1️⃣ 4-Hour Rejection: The "Exhaustion Spike" at the 95.00 - 95.55 supply zone is the primary signal. It shows a clear failure by buyers and a strong takeover by sellers at a key level.
2️⃣ Long-Term Trend: On the daily chart, the price is trading below the critical 200-day moving average , confirming the long-term trend remains bearish.
3️⃣ Waning Momentum: There is a clear bearish divergence on the daily RSI. The price made a higher high, but the momentum indicator made a lower high, signaling that the rally is internally weak and losing steam.
📋 Trading Setup
This is a swing trade designed to capture a significant correction with a simple "set and forget" plan.
📉 Direction: SHORT / SELL
👉 Entry: Sell Limit @ 94.85
⛔️ Stop Loss: 95.60
🎯 Take Profit: 91.10
💡 Rationale: The entry is placed strategically to capitalize on a potential retest of the rejection area. The stop loss is placed safely above the rejection wick and the major resistance zone. The take profit targets the major structural support from the May 2025 lows, offering an excellent risk-to-reward ratio.

AUDJPY SHORT FORECAST Q3 W27 D4 Y25AUDJPY SHORT FORECAST Q3 W27 D4 Y25
Professional Risk Managers👋
Welcome back to another FRGNT chart update📈
Diving into some Forex setups using predominantly higher time frame order blocks alongside confirmation breaks of structure.
Let’s see what price action is telling us today! 👀
💡Here are some trade confluences📝
✅Weekly Order Block Identified
✅Daily Order block identified
✅4H Order Block identified
✅15' Order block identified
🔑 Remember, to participate in trading comes always with a degree of risk, therefore as professional risk managers it remains vital that we stick to our risk management plan as well as our trading strategies.
📈The rest, we leave to the balance of probabilities.
💡Fail to plan. Plan to fail.
🏆It has always been that simple.
❤️Good luck with your trading journey, I shall see you at the very top.
🎯Trade consistent, FRGNT X

AUD_JPY RISKY SHORT|
✅AUD_JPY is set to retest a
Strong resistance level above at 95.600
After trading in a local uptrend for some time
Which makes a bearish pullback a likely scenario
With the target being a local support below at 95.081
SHORT🔥
✅Like and subscribe to never miss a new idea!✅
Disclosure: I am part of Trade Nation's Influencer program and receive a monthly fee for using their TradingView charts in my analysis.

AUDJPY: Short Trade Explained
AUDJPY
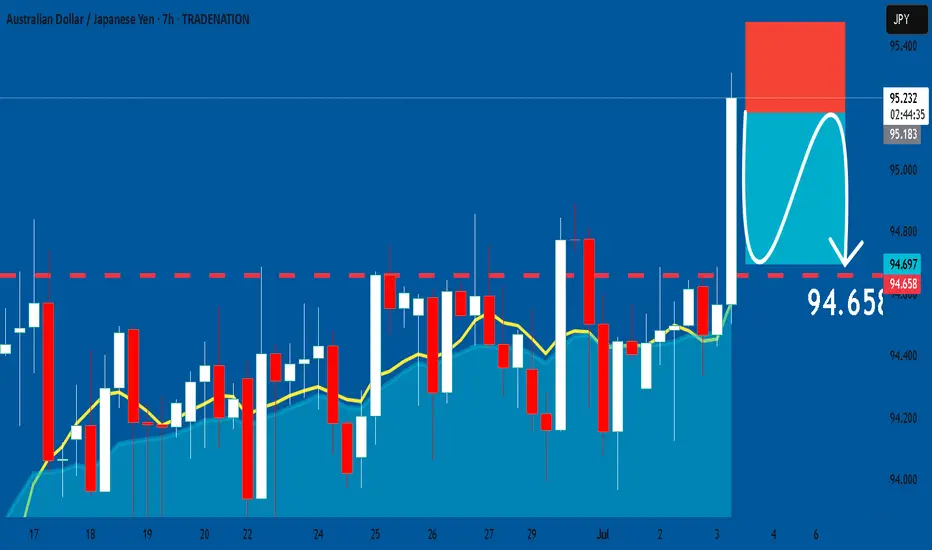
- Classic bearish formation
- Our team expects fall
SUGGESTED TRADE:
Swing Trade
Sell AUDJPY
Entry Level - 95.193
Sl - 95.477
Tp - 94.658
Our Risk - 1%
Start protection of your profits from lower levels
Disclosure: I am part of Trade Nation's Influencer program and receive a monthly fee for using their TradingView charts in my analysis.
❤️ Please, support our work with like & comment! ❤️
AUD/JPY# AUD/JPY: Two High-Probability Bearish Setups 🎯
## Overview
AUD/JPY continues to respect its macro downtrend structure, offering two compelling bearish opportunities as price approaches critical resistance levels. Currently trading at 94.398, the pair sits at an inflection point between key support and resistance zones.
---
## 📊 Setup 1: Resistance Zone Rejection (Primary)
### Key Level: 95.289 (Major Resistance)
This level has proven its significance multiple times:
- ✅ Strong resistance throughout recent months
- ✅ Clear seller dominance at this zone
- ✅ Confluence with descending channel structure
### Entry Strategy:
1. **Wait** for price to approach 95.289
2. **Identify** bearish rejection patterns:
- Pin bars / Shooting stars
- Bearish engulfing candles
- Multiple wick rejections
3. **Enter** short on confirmed rejection
4. **Stop Loss**: 95.50-95.60 (above resistance)
5. **Targets**:
- TP1: 93.240 (1:2 RR)
- TP2: 92.271 (1:3.5 RR)
---
## 📊 Setup 2: Rising Wedge Breakdown (Secondary)
### Pattern Recognition:
A textbook rising wedge has formed since the May lows - a bearish reversal pattern within the larger downtrend context.
### Entry Strategy:
1. **Monitor** the lower wedge trendline
2. **Wait** for decisive breakdown with volume
3. **Enter** short on retest of broken support
4. **Stop Loss**: Above recent swing high
5. **Target**: 93.240 support zone
---
## 📈 Market Structure Analysis
### Macro Trend: BEARISH 📉
- Consistent lower highs and lower lows from 102+ levels
- Currently in corrective bounce phase
- Respecting descending channel boundaries
### Current Position:
Price trapped between:
- **Resistance**: 95.289
- **Support**: 93.240
- **Deep Support**: 92.271
---
## ⚠️ Risk Management
**Patience is key!** Current price offers poor risk/reward. Wait for:
1. **Scenario A**: Test of 95.289 resistance → Short opportunity
2. **Scenario B**: Break below wedge support → Short opportunity
3. **Scenario C**: Break above 95.289 → Invalidation, stay flat
### Position Sizing:
- Risk per trade: 1-2% of account
- Adjust position size based on stop distance
---
## 🎯 Trade Summary
**Bias**: BEARISH 🐻
**Preferred Setup**: Resistance rejection at 95.289
**Risk/Reward**: Minimum 1:2
**Timeframe**: Daily
---
*Remember: The best trades come to those who wait. Let price come to your levels, don't chase!*
**What's your view? Drop a comment below! 👇**
*Disclaimer: This is not financial advice. Always do your own research and manage risk appropriately.*
---

AUD/JPY SENDS CLEAR BEARISH SIGNALS|SHORT
Hello, Friends!
We are now examining the AUD/JPY pair and we can see that the pair is going up locally while also being in a uptrend on the 1W TF. But there is also a powerful signal from the BB upper band being nearby, indicating that the pair is overbought so we can go short from the resistance line above and a target at 93.578 level.
Disclosure: I am part of Trade Nation's Influencer program and receive a monthly fee for using their TradingView charts in my analysis.
✅LIKE AND COMMENT MY IDEAS✅

AUDJPY - let's do it again!Hello TradingView Family / Fellow Traders. This is Richard, also known as theSignalyst.
As per our last AUDJPY analysis (attached on the chart), it rejected the first blue circle zone and surged in a parabolic manner.
📈AUDJPY is currently retesting the intersection of the blue trendline and red support.
📚 As per my trading style:
As #AUDJPY is around the latest blue circle zone, I will be looking for bullish reversal setups (like a double bottom pattern, trendline break , and so on...)
📚 Always follow your trading plan regarding entry, risk management, and trade management.
Good luck!
All Strategies Are Good; If Managed Properly!
~Rich
Disclosure: I am part of Trade Nation's Influencer program and receive a monthly fee for using their TradingView charts in my analysis.

AUDJPY Trading Opportunity! BUY!
My dear subscribers,
My technical analysis for AUDJPY is below:
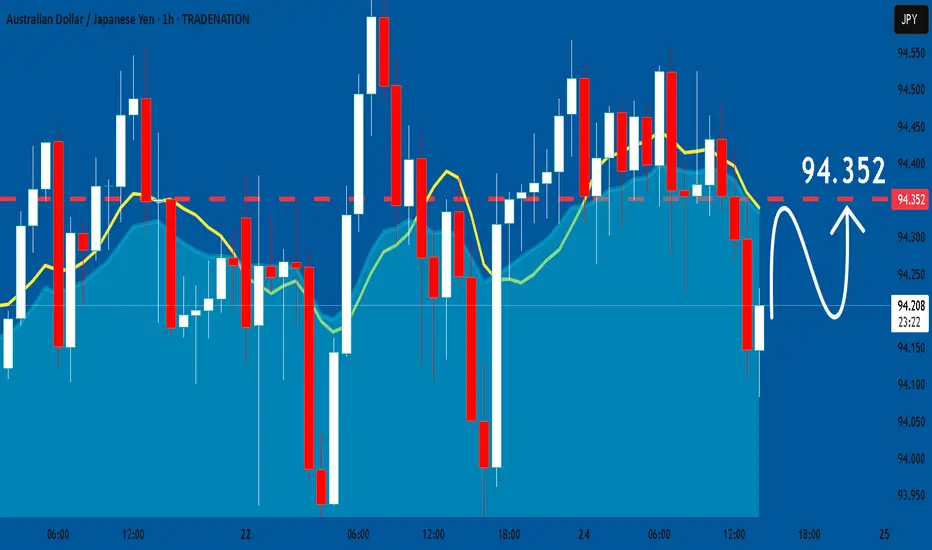
The price is coiling around a solid key level - 94.200
Bias - Bullish
Technical Indicators: Pivot Points Low anticipates a potential price reversal.
Super trend shows a clear buy, giving a perfect indicators' convergence.
Goal - 94.441
About Used Indicators:
By the very nature of the supertrend indicator, it offers firm support and resistance levels for traders to enter and exit trades. Additionally, it also provides signals for setting stop losses
Disclosure: I am part of Trade Nation's Influencer program and receive a monthly fee for using their TradingView charts in my analysis.
———————————
WISH YOU ALL LUCK
AUDJPY SHORT FORECAST Q3 W27 D1 Y25AUDJPY SHORT FORECAST Q3 W27 D1 Y25
Professional Risk Managers👋
Welcome back to another FRGNT chart update📈
Diving into some Forex setups using predominantly higher time frame order blocks alongside confirmation breaks of structure.
Let’s see what price action is telling us today! 👀
💡Here are some trade confluences📝
✅Weekly Order Block Identified
✅Daily Order block identified
✅4H Order Block identified
✅15' Order block identified
🔑 Remember, to participate in trading comes always with a degree of risk, therefore as professional risk managers it remains vital that we stick to our risk management plan as well as our trading strategies.
📈The rest, we leave to the balance of probabilities.
💡Fail to plan. Plan to fail.
🏆It has always been that simple.
❤️Good luck with your trading journey, I shall see you at the very top.
🎯Trade consistent, FRGNT X

AUDJPY – Trade the Range… Until It EndsHello TradingView Family / Fellow Traders. This is Richard, also known as theSignalyst.
📈AUDJPY has been trading within a big range marked in red.
Moreover, the it is retesting the lower bound of its rising channel marked in blue.
🏹 Thus, the highlighted blue circle is a strong area to look for buy setups as it is the intersection of support and lower blue trendline acting as a non-horizontal support.
📚 As per my trading style:
As #AUDJPY approaches the blue circle zone, I will be looking for bullish reversal setups (like a double bottom pattern, trendline break , and so on...)
📚 Always follow your trading plan regarding entry, risk management, and trade management.
Good luck!
All Strategies Are Good; If Managed Properly!
~Rich
Disclosure: I am part of Trade Nation's Influencer program and receive a monthly fee for using their TradingView charts in my analysis.

AUDJPY 4hour TF - June 29th, 2025AUDJPY 4hour Neutral Idea
Monthly - Bullish
Weekly - Bearish
Dailly - Bearish
4hour - Ranging
AJ is currently sitting at a major daily resistance area around 94.500. We have to wait for price action to make a move and show some conviction before we can become confident in a setup.
Lucky us, price action is usually easy to follow when waiting for a break of a range. The way I see it, we have two great options.
Bullish Breakout - In the scenario where we see price action break above the 94.500 zone we will look for long setups. Ideally, we spot some clear higher lows above 94.500 with strong bullish conviction. Look to target higher resistance levels like 96.500.
Bearish Continuation - If we see this resistance level at 94.500 continue to hold we could see a daily bearish continuation happen. Look for strong bearish candles rejecting the current zone followed by clear lower highs. We’re targeting lower if that happens to around the 92.000 area.

AUDJPY WEEKLY HIGHER TIME FRAME FORECAST Q3 W27 Y25AUDJPY WEEKLY HIGHER TIME FRAME FORECAST Q3 W27 Y25
Professional Risk Managers👋
Welcome back to another FRGNT chart update📈
Diving into some Forex setups using predominantly higher time frame order blocks alongside confirmation breaks of structure.
Let’s see what price action is telling us today! 👀
💡Here are some trade confluences📝
✅Weekly 50EMA Rejection
✅Daily Order block identified
✅1H Order Block identified
🔑 Remember, to participate in trading comes always with a degree of risk, therefore as professional risk managers it remains vital that we stick to our risk management plan as well as our trading strategies.
📈The rest, we leave to the balance of probabilities.
💡Fail to plan. Plan to fail.
🏆It has always been that simple.
❤️Good luck with your trading journey, I shall see you at the very top.
🎯Trade consistent, FRGNT X

AUDJPY SHORT FORECAST Q2 W26 D27 Y25AUDJPY SHORT FORECAST Q2 W26 D27 Y25
Professional Risk Managers👋
Welcome back to another FRGNT chart update📈
Diving into some Forex setups using predominantly higher time frame order blocks alongside confirmation breaks of structure.
Let’s see what price action is telling us today! 👀
💡Here are some trade confluences📝
✅Weekly Order Block Identified
✅Daily Order block identified
✅4H Order Block identified
✅15' Order block identified
🔑 Remember, to participate in trading comes always with a degree of risk, therefore as professional risk managers it remains vital that we stick to our risk management plan as well as our trading strategies.
📈The rest, we leave to the balance of probabilities.
💡Fail to plan. Plan to fail.
🏆It has always been that simple.
❤️Good luck with your trading journey, I shall see you at the very top.
🎯Trade consistent, FRGNT X

AUDJPY Is Bullish! Long!
Here is our detailed technical review for AUDJPY.
Time Frame: 4h
Current Trend: Bullish
Sentiment: Oversold (based on 7-period RSI)
Forecast: Bullish
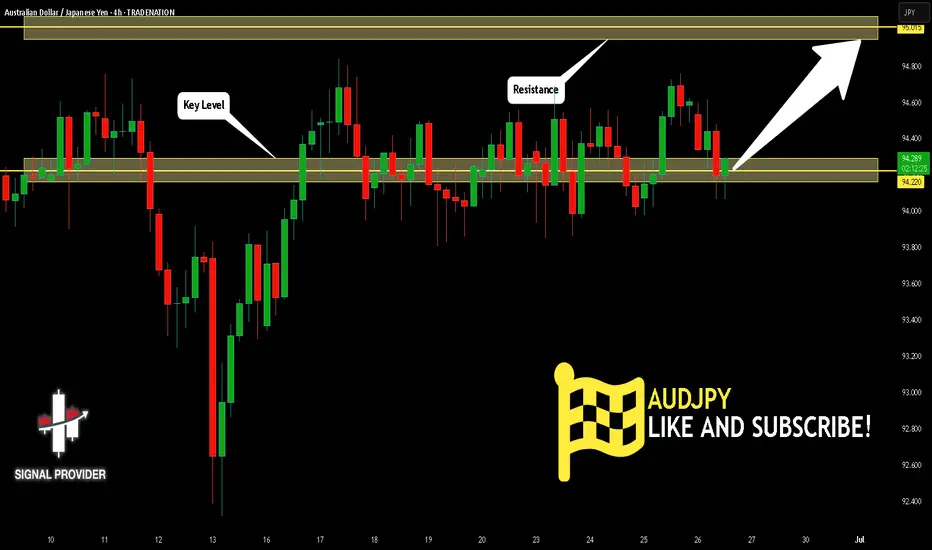
The market is trading around a solid horizontal structure 94.220.
The above observations make me that the market will inevitably achieve 95.015 level.
P.S
Please, note that an oversold/overbought condition can last for a long time, and therefore being oversold/overbought doesn't mean a price rally will come soon, or at all.
Disclosure: I am part of Trade Nation's Influencer program and receive a monthly fee for using their TradingView charts in my analysis.
Like and subscribe and comment my ideas if you enjoy them!
AUDJPY SHORT FORECAST Q2 W26 D26 Y25AUDJPY SHORT FORECAST Q2 W26 D26 Y25
Professional Risk Managers👋
Welcome back to another FRGNT chart update📈
Diving into some Forex setups using predominantly higher time frame order blocks alongside confirmation breaks of structure.
Let’s see what price action is telling us today! 👀
💡Here are some trade confluences📝
✅Weekly Order Block Identified
✅Daily Order block identified
✅4H Order Block identified
✅15' Order block identified
🔑 Remember, to participate in trading comes always with a degree of risk, therefore as professional risk managers it remains vital that we stick to our risk management plan as well as our trading strategies.
📈The rest, we leave to the balance of probabilities.
💡Fail to plan. Plan to fail.
🏆It has always been that simple.
❤️Good luck with your trading journey, I shall see you at the very top.
🎯Trade consistent, FRGNT X

AUD_JPY LOCAL SHORT|
✅AUD_JPY made a retest of the
Strong horizontal resistance level of 94.800
And as you can see the pair is already
Making a local pullback from
The level which sends a clear
Bearish signal to us therefore
We will be expecting a
Further bearish correction
SHORT🔥
✅Like and subscribe to never miss a new idea!✅
Disclosure: I am part of Trade Nation's Influencer program and receive a monthly fee for using their TradingView charts in my analysis.

AUDJPY Under Pressure! SELL!
My dear subscribers,
This is my opinion on the AUDJPY next move:
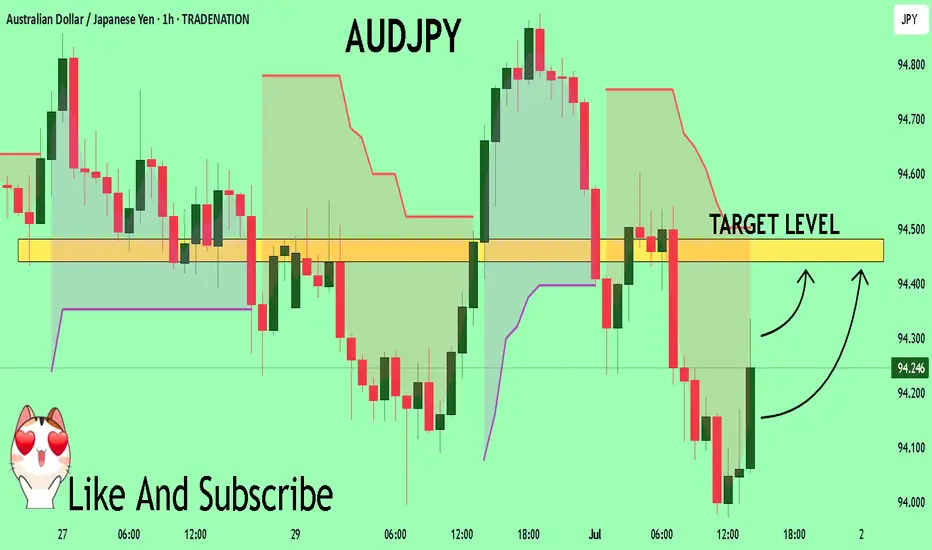
The instrument tests an important psychological level 94.650
Bias - Bearish
Technical Indicators: Supper Trend gives a precise Bearish signal, while Pivot Point HL predicts price changes and potential reversals in the market.
Target - 94.434
About Used Indicators:
On the subsequent day, trading above the pivot point is thought to indicate ongoing bullish sentiment, while trading below the pivot point indicates bearish sentiment.
Disclosure: I am part of Trade Nation's Influencer program and receive a monthly fee for using their TradingView charts in my analysis.
———————————
WISH YOU ALL LUCK

AUDJPY DETAILED ANALYSISAUDJPY has successfully completed a breakout from a bullish pennant structure on the 4H timeframe, signaling the beginning of a strong upward continuation move. After a sustained consolidation below descending resistance, price action has now pierced through the upper trendline with volume and follow-through momentum. The breakout is aligned with the prior bullish leg from mid-June, indicating trend continuation. I’m now targeting 96.500 as the next key price level, with current price holding firm at 94.500.
Fundamentally, the Australian Dollar remains supported by recent hawkish RBA expectations. Traders are now pricing in the possibility of another rate hike following sticky inflation data out of Australia. The latest CPI print showed an annualized rise above 4%, exceeding forecasts, and reinforcing the case for tighter monetary policy. In contrast, the Japanese Yen continues to weaken as the Bank of Japan maintains its dovish tone, with no immediate signs of rate normalization. The ongoing yield divergence continues to fuel bullish flows into AUDJPY.
Today’s market sentiment favors risk-on assets, and AUD typically benefits in such conditions. Global equity strength and higher commodity prices are further backing AUD's upside momentum. Moreover, with carry trade flows increasing as investors seek higher-yielding currencies, AUDJPY is well-positioned to benefit from both fundamental tailwinds and technical breakout confirmation.
This setup is technically clean and fundamentally strong. Pullbacks toward the 94.100–93.900 zone could be retested as new support before the pair extends higher. As long as price holds above the breakout level, I remain bullish with 96.500 as my primary upside target. This pair is offering a high-probability continuation play in alignment with both macro and micro structure.

AUD/USD, AUD/JPY: Soft CPI A Gift For RBA Doves?I have long said that the RBA could cut in July, and today's CPI figures all but confirm one is on tap. But with AUD/USD and AUD/JPY are rising, will bears get their say?
Matt Simpson, Market Analyst at City Index and Forex.com

AUD/JPY at Risk of Breakdown as Bullish Momentum FadesAUD/JPY failed to follow through on a bullish breakout above 94.00, despite initial signs of strength from a bullish hammer and inverted H&S pattern. The pair has since printed a bearish engulfing candle on the daily chart to take prices near the lows of its range of the past week.
With the 1-hour RSI (2) hitting oversold levels, a minor bounce is possible, but risks remain skewed to the downside. A break beneath 93.70 would confirm a range breakdown and open the door to a deeper pullback towards the high-volume node (HVN) at 93.85.
Matt Simpson, Market Analyst at City Index and Forex.com.

AUDJPY: Bulls Will Push Higher
The analysis of the AUDJPY chart clearly shows us that the pair is finally about to go up due to the rising pressure from the buyers.
Disclosure: I am part of Trade Nation's Influencer program and receive a monthly fee for using their TradingView charts in my analysis.
❤️ Please, support our work with like & comment! ❤️