AUD/JPY Analysis: Rate Falls to Important SupportThis morning, the AUD/JPY rate dropped below 95.2 yen per Australian dollar for the first time since late October.
The weakening of the AUD was contributed by:
→ negative news regarding the Chinese economy. The Hang Seng Index set its 2023 low yesterday;
→ Australian GDP data published yesterday, which is growing at a weaker-than-expected pace.
And the strengthening of the yen occurs against the backdrop of expectations of an increase in interest rates in Japan, which intensified according to the statement of the head of the Bank of Japan. Kazuo Ueda said yesterday the central bank has several options for targeting interest rates once it gets short-term borrowing costs out of negative territory.
At the same time, the AUD/JPY chart shows that:
→ the rate has reached important support from the lower border of the channel shown in blue;
→ the rate has broken through the level of 96.25, and now the level may act as resistance;
→ RSI dropped into the extreme oversold zone. This increases the temptation for bears to take profits.
Given these factors, it is reasonable to assume that the market is vulnerable to a short-term bullish correction after a strong downward impulse. However, if the current fundamental background does not change, it is possible that the strengthening yen will break through important support in the pair against AUD in December (which is also true for other currencies).
This article represents the opinion of the Companies operating under the FXOpen brand only. It is not to be construed as an offer, solicitation, or recommendation with respect to products and services provided by the Companies operating under the FXOpen brand, nor is it to be considered financial advice.
AUDJPY

AUDJPY H4 | Falling to support level?AUDJPY is falling from a pullback resistance toward our take-profit target level.
Entry: 96.789
Why we like it:
There is the pullback resistance level
Stop Loss: 96.870
Why we like it:
There is the overlap resistance level.
Take Profit:95.288
Why we like it:
There is the pullback support level
Please be advised that the information presented on TradingView is provided to Vantage (‘Vantage Global Limited’, ‘we’) by a third-party provider (‘Everest Fortune Group’). Please be reminded that you are solely responsible for the trading decisions on your account. There is a very high degree of risk involved in trading. Any information and/or content is intended entirely for research, educational and informational purposes only and does not constitute investment or consultation advice or investment strategy. The information is not tailored to the investment needs of any specific person and therefore does not involve a consideration of any of the investment objectives, financial situation or needs of any viewer that may receive it. Kindly also note that past performance is not a reliable indicator of future results. Actual results may differ materially from those anticipated in forward-looking or past performance statements. We assume no liability as to the accuracy or completeness of any of the information and/or content provided herein and the Company cannot be held responsible for any omission, mistake nor for any loss or damage including without limitation to any loss of profit which may arise from reliance on any information supplied by Everest Fortune Group.

AUDJPY → TriangleWe have a possible Triangle pattern with a target at 95.000, as long as the price does not break the 98.400 zone.

AUD-JPY Strong Support Ahead! Buy!
Hello,Traders!
AUD-JPY keeps going down
To retest the horizontal
Support level of 0.9604
From where I believe
We will see a local
Bullish rebound as
The pair is now oversold
Buy!
Like, comment and subscribe to help us grow!
Check out other forecasts below too!

AUD-JPY - Ready For short?AUD-JPY
These are my keylevels on Daily.
Im looking to short it again.
1.Need to broke the line trend and the support key , confirmation and im in.

AUDJPY | COULD BE A GOOD REVERSAL BUY? Hey Traders!
AUDJPY - although its definitely trending to the downside, I feel we might have a push to the upside due to it sitting on 50 daily moving average, while also sitting on a strong monthly support pivot point.
I highly doubt its going to break it easily and this makes for a great trading opportunity, AUD is currently being bought by hedge funds while jpy is being sold off.
Since we are going against the trend, your risk management plan should be tight and a lower lot size is recommended.

AUDJPY Potential DownsidesHey Traders, in the coming week we are monitoring AUDJPY for a selling opportunity around 98.200 zone, AUDJPY was trading in an uptrend and successfully managed to break it out. Currently is in a correction phase in which it is approaching the retrace area at 98.200 support and resistance area.
Trade safe, Joe.

AUDJPY Set To Fall! SELL!
My dear followers,
This is my opinion on the AUDJPY next move:
The asset is approaching an important pivot point 98.052
Bias - Bearish
Technical Indicators: Supper Trend generates a clear short signal while Pivot Point HL is currently determining the overall Bearish trend of the market.
Goal - 97.444
About Used Indicators:
For more efficient signals, super-trend is used in combination with other indicators like Pivot Points.
———————————
WISH YOU ALL LUCK

AUDJPY SHORT(Did this publishing on my mobile app.) On the Daily timeframe, a potential ABC pattern has been spotted. If you look left, the ABC pattern from the past is what I’m referring to. The RSI is overbought at this level and there is also a potential divergence being created between price and RSI. Buyers seem to still want to push but the effort in action seems like it’s gassing. Took an initial entry with a 1:1 setup and may start planning for an additional entry depending on price movement down the road. This is a weekly/ daily trade and will take some time. Not advice. If stop loss gets hit, we will reassess.

AUDJPY Idea H1Here is my analysis for AUDJPY on H1 using Order Block. The price could go bullish, you can put a pending order on the Order block or find an entry on LTF within OB Zone. Trade Safe!

SWING AUDJPY SELL i will sell at this point and leave it for 1 week and come later + no stop loss ( small lot size if u have drawdown )

AUDJPY is in possible buy zone!AUDJPY is forming higher highs, signaling a bullish trend. After retracting to the designated zone and the 61.8% Fibonacci retracement level, a buying opportunity emerged for a retest of equal highs.
Anticipating a revisit to the key resistance level due to the ongoing bullish trend.

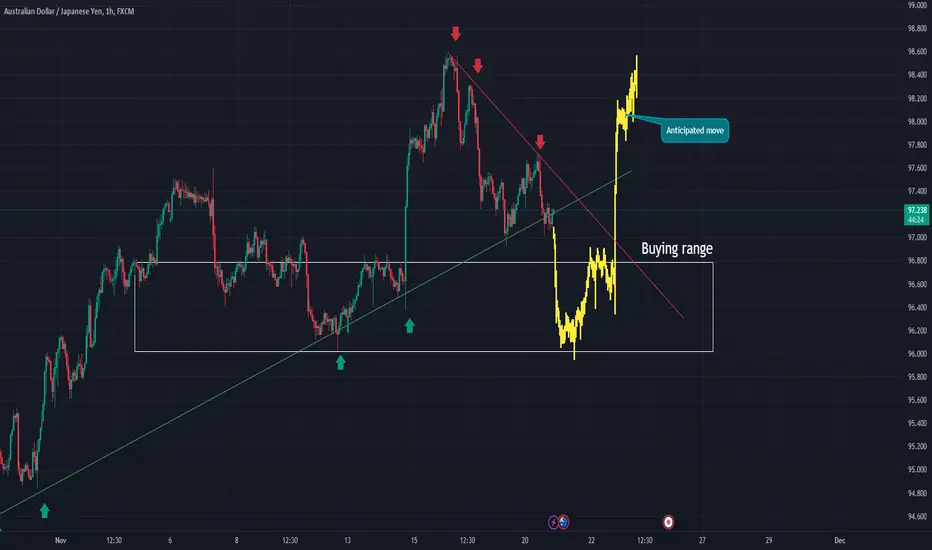
📈 AUDJPY: Analyzing Upward Momentum and Potential BreakoutHello fellow traders!
Today, let's delve into the FX:AUDJPY currency pair. Here's the breakdown:
🕰️ Timeframe Analysis : The pair is predominantly exhibiting upward momentum on the 4-hour chart, showcasing a bullish trend.
⚖️ 1-Hour Chart Dynamics : However, a closer look at the 1-hour chart reveals an attempt to break the support trend line. A potential breakout is in the cards.
❌ Caution on Breakout : Despite the attempt, there's a likelihood of a fakeout, suggesting a failed breakout. Keep a watchful eye on this development.
📈 Opportunities for Upside : Notably, there are opportunities for an upward move, with support levels evident. I've marked anticipated future upward movements with yellow candles.
⚠️ Risk Disclaimer : This analysis is not a guaranteed trading signal. It's crucial to conduct your research and analysis before making any trading decisions.
🤔 Your Analysis : How are you interpreting the AUDJPY movement? Share your insights and strategies with the community.
👋 Until Next Time : Remember, always trade responsibly. Thank you. See you in the next post!
Best regards,
Alpha Trading Station
AJ - strong resistance + Bearish order blockHi Friends!
Let’s analyses this pair from multi time frame.
JXY Weekly : Japanese Yen Index is getting rejection at strong Weekly support. Meaning, there will be a SELL pressure for all JPY related pair.
AJ H4 : Price is approaching Bearish Order Block + Resistance. Let’s monitor price action and look for SELL
FX:AUDJPY OANDA:AUDJPY FOREXCOM:AUDJPY

Pennant - AJHere I have AUD/JPY on the 4Hr Chart!
Price was Rejected @ 98.534 creating the high on Nov' 15th. Since then Price failed at the same level and again at attempted Higher High on Nov' 27th! Following this Lower Highs are Higher Lows which seem to be forming a Pennant Pattern!
Currently we have 3 Tests of the Falling Resistance and getting the 3rd test of the Rising Support now!
Pennants are likely to break Bullish OR Bearish so we must wait for the Proper Break!! Given AUD has some big news tonight, this will play a big role!
**Chart Patterns are known to fail 1/3 of the time so BEWARE OF FALSE BREAKS!!
Fundamentally this week:
AUD - CPI (Tue) and OPEC (Thur)
JPY - OPEC (Thur)


audjpy sell signal. Don't forget about stop-loss.
Write in the comments all your questions and instruments analysis of which you want to see.
Friends, push the like button, write a comment, and share with your mates - that would be the best THANK YOU.
P.S. I personally will open entry if the price will show it according to my strategy.
Always make your analysis before a trade

AUDJPY Short for 1:5 Risk to RewardBuying YEN has been a risk for the past few months. In fact, it is the best time to go to Japan as the YEN is super weak.
Having said that, we have a good opportunity to sell AUDJPY now. The risk rewards makes sense and here are the reasons.
1) Daily Divergence is present
2) There is a harmonic pattern to sell at 98.50
3) Strong resistance
Stop loss would be just 30 pips and we are targeting about 150 pips in rewards.

AUDJPY long position analysisAs we are in pull back of 4H bullish trend so I think this area is good to go long. but I'll wait for CHoCH in lower TF.
Let see what will happen...

AUDJPY | COULD BE A GOOD BUY OPPORTUNITYHey Traders!
Broke out a recent wedge, I believe we could have a nice bullish rally to the next area of resistance market in white lines on the charts. JPY banks are closing for a bank holiday I suspect some power in other currency pairs against JPY. JPY is also on an 52 week low in the futures COT data.


AUDJPY - Potential long ✅Hello traders!
‼️ This is my perspective on AUDJPY.
Technical analysis: Here we are in a bullish market structure from 4H timeframe perspective, so I am looking for long. I want price to go a little bit lower to fill the imbalance and then to reject from bullish order block.
Like, comment and subscribe to be in touch with my content!

AUDJPY possible expansionAfter price broke structure with momentum, it gradually retraced back towards a demand zone that it left behind during the expansion. It then started to consolidate, forming liquidity right above this demand, which could fuel price's expansion to the upside after imbalance has been filled and the demand has been mitigated. Due to price being in a bullish trend, our latest high is weak and thus makes it a target for price as it contains liquidity.
