AUD/JPY SENDS CLEAR BEARISH SIGNALS|SHORT
Hello, Friends!
Previous week’s green candle means that for us the AUD/JPY pair is in the uptrend. And the current movement leg was also up but the resistance line will be hit soon and upper BB band proximity will signal an overbought condition so we will go for a counter-trend short trade with the target being at 93.835.
Disclosure: I am part of Trade Nation's Influencer program and receive a monthly fee for using their TradingView charts in my analysis.
✅LIKE AND COMMENT MY IDEAS✅
AUDJPY

AUDJPY SHORT FORECAST Q2 W26 D23 Y25AUDJPY SHORT FORECAST Q2 W26 D23 Y25
Professional Risk Managers👋
Welcome back to another FRGNT chart update📈
Diving into some Forex setups using predominantly higher time frame order blocks alongside confirmation breaks of structure.
Let’s see what price action is telling us today! 👀
💡Here are some trade confluences📝
✅Weekly Order Block Identified
✅Daily Order block identified
✅4H Order Block identified
✅15' Order block identified
🔑 Remember, to participate in trading comes always with a degree of risk, therefore as professional risk managers it remains vital that we stick to our risk management plan as well as our trading strategies.
📈The rest, we leave to the balance of probabilities.
💡Fail to plan. Plan to fail.
🏆It has always been that simple.
❤️Good luck with your trading journey, I shall see you at the very top.
🎯Trade consistent, FRGNT X

AUD/JPY Short Trade Plan Options
✅ Standard Entry
Sell Limit: 94.80
Stop Loss: 96.10
Take Profit 1: 90.00
Take Profit 2: 85.00
Why: Clean entry inside rejection zone, just under multi-decade resistance. Gives room for price to wick higher without being stopped prematurely.
🛡️ Conservative Entry
Sell Limit: 95.20
Stop Loss: 96.30
Take Profit 1: 90.00
Take Profit 2: 85.00
Why: Waits for deeper retracement into top of range. Better R:R, but may not trigger if price weakens early in the week.
🔐 Optional Manual Confirmation Strategy
Watch for a bearish daily candle (pin bar, engulfing) inside 94.50–95.50
Enter at close of that candle with stop above candle high
Gives added confirmation but may reduce reward slightly

AUDJPY: Sell opportunity.AUDJPY is basically neutral on its 1D technical outlook (RSI = 56.422, MACD = 0.430, ADX = 19.989), ranging inside the 1D MA200 and 1D MA50 since the start of May. The last bullish wave top of the Channel Down got rejected around those levels and targeted the S1 Zone. Short, TP = 90.150.
## If you like our free content follow our profile to get more daily ideas. ##
## Comments and likes are greatly appreciated. ##

AUDJPY SHORT FORECAST Q2 W25 D20 Y25AUDJPY SHORT FORECAST Q2 W25 D20 Y25
Professional Risk Managers👋
Welcome back to another FRGNT chart update📈
Diving into some Forex setups using predominantly higher time frame order blocks alongside confirmation breaks of structure.
Let’s see what price action is telling us today! 👀
💡Here are some trade confluences📝
✅Weekly Order block rejection
✅15' Order block to be confirmed
✅4H Order block
✅1H Order block
🔑 Remember, to participate in trading comes always with a degree of risk, therefore as professional risk managers it remains vital that we stick to our risk management plan as well as our trading strategies.
📈The rest, we leave to the balance of probabilities.
💡Fail to plan. Plan to fail.
🏆It has always been that simple.
❤️Good luck with your trading journey, I shall see you at the very top.
🎯Trade consistent, FRGNT X

AUD_JPY GROWTH AHEAD|LONG|
✅AUD_JPY has retested a key support level of 93.800
And as the pair is already making a bullish rebound
A move up to retest the supply level above at 94.600 is likely
LONG🚀
✅Like and subscribe to never miss a new idea!✅
Disclosure: I am part of Trade Nation's Influencer program and receive a monthly fee for using their TradingView charts in my analysis.

SHORT ON AUD/JPYAUD/JPY has given us a choc (change of character) from up to down at a major resistance zone.
I will be selling AUD/JPY to the next demand level looking to catch 100-200 pips

AUD/JPY ShortSell-limit (primary) 93.90 — front-runs the twin highs at 94.00 (May and again last week).
Stop-loss 95.10 — just above the 2024 YTD peak and round-number 95; if price closes above, the breakout is real.
Take-profit 1 91.50 — first daily support shelf; locks ~240 pips (≈ 1.6 R) and is often the first bounce zone.
Take-profit 2 88.50 — November-2023 base / 200-day SMA; full mean-reversion target (~540 pips, ≈ 3.6 R).
Filter to keep order Only leave the order active while the daily candle closes ≥ 93.80 (shows the lid is still respected).
GTC Cancel the order if unfilled after 5 trading days; reassess next week.
Quick rationale
Fundamentals: RBA leaning dovish; JPY could firm on BoJ hawkish hints & intervention risk.
Technical: Double-top near 94; bearish RSI divergence on daily; room down to 91s/88s.
Risk-reward: 120-pip risk vs. 240 / 540-pip reward = 1.6 R and 3.6 R pay-offs.
Place the limit, set the filter alert on daily closes, and let the trade come to you—no need to babysit intraday moves.

AUDJPY Will Go Higher! Buy!
Here is our detailed technical review for AUDJPY.
Time Frame: 6h
Current Trend: Bullish
Sentiment: Oversold (based on 7-period RSI)
Forecast: Bullish
The market is approaching a significant support area 94.496.
The underlined horizontal cluster clearly indicates a highly probable bullish movement with target 95.595 level.
P.S
The term oversold refers to a condition where an asset has traded lower in price and has the potential for a price bounce.
Overbought refers to market scenarios where the instrument is traded considerably higher than its fair value. Overvaluation is caused by market sentiments when there is positive news.
Disclosure: I am part of Trade Nation's Influencer program and receive a monthly fee for using their TradingView charts in my analysis.
Like and subscribe and comment my ideas if you enjoy them!

AUDJPY SHORT FORECAST Q2 W25 D17 Y25AUDJPY SHORT FORECAST Q2 W25 D17 Y25
Professional Risk Managers👋
Welcome back to another FRGNT chart update📈
Diving into some Forex setups using predominantly higher time frame order blocks alongside confirmation breaks of structure.
Let’s see what price action is telling us today! 👀
💡Here are some trade confluences📝
✅Weekly Order block rejection
✅15' Order block
✅Daily order block identified
🔑 Remember, to participate in trading comes always with a degree of risk, therefore as professional risk managers it remains vital that we stick to our risk management plan as well as our trading strategies.
📈The rest, we leave to the balance of probabilities.
💡Fail to plan. Plan to fail.
🏆It has always been that simple.
❤️Good luck with your trading journey, I shall see you at the very top.
🎯Trade consistent, FRGNT X

Could BOJ's "HOLD" on Rates Turn AUDJPY "On Its Head"?Here I have a Multi-Timeframe analysis on OANDA:AUDJPY which is giving multiple signs of Higher Prices potentially to come!!
First on the Daily we can see that Price formed a Hammer Candle after testing the March 11th Support Zone and as the next Daily candle forms (Today), we are already seeing a Bullish Confirmation candle begin!
*Bullish Engulfing would be a textbook Confirmation Candle!
Now zooming into the 4Hr / 1 Hr Charts, this Hammer is formed by what looks to be a very Strong Reversal Pattern, the Inverted Head and Shoulders!
Now we are still waiting for the Confirmation of the Pattern where Price needs to rise to the "Neckline" or Resistance Level.
Once Confirmed, we will look for a Breakout of the Pattern and if Validated, could deliver great Long Opportunities as a Breakout and Retest of the Inverted Head and Shoulders Pattern!
If the Pattern is Successful, we could expect the Price Target to be at the next level of Resistance being the 95.3 - 95.6 Area!
Fundamentally, the BOJ begins the week with Policy Rate decision Monday evening where they forecast a HOLD on Interest Rates, staying at .5%. This could have drastic implications on the JPY, potentially weakening it.

AUD/JPY Bulls Eye 95+ After Bullish ReversalAUD/JPY bounced sharply on Thursday, snapping a 3-day losing streak with a solid bullish-range session. The rally kicked off from a bullish pinbar above 92, where the higher low reinforces support and the broader bullish case.
The 1-hour chart shows a clean breakout from an inverted head and shoulders pattern, pointing to a target around 95.50. With resistance at the April high (95.30), March high (95.75), and the 96 handle, there’s still room for bulls to run.
Dips toward 94 may offer opportunities to join the trend — but a break back below the neckline would shift the tone back to risk-off.
Matt Simpson, Market Analyst at City Index and Forex.com

AUDJPY Potential UpsidesHey Traders, in today's trading session we are monitoring AUDJPY for a buying opportunity around 93.600 zone, AUDJPY is trading in an uptrend and currently is in a correction phase in which it is approaching the trend at 93.600 support and resistance area.
Trade safe, Joe.

AUDJPY SHORT FORECAST Q2 W25 D16 Y25AUDJPY SHORT FORECAST Q2 W25 D16 Y25
Professional Risk Managers👋
Welcome back to another FRGNT chart update📈
Diving into some Forex setups using predominantly higher time frame order blocks alongside confirmation breaks of structure.
Let’s see what price action is telling us today! 👀
💡Here are some trade confluences📝
✅Weekly Order block rejection
✅15' Order block
✅Daily order block identified
🔑 Remember, to participate in trading comes always with a degree of risk, therefore as professional risk managers it remains vital that we stick to our risk management plan as well as our trading strategies.
📈The rest, we leave to the balance of probabilities.
💡Fail to plan. Plan to fail.
🏆It has always been that simple.
❤️Good luck with your trading journey, I shall see you at the very top.
🎯Trade consistent, FRGNT X

AUDJPY Forming A Bullish Set-upAUDJPY is recovering very nicely after touching the 86 support level, which goes back to the 2023 low. That was clearly an important zone from there we’ve seen a sharp and impulsive bounce in the last two months, even breaking above the trendline resistance connected down from the 2024 highs. This breakout suggests that bulls may be back in control and could still drive the pair toward the 98–100 area later this year. If we get a retracement in the near term, keep an eye on the 91.70 - 90.00 zone as potential support.
GH

AUD_JPY MOVE DOWN AHEAD|SHORT|
✅AUD_JPY made a retest of
The strong horizontal resistance of 93.900
Level of 106.083 and as you
Can see the pair is already
Making a local pullback from
The level which sends a clear
Bearish signal to us therefore
We will be expecting a
Further bearish correction
SHORT🔥
✅Like and subscribe to never miss a new idea!✅
Disclosure: I am part of Trade Nation's Influencer program and receive a monthly fee for using their TradingView charts in my analysis.

AUDJPY Will Go Lower From Resistance! Sell!
Take a look at our analysis for AUDJPY.
Time Frame: 30m
Current Trend: Bearish
Sentiment: Overbought (based on 7-period RSI)
Forecast: Bearish
The market is on a crucial zone of supply 93.507.
The above-mentioned technicals clearly indicate the dominance of sellers on the market. I recommend shorting the instrument, aiming at 93.232 level.
P.S
Please, note that an oversold/overbought condition can last for a long time, and therefore being oversold/overbought doesn't mean a price rally will come soon, or at all.
Disclosure: I am part of Trade Nation's Influencer program and receive a monthly fee for using their TradingView charts in my analysis.
Like and subscribe and comment my ideas if you enjoy them!

AUD-JPY Will Go Down! Sell!
Hello,Traders!
AUD-JPY made a retest
A wide horizontal resistance
Around 93.900 from where
We are already seeing a
Local bearish pullback so
We will be expecting
A further bearish move
Down on Monday
Sell!
Comment and subscribe to help us grow!
Check out other forecasts below too!
Disclosure: I am part of Trade Nation's Influencer program and receive a monthly fee for using their TradingView charts in my analysis.

AUDJPY TREND TRADINGLooking to follow the lower time frame bullish trend next week to play into the higher timeframe down trend. Three trade ideas roughly looking to bank 16R. can squeeze more depending on if you market execute from price action signals or just set limit orders with conservative stop loss sizes.

AUDJPY SHORT FORECAST Q2 W24 D13 Y25AUDJPY SHORT FORECAST Q2 W24 D13 Y25
Professional Risk Managers👋
Welcome back to another FRGNT chart update📈
Diving into some Forex setups using predominantly higher time frame order blocks alongside confirmation breaks of structure.
Let’s see what price action is telling us today! 👀
💡Here are some trade confluences📝
✅Weekly Order block rejection
✅15' Order block
✅1H 50EMA
✅Daily order block identified
🔑 Remember, to participate in trading comes always with a degree of risk, therefore as professional risk managers it remains vital that we stick to our risk management plan as well as our trading strategies.
📈The rest, we leave to the balance of probabilities.
💡Fail to plan. Plan to fail.
🏆It has always been that simple.
❤️Good luck with your trading journey, I shall see you at the very top.
🎯Trade consistent, FRGNT X

AUDJPY Bullish Breakout supported at 92.00The AUD/JPY pair is currently maintaining a bullish bias, underpinned by an ongoing uptrend. Recent price action shows sideways consolidation, typically a sign of trend continuation when occurring within an established bullish structure.
Key Level: 91.50
This level marks a prior consolidation zone and now acts as a critical support area.
Bullish Scenario (bounce from 91.50):
A corrective dip to 91.50 followed by a strong bounce would support the bullish continuation.
Upside targets include:
94.20 – Immediate resistance
94.90 – Previous swing high
95.90 – Longer-term resistance
Bearish Scenario (break below 91.50):
A daily close below 91.50 would weaken the bullish outlook.
In this case, downside support levels include:
90.50 – Initial retracement target
89.40 – Deeper support zone
Conclusion
The outlook for AUD/JPY remains bullish while price holds above the key 91.50 support level. A successful bounce from this zone could lead to a retest of higher resistance levels at 94.20 and above. However, a confirmed break below 91.50 would shift sentiment to neutral-to-bearish, potentially triggering further declines toward 90.50 and 89.40. Traders should monitor price behavior at 91.50 for near-term directional cues.
This communication is for informational purposes only and should not be viewed as any form of recommendation as to a particular course of action or as investment advice. It is not intended as an offer or solicitation for the purchase or sale of any financial instrument or as an official confirmation of any transaction. Opinions, estimates and assumptions expressed herein are made as of the date of this communication and are subject to change without notice. This communication has been prepared based upon information, including market prices, data and other information, believed to be reliable; however, Trade Nation does not warrant its completeness or accuracy. All market prices and market data contained in or attached to this communication are indicative and subject to change without notice.

AUDJPY SHORT FORECAST Q2 W24 D12 Y25AUDJPY SHORT FORECAST Q2 W24 D12 Y25
Professional Risk Managers👋
Welcome back to another FRGNT chart update📈
Diving into some Forex setups using predominantly higher time frame order blocks alongside confirmation breaks of structure.
Let’s see what price action is telling us today! 👀
💡Here are some trade confluences📝
✅Weekly Order block rejection
✅15' Order block
✅1H 50EMA
✅Daily 50 EMA
🔑 Remember, to participate in trading comes always with a degree of risk, therefore as professional risk managers it remains vital that we stick to our risk management plan as well as our trading strategies.
📈The rest, we leave to the balance of probabilities.
💡Fail to plan. Plan to fail.
🏆It has always been that simple.
❤️Good luck with your trading journey, I shall see you at the very top.
🎯Trade consistent, FRGNT X

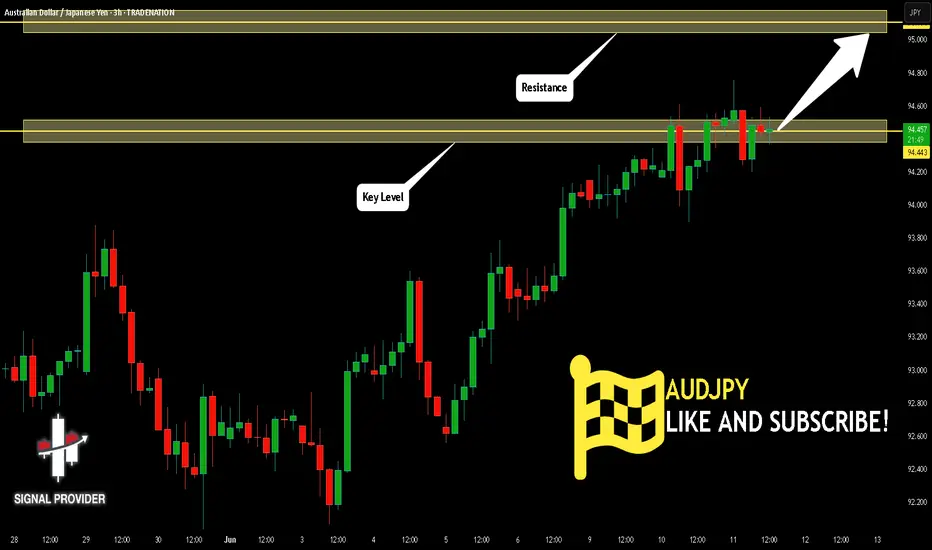
AUDJPY Is Bullish! Long!
Here is our detailed technical review for AUDJPY.
Time Frame: 3h
Current Trend: Bullish
Sentiment: Oversold (based on 7-period RSI)
Forecast: Bullish
The market is trading around a solid horizontal structure 94.443.
The above observations make me that the market will inevitably achieve 95.104 level.
P.S
We determine oversold/overbought condition with RSI indicator.
When it drops below 30 - the market is considered to be oversold.
When it bounces above 70 - the market is considered to be overbought.
Disclosure: I am part of Trade Nation's Influencer program and receive a monthly fee for using their TradingView charts in my analysis.
Like and subscribe and comment my ideas if you enjoy them!