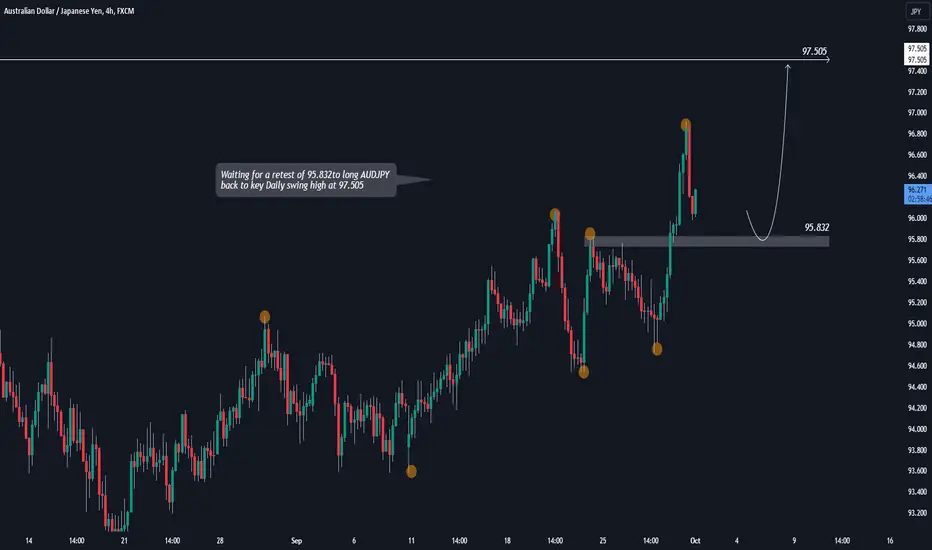
AUDJPY LONG - CONFIRMATION SOON!Waiting for a retest of 95.832to long AUDJPY back to key Daily swing high at 97.505
If you agree drop a like and if you have any questions leave a comment :)
AUDJPY
Multiple timeframesThe daily timeframe closed with a shooting star candlestick, respected the daily supply and simultaneously made an internal liquidity sweep, this is a good indication that we’re in a bearish market. We are now waiting for price to activate the extreme supply to get good entries because sellers are taking over due to the idea that we a break of market structure followed by a market structure shift. We are looking for a 1:5 leverage in this trade…

AUDJPY Trading IdeaBased on Simple Technical Analysis ( Trendline + Support & Resistance )
Risk Disclaimer:
Please be advised that I am not telling anyone how to spend or invest their money. Take all of my analysis as my own opinion, as entertainment, and at your own risk. I assume no responsibility or liability for any errors or omissions in the content of this page, and they are for educational purposes only. Any action you take on the information in these analysis is strictly at your own risk. There is a very high degree of risk involved in trading. Past results are not indicative of future returns. Good luck :-)

AUD-JPY Bullish Bias! Buy!
Hello,Traders!
AUD-JPY is trading in an
Uptrend and the pair broke
The key horizontal level
Of 95.559 so I will be
Expecting price growth
Next trading week
Buy!
Like, comment and subscribe to help us grow!
Check out other forecasts below too!

AUDJPY: Riding the Bullish Wave as the Yen Creates New LowHi Fellow Forex Traders,
AUDJPY has broken out of the falling wedge pattern, continuing its bullish price movement above the EMA200 line. Subsequently, the price formed a breakout pennant pattern, which suggests a continuation of the bullish trend. The MACD indicator has also produced a golden cross, confirming a potential upward movement towards the target area. We are also anticipating a possible pullback scenario after reaching the first target, followed by a continuation of its upward trajectory towards the second target.
Other Technical Factor
The JPYBasket is currently trading below the EMA200 line. This is followed by an impulsive breakout of the pennant pattern, further bolstering the upside movement of the Aussie Yen.
It is essential to note that the analysis will no longer hold validity once the target/support area is reached.
Please support the channel by engaging with the content, using the rocket button, and sharing your opinions in the comments below!
Disclaimer:
"Please note that this analysis is solely for educational purposes and should not be considered a recommendation to take a long or short position on FX:AUDJPY ."

Dancing into the Monthly Candle Closure 🩻AudJpyIn our last Analysis, we Called out Longs on AudJpy on Sept 3rd and we can observe a phenomenal 180 pips increase in price since then.
0:0 Monthly timeframe bigger picture
1:37 Weekly timeframe
4:45 Daily timeframe
8:11 4hr timeframe
11:19 1hr timeframe
12:30 Bias
Audjpy increased during the Month of September. At ShrewdCatFx, we were able to anticpate this increase by observing where candles close. Specifically, the weekly candle to close the month of August was especially telling of potential upside. This candle was the tell, thats it. Price has been trending up on Higher timeframes (Monthly/Weekly) ever since the pandemic. We have bullish market structure on the Monthly timeframe... and so when we got confirmation of a flip to bullish market structure on the weekly timeframe .. that was our hint. We'll have to see how this September monthly candle closes in comparison to the monthly resistance level that we are currently testing at 96.135. If we close above = confirms for more buys in October. If not, then we observe Audjpy go into a range to begin the 4th quarter 2023'.

💡⬆️ AUD/JPY High probability long setup.Hi traders. On this pair we have the 12H candle that has broken above major resistance. We will pay close attention as it could be a fake out. We will also continue to watch over the next 4 hours more signs of bullish momentum. We have great RR on this setup.


AUDJPYAUDJPY is in strong bullish trend.
As the market is consistently printing new HHs and HLs.
currently the market is retracing a bit after last HH, which is also the 50% fib retracement level and the previous broken resistance might be turning as a support. if the market successfully sustain this bullish confluence the next leg high could be 96.

AUD/JPY: A CURRENCY PAIR IN THE SPOTLIGHTKey fundamental factors to watch for in the AUD/JPY currency pair:
Australian economic data: The AUD is sensitive to data releases such as GDP growth, unemployment rate, and retail sales. Positive economic data releases tend to boost the AUD, while negative data releases tend to weigh on the currency.
Japanese economic data: The JPY is sensitive to data releases such as GDP growth, industrial production, and inflation. Positive economic data releases tend to weigh on the JPY, while negative data releases tend to boost the currency.
Risk sentiment: The AUD/JPY currency pair is sensitive to risk sentiment in the global market. When risk sentiment is strong, the AUD tends to rise against the JPY. When risk sentiment is weak, the JPY tends to rise against the AUD.
Interest rate expectations: The AUD/JPY currency pair is sensitive to shifts in interest rate expectations between Australia and Japan. If interest rates are expected to rise in Australia relative to Japan, the AUD tends to rise against the JPY.
Technical Analysis
30-Minute Chart
The AUD/JPY currency pair is currently trading in a bullish trend on the 30-minute chart. The price is above the 50 and 200-period moving averages, and the MACD indicator is above the signal line. The RSI indicator is also above 50, which indicates that the pair is not overbought.
According to the Elliot Wave Theory, on the 30min chart, we are now forming a Wave C on the downside. If the analysis is valid, the marked levels (or around them) will be touched and then the downtrend will continue for a short-medium term, before the market resumes its uptrend, forming a next impulsive wave on the upside.
Key technical levels to watch on the 30-minute chart:
Support: 95.059, 95.132, 95.173
Resistance: 95.246, 95.278, 95.351
4-Hour Chart
The AUD/JPY currency pair is also trading in a bullish trend on the 4-hour chart. The price is above the 50 and 200-period moving averages, and the MACD indicator is above the signal line. The RSI indicator is also above 50, which indicates that the pair is not overbought.
Key technical levels to watch on the 4-hour chart:
Support: 95.059, 95.132, 95.173
Resistance: 95.246, 95.278, 95.351
Daily Chart
The AUD/JPY currency pair is trading in a neutral trend on the daily chart. The price is between the 50 and 200-period moving averages, and the MACD indicator is crossing above the signal line. The RSI indicator is also at 50, which indicates that the pair is neither overbought nor oversold.
Key technical levels to watch on the daily chart:
Support: 95.059, 94.958, 94.857
Resistance: 95.246, 95.351, 95.456
Overall Outlook
The AUD/JPY currency pair is currently trading in a bullish trend on the 30-minute and 4-hour charts. However, the pair is trading in a neutral trend on the daily chart.
Bullish traders will be looking for a break above the 95.246 resistance level on the 30-minute and 4-hour charts. A break above this level could lead to a further rally towards the 95.351 resistance level.
Bearish traders will be looking for a break below the 95.059 support level on the 30-minute and 4-hour charts. A break below this level could lead to a further decline towards the 94.958 support level.
**Traders should also pay attention to the overall risk sentiment in the global market.
I hope this post is helpful.
This analysis represents the information at the date it is posted.
This analysis does not represent professional and/or financial advice.
You alone assume the sole responsibility of evaluating the merits and risks associated with the use of any information or other content found on this profile before making any decisions based on such information.
Any feedback is encouraged and appreciated. Thank you and have a nice day


AUDJPY - Short active ✅Hello traders!
‼️ This is my perspective on AUDJPY.
Technical analysis: We have here perfect confirmation for a short position. Firstly price filled to the pip daily imbalance, then it changed the character and mitigated bearish order block.
Fundamental analysis: On Wednesday will be released yearly CPI on AUD, so pay attention in to the result in order to validate the analysis.
Like, comment and subscribe to be in touch with my content!

AUDJPY Trading IdeaBased on Simple Technical Analysis ( Trendline + Support & Resistance )
Risk Disclaimer:
Please be advised that I am not telling anyone how to spend or invest their money. Take all of my analysis as my own opinion, as entertainment, and at your own risk. I assume no responsibility or liability for any errors or omissions in the content of this page, and they are for educational purposes only. Any action you take on the information in these analysis is strictly at your own risk. There is a very high degree of risk involved in trading. Past results are not indicative of future returns. Good luck :-)

AUDJPY Technical Analysis and Trade Idea Asian SessionAnalysing the AUDJPY currency pair, it's evident that it has encountered a pivotal support level following a robust bearish momentum. Presently, price appears overextended, which may trigger a retracement.
As always, comprehensive insights are provided in the accompanying video, where we delve into aspects such as price action, market structure, and other critical elements of technical analysis. It's essential to emphasize that the content presented here is solely for educational purposes and should not be construed as financial advice. It is paramount to exercise prudent risk management practices when engaging in trading activities.

AUDJPYAUDJPY is in strong bullish trend.
As the market is consistently printing new HHs and HLs.
currently the market is retracing a bit after last HH, which is also the 50% fib retracement level and the previous broken resistance might be turning as a support. if the market successfully sustain this bullish confluence the next leg high could be back to highs.

AUDJPY: Forecast & Trading Plan
Remember that we can not, and should not impose our will on the market but rather listen to its whims and make profit by following it. And thus shall be done today on the AUDJPY pair which is likely to be pushed up by the bulls so we will buy!
❤️ Please, support our work with like & comment! ❤️

AUD/JPY: A Currency Pair Poised for GrowthAUD/JPY currency pair is trading at around the marked levels. Please read the analysis on the chart, as well as the explanations in the comments. Thank you.
Technical Analysis:
On the 30-minute chart, the AUD/JPY currency pair is trading in a bullish trend. The price is above the 50-period and 200-period simple moving averages. The MACD indicator is also bullish, with the signal line above the MACD line.
The Elliot Wave Analysis in this case shows a continuation of the bullish impulse. I marked the first potential level of the Wave 5. It can extend after that level, or a correction may start (short term).
On the 4-hour chart, the AUD/JPY currency pair is also trading in a bullish trend. The price is above the 50-period and 200-period simple moving averages. The MACD indicator is also bullish, with the signal line above the MACD line.
On the daily chart, the AUD/JPY currency pair is trading in a bullish trend. The price is above the 50-period and 200-period simple moving averages. The MACD indicator is also bullish, with the signal line above the MACD line.
Overall, the fundamental and technical analysis suggests that the AUD/JPY currency pair is likely to continue trading in a bullish trend in the near term.
Fundamental Analysis:
The Australian economy is currently facing a number of challenges, including a slowdown in China, rising inflation, and a trade deficit. However, the Australian economy is still expected to grow at a modest pace in 2023.
The Japanese economy is also facing a number of challenges, including an aging population, a shrinking workforce, and a high debt burden. However, the Japanese economy is expected to avoid recession in 2023.
I hope this post is helpful.
This analysis represents my thoughts at the date it is posted.
This analysis does not represent professional and/or financial advice.
You alone assume the sole responsibility of evaluating the merits and risks associated with the use of any information or other content found on this profile before making any decisions based on such information.
Any feedback is encouraged and appreciated. Thank you and have a nice day!

AUDJPY to see a lower correction?AUDJPY - 24h expiry
There is no clear indication that the upward move is coming to an end.
Although we remain bullish overall, a correction is possible with plenty of room to move lower without impacting the trend higher.
Risk/Reward would be poor to call a buy from current levels.
The RSI is trending higher.
A move through 95.75 will confirm the bullish momentum.
We look to Buy at 95.00 (stop at 94.68)
Our profit targets will be 95.80 and 96.10
Resistance: 95.75 / 96.00 / 96.25
Support: 95.25 / 95.00 / 94.50
Risk Disclaimer
The trade ideas beyond this page are for informational purposes only and do not constitute investment advice or a solicitation to trade. This information is provided by Signal Centre, a third-party unaffiliated with OANDA, and is intended for general circulation only. OANDA does not guarantee the accuracy of this information and assumes no responsibilities for the information provided by the third party. The information does not take into account the specific investment objectives, financial situation, or particular needs of any particular person. You should take into account your specific investment objectives, financial situation, and particular needs before making a commitment to trade, including seeking advice from an independent financial adviser regarding the suitability of the investment, under a separate engagement, as you deem fit.
You accept that you assume all risks in independently viewing the contents and selecting a chosen strategy.
Where the research is distributed in Singapore to a person who is not an Accredited Investor, Expert Investor or an Institutional Investor, Oanda Asia Pacific Pte Ltd (“OAP“) accepts legal responsibility for the contents of the report to such persons only to the extent required by law. Singapore customers should contact OAP at 6579 8289 for matters arising from, or in connection with, the information/research distributed.

AUDJPY Strong Lower Highs bullish break-out.The AUDJPY pair has turned the 1D MA50 (blue trend-line) into Support since last week's bullish break-out signal above the Lower Highs trend-line. That is a major bullish continuation call following the bottom on the 3-month Higher Lows Zone on March 27. The dashed Higher Lows has been supporting this uptrend and this seems to be the new bullish leg. The previous two such rises during these 3 years have reached at least +17.40%. As a result our buy target is 101.000.
-------------------------------------------------------------------------------
** Please LIKE 👍, FOLLOW ✅, SHARE 🙌 and COMMENT ✍ if you enjoy this idea! Also share your ideas and charts in the comments section below! **
-------------------------------------------------------------------------------
💸💸💸💸💸💸
👇 👇 👇 👇 👇 👇

AUD-JPY Bearish Bias! Sell!
Hello,Traders!
AUD-JPY is about to hit
A supply area of around 95.8
Which makes me locally
Bearish biased and I think
That we will see a local move down
Sell!
Like, comment and subscribe to help us grow!
Check out other forecasts below too!

AUDJPY Short Term Buy IdeaD1 - Bullish trend pattern followed by a pullback.
Price respected a strong support zone and is currently bouncing higher.
No opposite signs.
H1 - Bullish trend pattern.
Currently it looks like a pullback is happening.
Until the two strong support zones hold my short term view remains bullish here.

AUDJPY: Expecting a strong start to the week before BoJI'm expecting continued Aussie strength as the market expects China recovery is in progress.
BoJ interest rate and minutes will be big news on Friday, but before then I expect to see a continuation up within the current rising channel, breaking and retest initial support around 95.6 to rise to test the 96.6 support.
We're heading into very choppy waters now, and I expect BoJ to start defending their currency so I'm mindful to have very tight SL's up here, moving to BE as soon as possible and ultimately preparing for a reversal, but I think there's a little way to go yet.
With Aussie building momentum I feel confident in still being long here, but being uber-careful as you never know what will happen!

AUD/JPY Forecast: Analyzing the Future OutlookThe Aussie Yen made an attempt to breach the key resistance levels of 94.93 and 95.05. It successfully surpassed these levels during trading on Friday, but encountered resistance, preventing further upward movement. In this week, my strategy entails vigilant monitoring of the 95.05 zone, with the intention of executing a trade aimed at returning to the established trading range from that point onwards.
