AUD-JPY Risky Short! Sell!
Hello,Traders!
AUD-JPY grew up fast
But then hit a horizontal
Resistance level of 95.750
From where we are already
Seeing a nice pullback
And we will be expecting
A further local move down
Sell!
Comment and subscribe to help us grow!
Check out other forecasts below too!
Disclosure: I am part of Trade Nation's Influencer program and receive a monthly fee for using their TradingView charts in my analysis.
AUDJPY

AUDJPY SHORT FORECAST Q2 W20 D14 Y25AUDJPY SHORT FORECAST Q2 W20 D14 Y25
Professional Risk Managers👋
Welcome back to another FRGNT chart update📈
Diving into some Forex setups using predominantly higher time frame order blocks alongside confirmation breaks of structure.
Let’s see what price action is telling us today!
💡Here are some trade confluences📝
✅Weekly order block rejection
✅Daily order block rejection
✅15' order block targets
✅Gap to be filled
🔑 Remember, to participate in trading comes always with a degree of risk, therefore as professional risk managers it remains vital that we stick to our risk management plan as well as our trading strategies.
📈The rest, we leave to the balance of probabilities.
💡Fail to plan. Plan to fail.
🏆It has always been that simple.
❤️Good luck with your trading journey, I shall see you at the very top.
🎯Trade consistent, FRGNT X

AUD/JPY Short Bearish Trade Plan (Conservative Structure-Based Entry)
Entry: 92.40 (Sell Limit at resistance)
Stop Loss: 94.10 (Above weekly structure and fakeout buffer)
Take Profits:
TP1: 89.00 (initial neckline retest)
TP2: 85.50 (structure base)
TP3: 83.00 (macro extension target)

AUDJPY Trade Setup (Bullish Bias)🔥 Setup Summary:
Item Details
Bias: ✅ Bullish
Reasoning:
- Fundamentals strong (expectation no interest rate cuts + CPI bullish)
- JPY weak + overbought COT
- Exogenous: AUD strengthening
- Seasonality bearish short-term BUT medium-term bias bullish
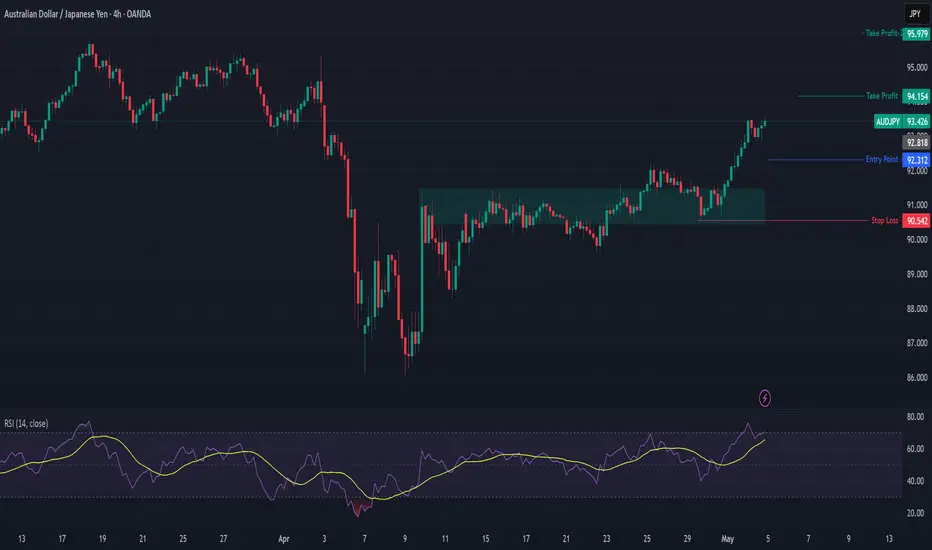
Primary Entry: 🔑 92.30 (Buy Zone)
Dip Buy Zone: 🔄 91.80 – 92.00 (0.5–0.618 Fib retrace)
Stop Loss: 🚫 90.54 (below structure + 0.786 Fib)
Take Profit 1: 🎯 94.15 (below last swing high)
Take Profit 2: 🎯 95.00+ (extended target for trend continuation)
Risk:Reward: ~1:3+ (Entry at 92.3 / TP at 94.15–95.00)
AUDJPY –From Breakdown to Breakout Long Setup After Failed ShortFX:AUDJPY
The short idea was invalidated after price broke above the key resistance zone and hit our stop.
Now, we’re watching for a pullback to the broken zone for a potential long setup, supported by bullish momentum.
Keep it clean. Wait for confirmation.
Stay sharp, stay disciplined.
Smart Forex Analysis | Weekly Setups
Clean charts. No noise. Just levels.

AUDJPY 4HHello traders! As you see we have BOS and Order Flow. In Supply zone you can see exactly RJB which collected liquidity and leave GAP(4H). Here I expecting reversal on LTF = GAP + 0.5 Supply.
Have a profitable day!

AUDJPY Breakout on Rising Yields – Path Open to 95.70AUDJPY is maintaining strong bullish structure after breaking through key resistance around 91.65. Price is forming higher lows supported by an ascending trendline, indicating healthy buyer momentum. Fibonacci retracement levels show price holding above the 50% and 61.8% zones, strengthening the bullish case.
🔑 Key Levels:
Current Price: 91.65
Support Zone: 90.85 – 91.00 (previous structure + fib support)
Resistance Targets:
TP1: 93.15 (previous swing high)
TP2: 95.70 (full recovery move from March highs)
✅ Bullish Confluence Factors:
Ascending triangle breakout in progress
Strong higher lows and clean market structure
Holding above major 61.8% Fib retracement
Australian dollar supported by improved risk sentiment globally
BOJ expected to stay dovish and delay hikes, keeping the yen weak
🧠 Fundamental Context:
Japan Outlook: BOJ to hold rates steady at 0.5% amid US tariff risks. IMF projects a downgrade in Japan’s growth, weakening JPY outlook.
Sentiment on JPY: No strong intervention support for yen despite media noise. Japan’s government denied any push for stronger yen.
Australia Outlook: Risk sentiment steady, equities firmer globally, and higher AUD correlations to risk-on tone favor upside continuation.
💡 Trade Idea:
Bias: Bullish above 91.00
Entry: On confirmation bounce above 91.60
Target 1: 93.15
Target 2: 95.70
Stop Loss: Below 90.50
📌 Note: Watch for possible mild pullback into 91.30-91.50 zone before new upside leg. Strong US data midweek could temporarily lift JPY but broader BOJ dovishness remains the driver.

AUD/JPY SELLERS WILL DOMINATE THE MARKET|SHORT
Hello, Friends!
The BB upper band is nearby so AUD-JPY is in the overbought territory. Thus, despite the uptrend on the 1W timeframe I think that we will see a bearish reaction from the resistance line above and a move down towards the target at around 90.143.
Disclosure: I am part of Trade Nation's Influencer program and receive a monthly fee for using their TradingView charts in my analysis.
✅LIKE AND COMMENT MY IDEAS✅

Possible Next Move AUD JPYLooking at the Daily & 1HR Chart. Bearish trend over all. Likely to take out the Daily FVG to head down to the next significant price zone of 86.981. This area also shows a 1HR liquidity zone.

AUDJPY SHORT FORECAST Q2 W19 D9 Y25AUDJPY SHORT FORECAST Q2 W19 D9 Y25
Professional Risk Managers👋
Welcome back to another FRGNT chart update📈
Diving into some Forex setups using predominantly higher time frame order blocks alongside confirmation breaks of structure.
Let’s see what price action is telling us today!
💡Here are some trade confluences📝
✅Weekly order block rejection
✅Daily order block rejection
✅15' order block targets
✅Weekly imbalance fill targets
🔑 Remember, to participate in trading comes always with a degree of risk, therefore as professional risk managers it remains vital that we stick to our risk management plan as well as our trading strategies.
📈The rest, we leave to the balance of probabilities.
💡Fail to plan. Plan to fail.
🏆It has always been that simple.
❤️Good luck with your trading journey, I shall see you at the very top.
🎯Trade consistent, FRGNT X

AUDJPY Set to Slide – Targeting 91.560
AUDJPY is currently showing signs of a bearish continuation after a corrective pullback from the recent swing low. Price has retraced up to the 0.786 Fibonacci level (92.447) and is now stalling below the key resistance zone near 93.200, which aligns with the 0.382–0.5 retracement levels. This confluence zone acts as a supply area, increasing the probability of downside movement.
🟩 Support Zone to Watch:
A major support and expected price reaction is anticipated around 91.560, which coincides with the 1.618 Fibonacci extension level. Further continuation may test deeper zones near 91.093 or even 90.800 if bearish momentum strengthens.
📰 Fundamental Outlook:
- 🇦🇺 Australia RBA Policy Hold: The Reserve Bank of Australia (RBA) held interest rates steady recently, signaling cautious optimism but refrained from any hawkish guidance. Markets have priced out further hikes, weakening AUD sentiment.
- 🇯🇵 BOJ Dovish Shift Easing: The Bank of Japan has started to unwind ultra-loose policy, hinting at more flexibility in yield control. This has brought some relief to the JPY, adding pressure on JPY pairs like AUDJPY.
- 📉 Risk Sentiment Cooling: Global equities have shown weakness due to concerns over slower Chinese growth and geopolitical tensions, making safe-haven assets like the Japanese Yen more attractive.

AUDJPY rising wedge resistance at 92.90The AUDJPY currency pair remains in a bearish trend, with the recent price action showing signs of an oversold bounce. While a temporary rebound is in play, the broader sentiment remains weak unless a decisive breakout occurs.
Key Levels to Watch:
Resistance Levels: 92.90 (critical level), 93.84, 94.60, and 95.50
Support Levels: 90.33, 89.79, 88.70
Bearish Scenario:
A rejection from the 92.90 resistance level could reaffirm the downside bias, leading to a continuation of the bearish move toward 90.33, with extended declines targeting 89.79 and 88.70 over the longer timeframe.
Bullish Scenario:
A breakout above 92.90 with a daily close above this level would challenge the bearish sentiment, opening the door for further gains toward 93.84, followed by 94.60 and 95.50.
Conclusion:
The market sentiment remains bearish, with 92.90 acting as a critical resistance zone. A rejection from this level could reinforce the downtrend, while a confirmed breakout would shift the outlook to bullish, favouring further upside. Traders should closely monitor price action at this key level for confirmation.
This communication is for informational purposes only and should not be viewed as any form of recommendation as to a particular course of action or as investment advice. It is not intended as an offer or solicitation for the purchase or sale of any financial instrument or as an official confirmation of any transaction. Opinions, estimates and assumptions expressed herein are made as of the date of this communication and are subject to change without notice. This communication has been prepared based upon information, including market prices, data and other information, believed to be reliable; however, Trade Nation does not warrant its completeness or accuracy. All market prices and market data contained in or attached to this communication are indicative and subject to change without notice.

AUDJPY SHORT FORECAST Q2 W19 D7 Y25AUDJPY SHORT FORECAST Q2 W19 D7 Y25
Professional Risk Managers👋
Welcome back to another FRGNT chart update📈
Diving into some Forex setups using predominantly higher time frame order blocks alongside confirmation breaks of structure.
Let’s see what price action is telling us today!
💡Here are some trade confluences📝
✅Weekly order block rejection
✅Daily order block rejection
✅15' order block targets
✅Weekly imbalance fill targets
🔑 Remember, to participate in trading comes always with a degree of risk, therefore as professional risk managers it remains vital that we stick to our risk management plan as well as our trading strategies.
📈The rest, we leave to the balance of probabilities.
💡Fail to plan. Plan to fail.
🏆It has always been that simple.
❤️Good luck with your trading journey, I shall see you at the very top.
🎯Trade consistent, FRGNT X

AUD-JPY Free Signal! Buy!
Hello,Traders!
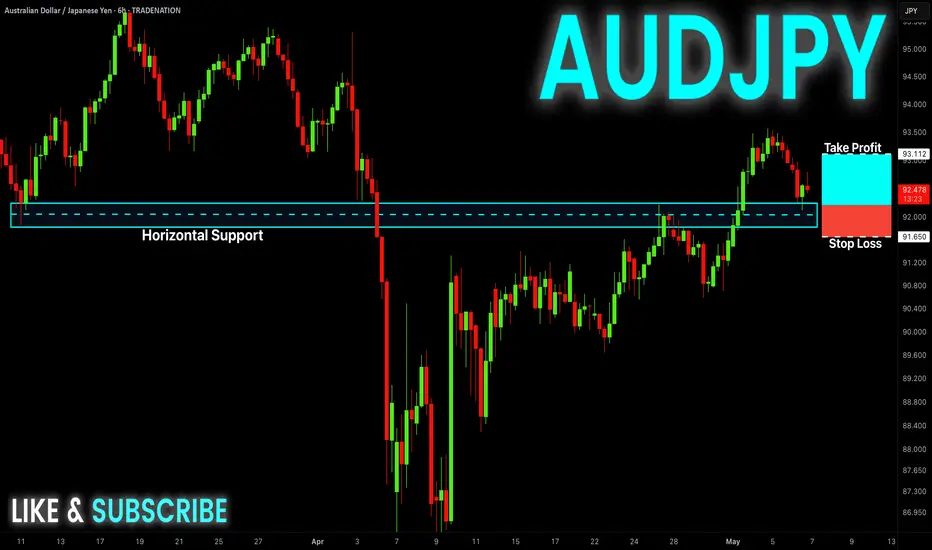
AUD-JPY is trading in an
Uptrend so we are bullish
Biased and as the pair is
Retesting a horizontal
Support level around 92.000
We can go long with the
Take Profit of 93.112 and
The Stop Loss of 91.650
Buy!
Comment and subscribe to help us grow!
Check out other forecasts below too!
Disclosure: I am part of Trade Nation's Influencer program and receive a monthly fee for using their TradingView charts in my analysis.
AUDJPY Buyers In Panic! SELL!
My dear subscribers,
AUDJPY looks like it will make a good move, and here are the details:
The market is trading on 93.104 pivot level.
Bias - Bearish
My Stop Loss - 94.128
Technical Indicators: Both Super Trend & Pivot HL indicate a highly probable Bearish continuation.
Target - 91.339
About Used Indicators:
The average true range (ATR) plays an important role in 'Supertrend' as the indicator uses ATR to calculate its value. The ATR indicator signals the degree of price volatility.
Disclosure: I am part of Trade Nation's Influencer program and receive a monthly fee for using their TradingView charts in my analysis.
———————————
WISH YOU ALL LUCK
AUD/JPY "Aussie vs Yen" Forex Bank Heist Plan(Swing/Day)🌟Hi! Hola! Ola! Bonjour! Hallo! Marhaba!🌟
Dear Money Makers & Robbers, 🤑 💰💸✈️
Based on 🔥Thief Trading style technical and fundamental analysis🔥, here is our master plan to heist the AUD/JPY "Aussie vs Yen" Forex Bank. Please adhere to the strategy I've outlined in the chart, which emphasizes long entry. Our aim is to escape near the high-risk ATR Zone. Risky level, overbought market, consolidation, trend reversal, trap at the level where traders and bearish robbers are stronger. 🏆💸"Take profit and treat yourself, traders. You deserve it!💪🏆🎉
Entry 📈 : "The vault is wide open! Swipe the Bullish loot at any price - the heist is on!
however I advise to Place buy limit orders within a 15 or 30 minute timeframe nearest or swing low or high level for pullback entries.
Stop Loss 🛑:
📍 Thief SL placed at the recent/swing low level Using the 1H timeframe (89.000) Day/Swing trade basis.
📍 SL is based on your risk of the trade, lot size and how many multiple orders you have to take.
Target 🎯: 94.200
🧲Scalpers, take note 👀 : only scalp on the Long side. If you have a lot of money, you can go straight away; if not, you can join swing traders and carry out the robbery plan. Use trailing SL to safeguard your money 💰.
💰💵💴💸AUD/JPY "Aussie vs Yen" Forex Bank Heist Plan (Day / Swing Trade) is currently experiencing a bullishness🐂.., driven by several key factors.☝☝☝
📰🗞️Get & Read the Fundamental, Macro Economics, COT Report, Quantitative Analysis, Sentimental Outlook, Intermarket Analysis, Future trend targets... go ahead to check 👉👉👉🔗🔗
Detailed Explanation Point-by-Point 🧠
1. **Fundamental Analysis** 📊: AUD strength hinges on RBA policy and China’s demand, while JPY reacts to BoJ dovishness and safe-haven flows. A tug-of-war dynamic. ⚔️
2. **Macro Economics** 🌎: Australia’s trade-driven growth contrasts Japan’s structural challenges, supporting a balanced but AUD-leaning pair. 🦘🏯
3. **Global Market Analysis** 🌍: Risk sentiment drives the pair, with commodities and equities as key influencers. 🎢
4. **COT Data** 📑: Bullish speculator positioning aligns with price stability but warns of reversal risks. ⚠️
5. **Seasonality** 📅: Mixed April trends emphasize real-time catalysts over historical patterns. 🤔
6. **Intermarket Analysis** 🔗: Yield spreads and equity correlations reinforce risk sensitivity. 📈
7. **Quantitative Analysis** 📉: Consolidation at 90.900 signals a looming breakout with defined levels. 🚀
8. **Market Sentiment** 😊: Retail bullishness vs. institutional caution suggests potential surprises. 🗣️
9. **Trend Prediction** 🔮: Multi-timeframe targets offer actionable levels for bullish and bearish scenarios. 🎯
10. **Outlook** 📝: A 6/10 score reflects optimism tempered by risks, guiding a long bias with vigilance. 😊
⚠️Trading Alert : News Releases and Position Management 📰 🗞️ 🚫🚏
As a reminder, news releases can have a significant impact on market prices and volatility. To minimize potential losses and protect your running positions,
we recommend the following:
Avoid taking new trades during news releases
Use trailing stop-loss orders to protect your running positions and lock in profits
💖Supporting our robbery plan 💥Hit the Boost Button💥 will enable us to effortlessly make and steal money 💰💵. Boost the strength of our robbery team. Every day in this market make money with ease by using the Thief Trading Style.🏆💪🤝❤️🎉🚀
I'll see you soon with another heist plan, so stay tuned 🤑🐱👤🤗🤩

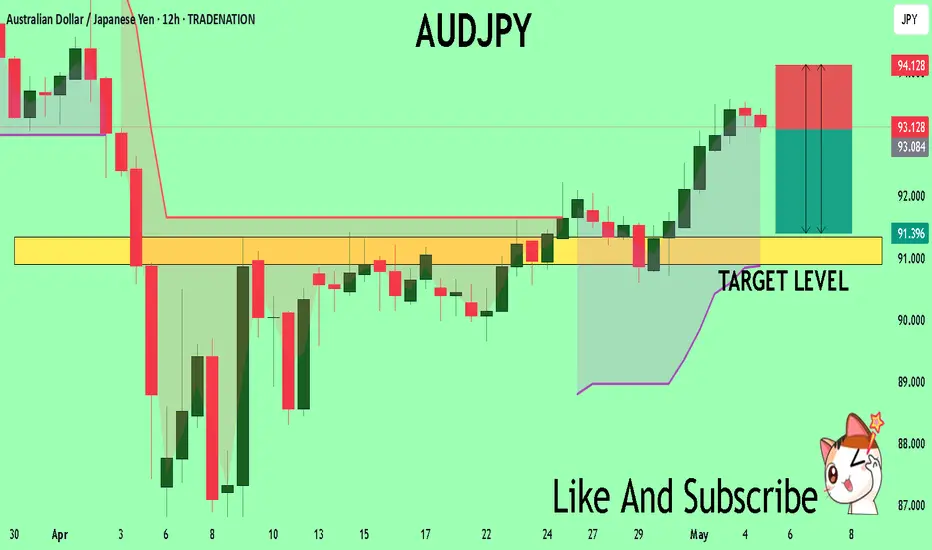
Bullish continuation?AUD/JPY is falling towards the pivot which is an overlap support and could bounce to the 1st resistance.
Pivot: 92.12
1st Support: 90.68
1st Resistance: 94.59
Risk Warning:
Trading Forex and CFDs carries a high level of risk to your capital and you should only trade with money you can afford to lose. Trading Forex and CFDs may not be suitable for all investors, so please ensure that you fully understand the risks involved and seek independent advice if necessary.
Disclaimer:
The above opinions given constitute general market commentary, and do not constitute the opinion or advice of IC Markets or any form of personal or investment advice.
Any opinions, news, research, analyses, prices, other information, or links to third-party sites contained on this website are provided on an "as-is" basis, are intended only to be informative, is not an advice nor a recommendation, nor research, or a record of our trading prices, or an offer of, or solicitation for a transaction in any financial instrument and thus should not be treated as such. The information provided does not involve any specific investment objectives, financial situation and needs of any specific person who may receive it. Please be aware, that past performance is not a reliable indicator of future performance and/or results. Past Performance or Forward-looking scenarios based upon the reasonable beliefs of the third-party provider are not a guarantee of future performance. Actual results may differ materially from those anticipated in forward-looking or past performance statements. IC Markets makes no representation or warranty and assumes no liability as to the accuracy or completeness of the information provided, nor any loss arising from any investment based on a recommendation, forecast or any information supplied by any third-party.

Potential bearish drop off pullback resistance?AUD/JPY is reacting off the resistance level which is a pullback resistance that lines up with the 161.8% Fibonacci extension and the 100% Fibonacci projection and could drop from this level to our take profit.
Entry: 93.33
Why we like it:
There is a pullback resistance level that aligns with the 161.8% Fibonacci extension and the 100% Fibonacci projection.
Stop loss: 94.40
Why we like it:
There is an overlap resistance level.
Take profit: 92.12
Why we like it:
There is an overlap support level that lines up with the 50% Fibonacci retracement.
Enjoying your TradingView experience? Review us!
Please be advised that the information presented on TradingView is provided to Vantage (‘Vantage Global Limited’, ‘we’) by a third-party provider (‘Everest Fortune Group’). Please be reminded that you are solely responsible for the trading decisions on your account. There is a very high degree of risk involved in trading. Any information and/or content is intended entirely for research, educational and informational purposes only and does not constitute investment or consultation advice or investment strategy. The information is not tailored to the investment needs of any specific person and therefore does not involve a consideration of any of the investment objectives, financial situation or needs of any viewer that may receive it. Kindly also note that past performance is not a reliable indicator of future results. Actual results may differ materially from those anticipated in forward-looking or past performance statements. We assume no liability as to the accuracy or completeness of any of the information and/or content provided herein and the Company cannot be held responsible for any omission, mistake nor for any loss or damage including without limitation to any loss of profit which may arise from reliance on any information supplied by Everest Fortune Group.

AUD-JPY Risky Short! Sell!
Hello,Traders!
AUD-JPY went up and hit
A horizontal supply area
Around 93.597 from where
We are already seeing a local
Bearish pullback so we are
Bearish biased and we will
Be expecting a local
Bearish correction
Buy!
Comment and subscribe to help us grow!
Check out other forecasts below too!
Disclosure: I am part of Trade Nation's Influencer program and receive a monthly fee for using their TradingView charts in my analysis.

AUDJPY, our risk on/off monitor, is near a key resistance areaAUDJPY has been on a good run lately. The driving force behind it was the improved market sentiment due to the calming moment in the tariff wars. Can this be sustained?
Let's look at the technical picture of AUDJPY.
Let us know what you think in the comments below.
Thank you.
77.3% of retail investor accounts lose money when trading CFDs with this provider. You should consider whether you understand how CFDs work and whether you can afford to take the high risk of losing your money. Past performance is not necessarily indicative of future results. The value of investments may fall as well as rise and the investor may not get back the amount initially invested. This content is not intended for nor applicable to residents of the UK. Cryptocurrency CFDs and spread bets are restricted in the UK for all retail clients.

AUDJPY...SHORTFX:AUDJPY
The zone has historically acted as a wall for price. Let's see if it does the same again. In current conditions, caution is key.
If it fails this time and we get a proper pullback, it could be the start of a trend shift.

Potential bullish rise?AUD/JPY has reacted off the pivot and could rise to the 1st resistance.
Pivot: 92.12
1st Support: 90.68
1st Resistance: 95.35
Risk Warning:
Trading Forex and CFDs carries a high level of risk to your capital and you should only trade with money you can afford to lose. Trading Forex and CFDs may not be suitable for all investors, so please ensure that you fully understand the risks involved and seek independent advice if necessary.
Disclaimer:
The above opinions given constitute general market commentary, and do not constitute the opinion or advice of IC Markets or any form of personal or investment advice.
Any opinions, news, research, analyses, prices, other information, or links to third-party sites contained on this website are provided on an "as-is" basis, are intended only to be informative, is not an advice nor a recommendation, nor research, or a record of our trading prices, or an offer of, or solicitation for a transaction in any financial instrument and thus should not be treated as such. The information provided does not involve any specific investment objectives, financial situation and needs of any specific person who may receive it. Please be aware, that past performance is not a reliable indicator of future performance and/or results. Past Performance or Forward-looking scenarios based upon the reasonable beliefs of the third-party provider are not a guarantee of future performance. Actual results may differ materially from those anticipated in forward-looking or past performance statements. IC Markets makes no representation or warranty and assumes no liability as to the accuracy or completeness of the information provided, nor any loss arising from any investment based on a recommendation, forecast or any information supplied by any third-party.

AUD_JPY SHORT FROM RESISTANCE|
✅AUD_JPY will be retesting a resistance level of 93.500 soon
From where I am expecting a bearish reaction
With the price going down but we need
To wait for a reversal pattern to form
Before entering the trade, so that we
Get a higher success probability of the trade
SHORT🔥
✅Like and subscribe to never miss a new idea!✅
Disclosure: I am part of Trade Nation's Influencer program and receive a monthly fee for using their TradingView charts in my analysis.
