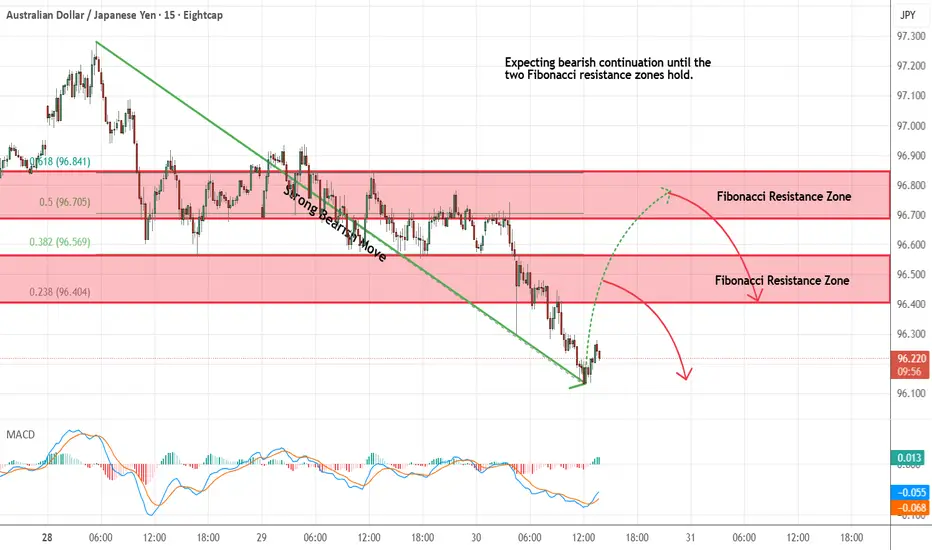
AUDJPY - Looking To Sell Pullbacks In The Short TermM15 - Strong bearish move.
No opposite signs.
Currently it looks like a pullback is happening.
Expecting bearish continuation until the two Fibonacci resistance zones hold.
If you enjoy this idea, don’t forget to LIKE 👍, FOLLOW ✅, SHARE 🙌, and COMMENT ✍! Drop your thoughts and charts below to keep the discussion going. Your support helps keep this content free and reach more people! 🚀
--------------------------------------------------------------------------------------------------------------------
Audjpybearish
AUDJPY Short Term Sell IdeaH1 - Bearish trend pattern
Strong bearish momentum
Until the strong resistance zone holds I expect the price to move lower further after pullbacks.

AUDJPY - Looking To Sell Pullbacks In The Short TermH1 - Strong bearish momentum.
Lower lows.
No opposite signs.
Until the strong resistance zone holds I expect the price to move lower further after pullbacks.

AUDJPY Short Term Sell IdeaH4 - Most recent uptrend line breakout.
Lower lows.
Expecting short term bearish moves to happen here.
H1 - Bearish trend pattern.
Currently it looks like a pullback is happening.
Until the strong resistance zone holds I expect the price to move lower further after pullbacks.

AUDJPY seems BearishAs we can see that AUDJPY strongly breakout its trend line and now moving downside. I believe that this journey may be continue.

AUDJPY is in Bearish ModeAs we can see in the above chart, that AUDJPY has successfully rejected its resistance and also rejected its trend line from the above which is indicating that the market will fall to its near support.

AUDJPY REVERSAL SCENARIOAs we can see
Audjpy just making lower high and stuck at fibo 0.618 @4H timeframe
so if we breakdown to lower timeframe we can see beautiful pattern such as Friendline pattern and Bearish flag very clear
and i expect audjpy will drop to support zone approximately 420 pips @79.246
this trade high probability
if you guys follow my set up
watch your RISK
thankyou , salam cuan !

AUDJPY BEARISHI see a downward price movement to my 61.8 fib @79.915
JPY is strong against all pairs, and with a weak dollar, the outlook of AUDJPY is not bullish at all.

AUDJPY Next ResistancesAUDJPY looks to be a long term buy on the daily time frame and it will probably test a few resistances again that were set a long time ago. So for now AUDJPY remains a big buy!
What would validate a sell? Well a break of the lower range and a break of the previous resistance that just has been broken will validate a sell. So either hop on the bull train or have some patience and see if it will go back down below the broken resistance!
