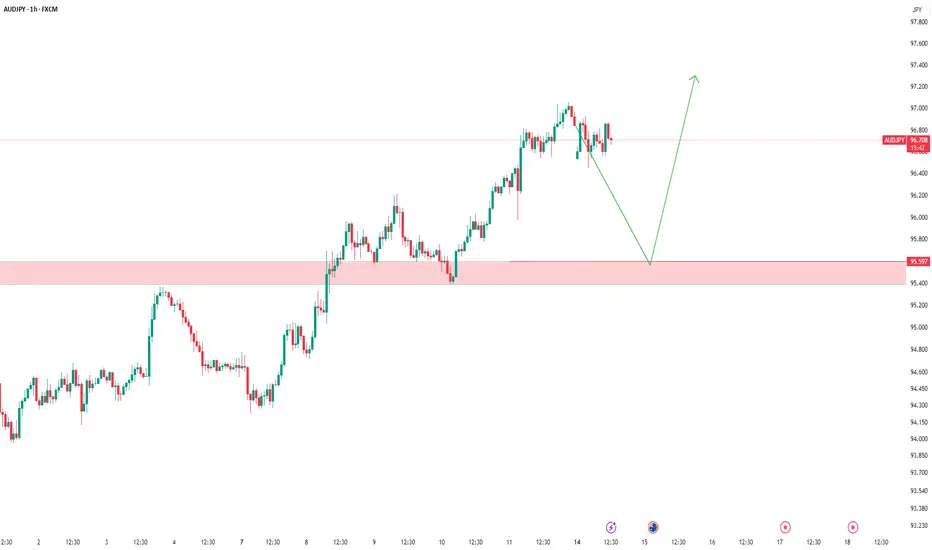
AUDJPY – Waiting for the Long SetupThe price is currently in a corrective move,
and as always, we’ve already marked our key level.
📍 We’re patiently waiting for price to reach our support zone.
If a valid buy signal appears, we’ll take the long position
according to our trading plan.
❌ What if the level breaks?
No worries.
We don’t predict — we follow the market.
We’ll wait for a clean pullback and enter short if confirmed.
🎯 Our job isn’t to predict where price will go,
our job is to manage risk and stay aligned with the market.
Price can do anything —
we’re ready for every scenario.
Audjpydaily
AUDJPY SHORT FORECAST Q2 W23 D2 Y25AUDJPY SHORT FORECAST Q2 W23 D2 Y25
Professional Risk Managers👋
Welcome back to another FRGNT chart update📈
Diving into some Forex setups using predominantly higher time frame order blocks alongside confirmation breaks of structure.
Let’s see what price action is telling us today! 👀
💡Here are some trade confluences📝
✅Weekly Order block rejection
✅15' Order block identification
✅4H 50EMA
✅Daily 50 EMA
🔑 Remember, to participate in trading comes always with a degree of risk, therefore as professional risk managers it remains vital that we stick to our risk management plan as well as our trading strategies.
📈The rest, we leave to the balance of probabilities.
💡Fail to plan. Plan to fail.
🏆It has always been that simple.
❤️Good luck with your trading journey, I shall see you at the very top.
🎯Trade consistent, FRGNT X

Bearish Outlook on AUD/JPY – Watching for Entry After Retrace!I'm currently focused on the AUD/JPY currency pair 📉.
We’re seeing a clear, sustained downtrend on the daily timeframe, marked by a recent break of market structure — a key sign that sellers are firmly in control 🐻.
At the moment, price appears overextended and is trading directly into a major liquidity pool — specifically, a cluster of sell-side liquidity sitting below previous lows 🧲.
I’m watching for a retracement or pullback into a zone of interest. If that happens, I’ll be on the lookout for a bearish break of structure on the lower timeframes to confirm a high-probability short setup 🎯.
As always, this is not financial advice, just a look at how I’m approaching the current price action ⚠️.

AUDJPY SHORT FORECAST Q2 W22 D26 Y25AUDJPY SHORT FORECAST Q2 W22 D26 Y25
Professional Risk Managers👋
Welcome back to another FRGNT chart update📈
Diving into some Forex setups using predominantly higher time frame order blocks alongside confirmation breaks of structure.
Let’s see what price action is telling us today! 👀
💡Here are some trade confluences📝
✅Weekly Order block rejection
✅4H Order block identification
✅15' Order block identification
✅4H 50EMA target
✅Daily 50 EMA target
🔑 Remember, to participate in trading comes always with a degree of risk, therefore as professional risk managers it remains vital that we stick to our risk management plan as well as our trading strategies.
📈The rest, we leave to the balance of probabilities.
💡Fail to plan. Plan to fail.
🏆It has always been that simple.
❤️Good luck with your trading journey, I shall see you at the very top.
🎯Trade consistent, FRGNT X

AUDJPY SHORT FORECAST Q2 W20 D15 Y25AUDJPY SHORT FORECAST Q2 W20 D15 Y25
Professional Risk Managers👋
Welcome back to another FRGNT chart update📈
Diving into some Forex setups using predominantly higher time frame order blocks alongside confirmation breaks of structure.
Let’s see what price action is telling us today!
💡Here are some trade confluences📝
✅Weekly order block rejection
✅Daily order block rejection
✅15' order block targets
✅Gap to be filled
🔑 Remember, to participate in trading comes always with a degree of risk, therefore as professional risk managers it remains vital that we stick to our risk management plan as well as our trading strategies.
📈The rest, we leave to the balance of probabilities.
💡Fail to plan. Plan to fail.
🏆It has always been that simple.
❤️Good luck with your trading journey, I shall see you at the very top.
🎯Trade consistent, FRGNT X

AUDJPY Breakout on Rising Yields – Path Open to 95.70AUDJPY is maintaining strong bullish structure after breaking through key resistance around 91.65. Price is forming higher lows supported by an ascending trendline, indicating healthy buyer momentum. Fibonacci retracement levels show price holding above the 50% and 61.8% zones, strengthening the bullish case.
🔑 Key Levels:
Current Price: 91.65
Support Zone: 90.85 – 91.00 (previous structure + fib support)
Resistance Targets:
TP1: 93.15 (previous swing high)
TP2: 95.70 (full recovery move from March highs)
✅ Bullish Confluence Factors:
Ascending triangle breakout in progress
Strong higher lows and clean market structure
Holding above major 61.8% Fib retracement
Australian dollar supported by improved risk sentiment globally
BOJ expected to stay dovish and delay hikes, keeping the yen weak
🧠 Fundamental Context:
Japan Outlook: BOJ to hold rates steady at 0.5% amid US tariff risks. IMF projects a downgrade in Japan’s growth, weakening JPY outlook.
Sentiment on JPY: No strong intervention support for yen despite media noise. Japan’s government denied any push for stronger yen.
Australia Outlook: Risk sentiment steady, equities firmer globally, and higher AUD correlations to risk-on tone favor upside continuation.
💡 Trade Idea:
Bias: Bullish above 91.00
Entry: On confirmation bounce above 91.60
Target 1: 93.15
Target 2: 95.70
Stop Loss: Below 90.50
📌 Note: Watch for possible mild pullback into 91.30-91.50 zone before new upside leg. Strong US data midweek could temporarily lift JPY but broader BOJ dovishness remains the driver.

AUDJPY SHORT FORECAST Q2 W19 D9 Y25AUDJPY SHORT FORECAST Q2 W19 D9 Y25
Professional Risk Managers👋
Welcome back to another FRGNT chart update📈
Diving into some Forex setups using predominantly higher time frame order blocks alongside confirmation breaks of structure.
Let’s see what price action is telling us today!
💡Here are some trade confluences📝
✅Weekly order block rejection
✅Daily order block rejection
✅15' order block targets
✅Weekly imbalance fill targets
🔑 Remember, to participate in trading comes always with a degree of risk, therefore as professional risk managers it remains vital that we stick to our risk management plan as well as our trading strategies.
📈The rest, we leave to the balance of probabilities.
💡Fail to plan. Plan to fail.
🏆It has always been that simple.
❤️Good luck with your trading journey, I shall see you at the very top.
🎯Trade consistent, FRGNT X

audjpy sell signal. Don't forget about stop-loss.
Write in the comments all your questions and instruments analysis of which you want to see.
Friends, push the like button, write a comment, and share with your mates - that would be the best THANK YOU.
P.S. I personally will open entry if the price will show it according to my strategy.
Always make your analysis before a trade

AUDJPY SHORT FORECAST Q2 W19 D7 Y25AUDJPY SHORT FORECAST Q2 W19 D7 Y25
Professional Risk Managers👋
Welcome back to another FRGNT chart update📈
Diving into some Forex setups using predominantly higher time frame order blocks alongside confirmation breaks of structure.
Let’s see what price action is telling us today!
💡Here are some trade confluences📝
✅Weekly order block rejection
✅Daily order block rejection
✅15' order block targets
✅Weekly imbalance fill targets
🔑 Remember, to participate in trading comes always with a degree of risk, therefore as professional risk managers it remains vital that we stick to our risk management plan as well as our trading strategies.
📈The rest, we leave to the balance of probabilities.
💡Fail to plan. Plan to fail.
🏆It has always been that simple.
❤️Good luck with your trading journey, I shall see you at the very top.
🎯Trade consistent, FRGNT X

audjpy buy signal. Don't forget about stop-loss.
Write in the comments all your questions and instruments analysis of which you want to see.
Friends, push the like button, write a comment, and share with your mates - that would be the best THANK YOU.
P.S. I personally will open entry if the price will show it according to my strategy.
Always make your analysis before a trade

audjpy analysis elliot. Don't forget about stop-loss.
Write in the comments all your questions and instruments analysis of which you want to see.
Friends, push the like button, write a comment, and share with your mates - that would be the best THANK YOU.
P.S. I personally will open entry if the price will show it according to my strategy.
Always make your analysis before a trade

audjpy buy signal. Don't forget about stop-loss.
Write in the comments all your questions and instruments analysis of which you want to see.
Friends, push the like button, write a comment, and share with your mates - that would be the best THANK YOU.
P.S. I personally will open entry if the price will show it according to my strategy.
Always make your analysis before a trade

AUDJPY Daily BiasThis price has been on a bearish momentum for the past few weeks, until there was a market structure shift at around the 96.73. I anticipate that the momentum might be bullish.
To confirm this, today's candle might be significant. If we close lower than Friday's Daily Candle, the price might be drawn towards the Daily FVG zone at 95.7. If we close above, we might have our bullish entry targeting 98.8.

AUDJPY SHORT: Caixin Services PMI lower than estimatedChina's January Caixin Services PMI was 51.0 vs. 52.2 in December. This shows a slowing service sector in China. As a result of this economic news release, the Australian dollar is expected to potentially weaken against the Japanese yen. We must remember that China is one of Australia's biggest trading partners, so anything that happens in China will almost always affect the Australian dollar.

AUD/JPY "Aussie vs Japanese" Forex Market Heist Plan on Bullish🌟Hi! Hola! Ola! Bonjour! Hallo!🌟
Dear Money Makers & Robbers, 🤑 💰
Based on 🔥Thief Trading style technical and fundamental analysis🔥, here is our master plan to heist the AUD/JPY "Aussie vs Japanese" Forex market. Please adhere to the strategy I've outlined in the chart, which emphasizes long entry. Our aim is the high-risk Red Zone. Risky level, overbought market, consolidation, trend reversal, trap at the level where traders and bearish robbers are stronger. Be wealthy and safe trade.💪🏆🎉
Entry 📈 : Traders & Thieves with New Entry A bull trade can be initiated on the MA level breakout of 98.400
However I advise placing Buy limit orders within a 15 or 30 minute timeframe. Entry from the most recent or closest low or high level should be in retest.
Stop Loss 🛑: Using the 4H period, the recent / nearest low or high level.
Goal 🎯: 101.300 (or) Escape Before the Target
Scalpers, take note 👀 : only scalp on the Long side. If you have a lot of money, you can go straight away; if not, you can join swing traders and carry out the robbery plan. Use trailing SL to safeguard your money 💰.
Fundamental Outlook 📰🗞️
AUD/JPY is a popular currency pair that can be influenced by various fundamental and macroeconomic factors. Here's a brief analysis to help you make an informed decision:
Fundamental Analysis---
Interest Rate Differential: The Reserve Bank of Australia (RBA) has been keeping interest rates relatively high compared to the Bank of Japan (BOJ). This difference can make the AUD more attractive to investors, potentially driving up the value of AUD/JPY.
Commodity Prices: Australia is a major exporter of commodities like iron ore, coal, and gold. An increase in commodity prices can boost the Australian economy and support the AUD.
Economic Growth: Australia's economy has been showing signs of resilience, with a growing services sector and a rebound in consumer spending. Japan's economy, on the other hand, has been facing challenges, including a declining population and low inflation.
Macroeconomic Analysis---
Global Risk Sentiment: AUD/JPY is often considered a risk-on/risk-off pair. When investors are risk-averse, they tend to sell AUD and buy JPY, causing the pair to decline. Conversely, when risk appetite increases, AUD/JPY tends to rise.
Yield Curve: The yield curve in Australia has been relatively steep compared to Japan, which can attract investors seeking higher returns.
Central Bank Policies: The RBA has been maintaining a hawkish stance, while the BOJ has been keeping its ultra-loose monetary policy. This contrast can influence the AUD/JPY exchange rate.
Technical Analysis---
The AUD/JPY chart is showing a bullish trend, with the pair trading above its 200-day moving average. The Relative Strength Index (RSI) is around 60, indicating a moderate bullish momentum.
Conclusion---
Based on the fundamental and macroeconomic analysis, it seems that AUD/JPY might continue its bullish trend. However, it's essential to keep an eye on global risk sentiment, commodity prices, and central bank policies, as these factors can influence the pair's direction.
Trading Alert⚠️ : News Releases and Position Management 📰 🗞️ 🚫🚏
As a reminder, news releases can have a significant impact on market prices and volatility. To minimize potential losses and protect your running positions,
we recommend the following:
Avoid taking new trades during news releases
Use trailing stop-loss orders to protect your running positions and lock in profits
Please note that this is a general analysis and not personalized investment advice. It's essential to consider your own risk tolerance and market analysis before making any investment decisions.
Keep in mind that these factors can change rapidly, and it's essential to stay up-to-date with market developments and adjust your analysis accordingly.
💖Supporting our robbery plan will enable us to effortlessly make and steal money 💰💵 Tell your friends, Colleagues and family to follow, like, and share. Boost the strength of our robbery team. Every day in this market make money with ease by using the Thief Trading Style.🏆💪🤝❤️🎉🚀
I'll see you soon with another heist plan, so stay tuned 🫂

AUDJPY buy signal. Don't forget about stop-loss.
Write in the comments all your questions and instruments analysis of which you want to see.
Friends, push the like button, write a comment, and share with your mates - that would be the best THANK YOU.
P.S. I personally will open entry if the price will show it according to my strategy.
Always make your analysis before a trade

audjpy buy signal. Don't forget about stop-loss.
Write in the comments all your questions and instruments analysis of which you want to see.
Friends, push the like button, write a comment, and share with your mates - that would be the best THANK YOU.
P.S. I personally will open entry if the price will show it according to my strategy.
Always make your analysis before a trade

AUDJPY ALERT!AUDJPY ALERT!
AMD pattern confirmed on the Weekly chart!
GET READY FOR A BIG DROP!
Stay alert and prepared for a potential sharp decline!
Follow our updates for timely analysis and trade signals!

AUDJPY LoongEver since this price touched its LL at 93.5, it has been filling the imbalance created by then the volatile bearish momentum.
So far, it has filled two of the three imbalances created, and I anticipate that the next bullish momentum will be to fill before it resumes with the bearish momentum.
Entry at 101.5, target at 102.9 and SL at 100.8

AUDJPY sell signal. Don't forget about stop-loss.
Write in the comments all your questions and instruments analysis of which you want to see.
Friends, push the like button, write a comment, and share with your mates - that would be the best THANK YOU.
P.S. I personally will open entry if the price will show it according to my strategy.
Always make your analysis before a trade
