AUDJPY - FOREX - 19. APR. 2021Welcome to our weekly trade setup ( AUDJPY )!
-
1 HOUR
Bearish market open and price action.
4 HOUR
Overall bearish waving market..
DAILY
Expecting more bearish pressure.
-
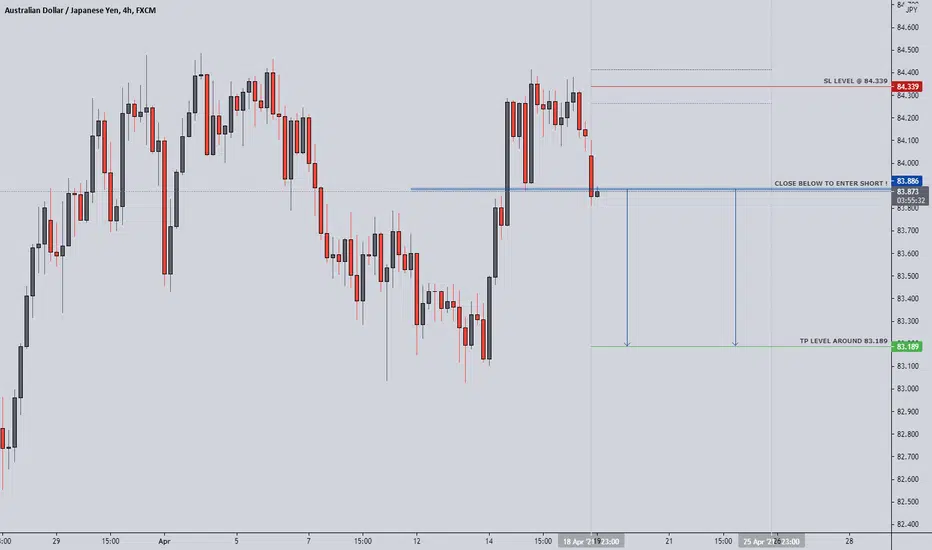
FOREX SETUP
SELL AUDJPY
ENTRY LEVEL @ 83.880
SL @ 84.340
TP @ 83.190
Max Risk: 0.5% - 1%!
(Remember to add a few pips to all levels - different Brokers!)
Leave us a comment or like to keep our content for free and alive.
Have a great week everyone!
ALAN
Audjpysell

[AUDJPY W3 APR 2021]AUDJPY
Short Setup
Counter trend trade
Continuation trade:
👉🏻 We have seen an impulse up on April Week 2 and now it has formed an ending diagonal on the 5th wave with a break of structure to the downside. A short term sell trade is favourable.


AUDJPY, 4hr tf, double top pattern in playTrade ideas for AUDJPY by Hardi
As you can see this pair also make a bearish pattern which is double top.
I've been watching this pair since last week and it looks like we might see further drop towards 82.40 area.
Sell AUDJPY 83.40
Stop loss 83.70
Take profit 82.40 (3.3R)
Use only 1-2% risk
Good luck


AUDJPY - SELL NOW !Welcome to our Trade Setups - April 06th ( AUDJPY ) !
SELL AUDJPY
ENTRY LEVEL @ 84.194
SL @ 84.827
TP @ 82.298
Max Risk: 1% - 3%!
Risk/Reward Ratio: 3
Leave us a comment or like to keep our content for free and alive.
Have a great week everyone!

AUDJPY - Too ObviousThis basic head and shoulders pattern after a huge impulsive move to the upside seems too obvious to be the catalyst for a trend change.
I would expect price to at least come up to test the previous high once again before it considers selling off.

AudJpy- Forming an H&S?AudJpy was in a strong uptrend since the beginning of November, now the pair is confirming the up-trendline break and is looking to form ann H&S.
A strong correction can follow from this point and the pair could drop to 80 zone.
Interim support is at 82.

AUDJPYHello everyone, if you like the idea, do not forget to support with a like and follow.
DISCLAIMER
________________
Forex trading and trading in other leveraged products involve a significant level of risk and are not suitable for all investors.


AUDJPY - Bears NearI am expecting a strong sell off on AUDJPY but It won't go without a fight. We could expect the price to push up into a lower time frame order block before reversing to the downside. This would wipe out the majority of the selling pressure from the area of interest.

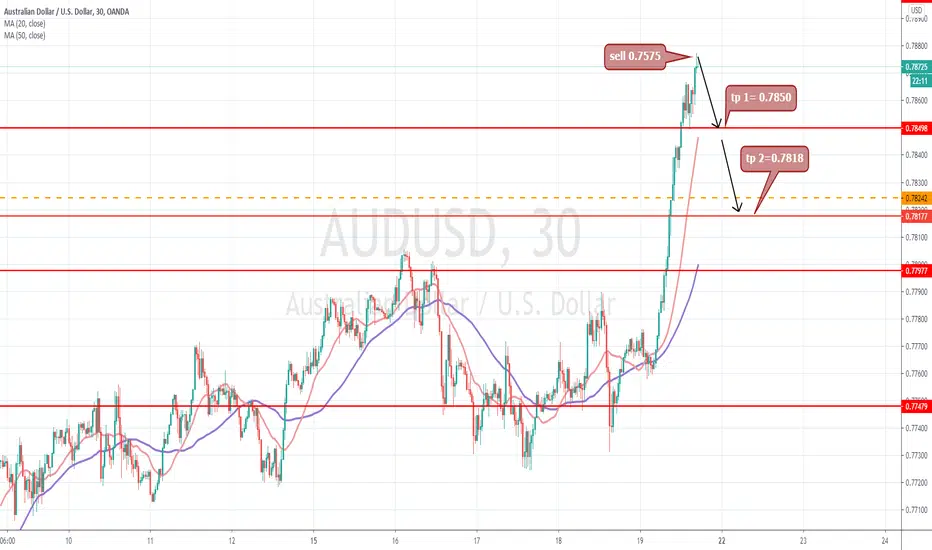
sell at 0.7875 and go to 0.7818 in 2 step so 57 pips1.we got near bad data all the week
2. he is much overbought
3. he just touched ma100 "monthly".
4. he need a legit correction.
5. if euity doiwn a bit it will help.
6. dollars are on support and oversold.
7.there a bearish rsi divergence in some time frame


AUDJPY – Nice BIG shifting of direction is happening!If you’re following my analysis, maybe maybe you guys are already bored with this, .. and I don't know how many times I've said it,.. but I want to say it once more,.. just be careful,.. the direction is starting to shift now,.. We are already seeing some nice shifting of direction these past 2 days and I’m expecting this to continue for a very long term.
The way the market move recently is a typical move and structure that I recognize to repeat itself and play over and over again. All risk currency keep going higher and higher in a corrective structure. Evenmore, they break significant inflection point area in daily timeframe just to retrace back impulsively like this. This is a common price move to catch more and more people on the wrongside of the market before the big real move start to happen. I do believe starting from now we will start to see a risk-off mood across all currency pairs, and when it does play, AUDJPY is surely one pair that we must keep an eye for.
In this pair, we can see a really nice ascending structure in multi high TF and it already showing us a nice rejection from the top of it.
I will wait for any break of continuation flag structure (minimum in H1 TF) to confirm the move to the downside.
I will just let the target open while trailling sl along the way as the market start to give a momentum. Lets see how far can this pair go.
On another hand, eventhough I see it as a least probable outcome, if the price break above the 25th February high at 85.000 area, it will nullify this forecast and I will wait for the market to shows it hand first by forming a better structure to see.
For now, let’s see how will this pair develop, good luck..
_______________________________________________________________________________________________________________________________________________________
Here is the MOA FX technical analysis, please comment below if you have any question.
The ENTRY in the market will be taken only if the condition of the MOA Fx strategy will trigger.
__________________________________________________________________________________________________________________________________________________________________

AUDJPY 4HHad a fake breakout. It might test Daily resistance zone and reverse. Look for short opportunity once rejection is confirmed

AUDJPY WEEKLY FORECASTAUDJPY PRICE REACHED WEEKLY RESISTANCE ZONE..THERE IS POSSIBLE PRICE CAN MOVE DOWNWARDS.....
AND BELOW THAT THERE IS FRESH DAY LEVEL SUPPORT ZONE..PRICE CAN MOVE UPWARDS...THEN GO LONG..
IF IT FAILS TO MOVE LONG THEN GO SHORT BELOW TO THAT ZONE..
